Contents
In conventional CCD cameras, "flatfields" make corrections for the pixel-to-pixel variations in sensitivity across a detector. The SNAP focal plane, with its many detectors, is larger and more complicated than ordinary cameras, and so involves additional sources of error. We use the term "flatfielding" to mean "correcting all types of systematic photometric errors across the SNAP focal plane."
In the ordinary "mowing" observational mode, the SNAP spacecraft will measure supernovae repeatedly, but always on the same set of detectors. There could very easily be small, but significant, systematic differences between, say, supernovae detected in column 3 of the East Quadrant and those detected in column 5 of the East Quadrant; or between those measured by column 3 of the East Quadrant and those measured by column 3 of the North Quadrant. These systematic differences, if not corrected, could become a dominant source of error in the cosmological calculations. It is therefore vital that we include in the SNAP operational plan special observations which can be used to characterize the several types of systematic error.
Someone else must write this section.
The spatial variation in response across the SNAP focal plane, called the flatfield, can be broken up into components on different spatial scales. Variations in the quantum efficiency of a detector from one pixel to its nearest neighbors are sure to occur on SNAP; they are caused by changes in the quantum efficiency of individual pixel and by "shadows" created by particles deposited on filters and detectors. These small-scale, pixel-to-pixel variations within a single chip are the major component of what are commonly called "flatfielding corrections."
In order to remove variations on these scales, we must measure some source which does not vary, either spatially or temporally. For small scale variations, we can use onboard light sources. If properly diffused across the focal plane, this light reveals variations in pixel-to-pixel response so that we can remove them later. By using onboard light sources, we gain precision by using high light-levels (beating down Poisson statistics) and allowing re-calibration to take place continually throughout the lifetime of SNAP.
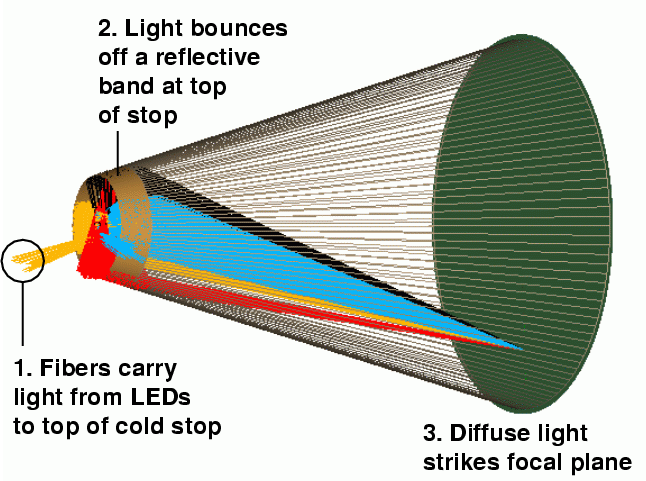
One method for illuminating the focal plane on SNAP that is currently being designed is the Ring of Fire (RoF) (see Scholl 2004 for a full description).

This method places illumination sources in an azimuthally-symmetric ring around the entrance to the cold stop. These sources illuminate diffusing material along the opposite wall of the cold stop which allows light to scatter to the focal plane in an azimuthally even pattern, befitting of the annular SNAP focal plane design. Although there will be an illumination gradient in the radial direction, its effect should not show up on small scales and can be well characterized pre and post-launch.
In this scheme, light from onboard lamps enters the optical system near its end; we do not currently have a scheme to allow such onboard source to illuminate the focal plane though the entire SNAP optical train. However, changes in the flat field due to the SNAP mirror assembly should be large-scale in nature and can likely be checked "star-flats" (discussed later) and with "super-flats" created from observations of the zodiacal light background.
The method of illuminating the focal plane with the RoF presents some interesting challenges and opportunities for calibration. In an ideal situation, one would like to illuminate the focal plane with a constant amount of light that has a calibrated irradiance. Traditionally, QTH lamps have been used in this role. It is unlikely that we could mount many lamp sources at that position with the space constraints at the entrance to the cold stop. In addition, experience shows that the gravitational loading during launch can change the irradiance of QTH lamps from their ground calibration. We plan to remedy this situation by using pulsed LEDs to illuminate fiber optics which deliver light to the RoF. LEDs are solid state devices that should be more stable on orbit than QTH lamps and can have controlled light output if pulsed on a low-duty cycle. They also have a wide variety of semi-narrowband wavelength ranges which help us to track changes in filter bandpasses over the SNAP lifetime. Coupled with an irradiance monitor on the SNAP focal plane (such as a calibrated photodiode), the RoF can produce a steady light-source system capable of removing small-scale variations and monitoring system response.
A single detector will often have significant large-scale variations in its quantum efficiency. By "large-scale", I mean "over many tens or hundreds of pixels", or "over signficant fractions of its entire extent." In addition to any which are intrinsic to the device, we will add this sort of variation when we divide images by the lamp flatfield images.
We can use "starflats" to identify these errors. The basic idea, as described by Manfroid (1995) or van der Marel (2003), is to take a series of exposures of a starfield, moving the telescope in a grid pattern so that each star is measured at many locations on a single chip. One can fit a model to the variations in observed magnitude as a function of position.
Manfroid states that a 3x3 or 4x4 grid of measurements of a field of 10-20 stars yields excellent results. On the SNAP focal plane, each detector subtends roughly 0.01 square degrees. Using counts of stars near the SNAP North field, we calculate the following cumulative statistics for number of stars falling on a single detector or filter (the optical CCDs may have 4 filters covering the quadrants of a single chip):
                       stars               stars
     V mag range       per chip       per filter (1/4 chip)
     ---------------------------------------------------------
     14.0 - 17.0         7                   2
     15.0 - 18.0        11                   3
     16.0 - 19.0        15                   4
     17.0 - 20.0        22                   6
     18.0 - 21.0        35                   9
     19.0 - 22.0        60                  15
     20.0 - 23.0        89                  22
     ----------------------------------------------------------
If we require 20 stars per chip (filter) to appear in a typical grid image, this suggests we concentrate on stars in the range from V = 17-20 (20-23). Calculations of the signal-to-noise ratio in SNAP images indicate that a star of magnitude V=20 will have S/N=100 in an exposure of roughly 100 seconds.
To first order, the variations we consider here should not depend strongly on stellar color.
Required observations: a series of exposures while moving the telescope over a grid (say, 4x4 or 5x5 positions) which covers a single chip; another set of grid exposures which move stars over a single filter covering one quadrant of an optical CCD.
We can expect each chip to have a slightly different overall quantum efficiency due to variations in the manufacturing process, especially if devices are taken from different lots. As a star moves from one detector of a given sort to another, its observed magnitude will therefore jump by some small amount.
We can determine these variations simply by moving stars from one detector to another of the same sort: that is, from an optical CCD with filter 2 to another optical CCD with filter 2. Note that this requires both relatively short offsets -- for detectors within the same quadrant of the focal plane -- and large offsets -- for detectors in different quadrants.
To first order, we may treat these corrections as independent of stellar color.
Required observations: a series of exposures while moving the telescope so that stars move from one detector to all the others of the same sort.
Current designs call for four mechanical shutters near the Cassegrain focus of the telescope; see the Cassegrain Shutter document (Jelinsky 2004). Each shutter would open to allow light to reach one of the four quadrants of the focal plane. As the shutter blade rotates open, it exposes to light the inner portion of the focal plane for a slightly longer time than the outer portion. This leads to exposure times which vary across the focal plane.
Because the shutter blades move quickly (in roughly 50-80 milliseconds), this effect is significant only for short exposure times, less than 10 or 20 seconds. Jelinsky notes that it is possible to design a system to measure the motion of the blades very accurately, to within 1 millisecond, so that one could make accurate corrections with a good optical model. There are two routes one can take here:
Jelinsky (2004) and Lampton (2003, 2004) describe both methods in some detail. It seems reasonable to do both: calculate the expected variation based on the design, and then check it once in orbit.
The effect is largest for short exposures. Consider a 1-second image: calculations indicate that stars of magnitude V=15 will yield a S/N ratio of 100-300 (highest for red stars measured on the infrared detectors). Most of the stars in the SNAP North field at this magnitude will be of spectral type G and K, which yield S/N approximately 100 in all filters; this corresponds to scatter of about 1 percent from one image to the next. Jelinsky suggests that the size of the shutter effect will be roughly 5 percent for a 1-second exposure. Thus, stars of magnitude V=15 and perhaps a big fainter should show the effect clearly above random noise. Each shutter blade covers a single quadrant of the focal plane, which contains 18 detectors; each detector subtends roughly 0.01 square degrees, so a quadrant samples about 0.18 square degrees. In the magnitude range V=14 to V=17, we expect roughly 130 stars to be detected on each quadrant. This appears sufficient to measure the shutter effect empirically to high precision.
Required observations: a series of exposures with lengths running over a large range; say, 0.5, 1, 2, 3, 5, 10, 20, 50, 100, 200, 300 seconds. The telescope should remain fixed at one pointing during the series; it may also be possible to use a set of images with very small dithers of a few arcseconds for this purpose.
Although we will provide a clear specification for the SNAP filters, it is possible that small deviations may occur during the manufacturing process. Even if we measure the filters precisely before launch, it is possible that the passbands may shift somewhat after launch, or over the lifetime of the entire mission. How would these changes in effective passband affect the photometry of stars?
We may approximate such deviations from the fiducial passbands as shifts in central wavelength. A study of passband shifts shows there is a clear pattern in the errors such shifts will produce in stellar photometry. The pattern is:
    Type of         As central wavelength of filter shifts
    star               blueward                 redward
    --------------------------------------------------------
     hot blue         grow fainter             grow brighter

     cool red         grow brighter            grow fainter
    --------------------------------------------------------
The amplitude of these changes is largest in the bluest filters of the optical CCDs and smallest in the infrared filters.
We can look for
Required observations:
If the SNAP filters depend on interference rather than colored glass, there will be significant shifts in the bandpass as a function of the angle with which light strikes the filters. From the inner edge to the outer edge of the focal plane annulus, this angle of incidence varies from about 0.14 to 0.28 radians. How will this affect measurements of stars?
Our analysis indicates a simple pattern that should appear as stars move radially away from the center of the focal plane: blue stars grow brighter, and red stars grow fainter. Therefore, one can characterize this effect by taking a series of images and looking at the change in instrumental magnitude as a function of stellar color and distance away from the center of the focal plane.
Required observations: a series of exposures in which stars move (radially) across a single filter, and (radially) from one instance of a filter to another instance of the same filter. Look for changes as a function of stellar color.
It is possible that the optics may cause small differences in illumination on very large scales across the focal plane; we might call such effects "vignetting." Note that such effects could not be detected using images of the internal lamps, since that light does not pass through the optics.
Preliminary estimates are that any such effects would depend only very weakly on the wavelength of light, and hence only very weakly on stellar color. We believe that these very large-scale variations would be removed by the application of corrections already mentioned; specifically,
Required observations: None.
We end up with the following list of stellar exposures to determine "flatfield" corrections:
We plan to make these special observations at the start of the mission and periodically thereafter.
Several astronomers have considered the ways in which one can use multiple observations of stars at different locations locations across the field to derive the variations in sensitivity across a detector.
In our early analysis, we have so far followed the classical approach: treat both the magnitudes of field stars and properties of the detector as unknowns, and solve for all simultaneously. SNAP will look at relatively sparse fields, far from the galactic plane; during the short exposures we plan for calibration purposes, it will detect relatively few stars bright enough to have neglible photon noise. With only a few hundred to a few thousand stars serving as the sources in our calculations, we have no need to optimize our algorithms for speed or memory usage.
As an example, we provide an explicit description of one photometric equation we have used in our simulations. Consider the conversion of an instrumental magnitude m to its equivalent M on some standard system. With a perfect single detector, one would simply make a single shift:
M = m + a
where a is a zero-point offset term.
However, there are 72 different chips in the SNAP focal plane, which makes the equation
          M   =   m   +  a
                          i
where a_i is the zero point for chip i.
If the instrumental bandpass doesn't match the standard bandpass exactly, then there will be small corrections which depend on the color of the star.
          M   =   m   +  a    +  b  * (color)
                          i       j
where b_j is the first-order color term
for a particular chip+filter, and color is some
measure of the star's color.
But the effective bandpass will shift slightly across each chip+detector, because the angle of incidence will change. We may need to take this into account, in which case we would need to replace the single color term with a more complicated expression:
          M   =   m   +  a    +  b1  * (color)  +  b2  * theta * (color)
                          i        j                 j
where we now have a constant b1 and a slope b2
term for each chip+detector, and theta is the angle
of incidence at which light strikes the detector.
If the sensitivity of each chip is not perfectly uniform across its face, then we need to correct for this "small-scale" flatfielding error. We might approximate the changes in sensitivity as a low-order polynomial function p of (row, col) position on the chip.
          M   =   m   +  a    +  b1  * (color)  +  b2  * theta * (color)
                          i        j                 j


                                                 2
                      +  p1  * row   +  p2  * row    +
                           i              i

                                                 2
                      +  p3  * col   +  p4  * col    +
                           i              i
Note a significant difference between these simulations and our experiments with real data. The real data consists of measurements made with a single CCD which is centered on the optical axis of its telescope; as a result, the large-scale variations are radially symmetric around the center of the chip. The simulated data, on the other hand, come from detectors scattered all over the SNAP focal plane, all of which are far from the optical axis. We therefore expect asymmetric patterns in sensitivity across each detector.
We have not yet put the color-dependent terms (b1 and b2 in the equations above) into our simulations and analysis.
It is likely that after SNAP has gathered months or years worth of measurements of stars in its ordinary operations, we will want to analyze this much larger collection of relatively faint stars to look for small, uncorrected systematic errors. In that case, it might well be prudent to follow the methods set forth by van der Marel (2003) in order to speed up the computations.
We are testing this general approach to characterizing variations in sensitivity in two ways: by making repeated observations of star fields with a real telescope, and by running artificial data through a simulation of the SNAP telescope. Let us describe briefly our analysis in each case.
We have acquired images in several passbands of open clusters over several nights with the S2KB CCD camera on the WIYN 0.9-m telescope. We move the telescope between exposures to make a 4x4 or 5x5 grid of images, so that each star appears at many locations across the detector. We observed the same fields on several different runs in order to see how repeatable the large-scale variations might be from one night to the next.
In our analysis of this data, we follow the method outlined by Manfroid. First, we calculate the mean magnitude for all stars that have Poisson noise in their photometry below one percent. We then construct a chi-square statistic of deviations from the mean magnitude as a function of postion on the chip and minimize the chi-square using an appropriate function of position on the focal plane. For our particular data, we find that a function combining a gaussian core with lorentzian wings yields the best results; unlike high-order polynomials, this function allows for a small number of parameters to fit large central deviations and yet is well behaved at the edges of the chip.
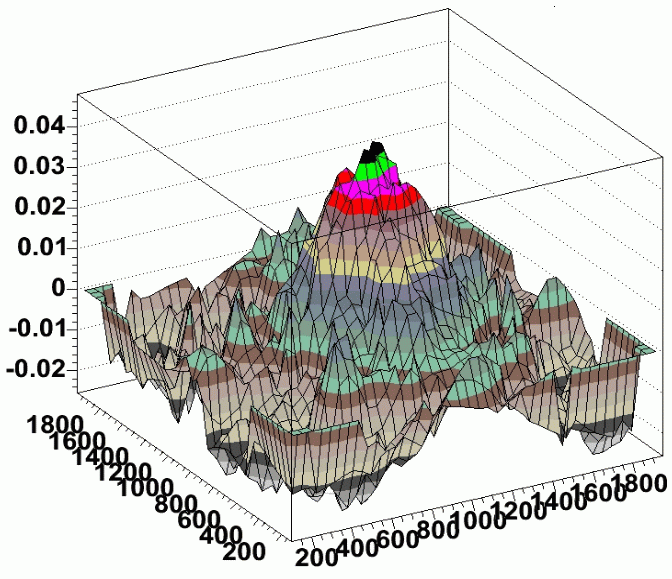
Residuals in photometry (magnitudes) as a function of position
on the detector (pixels) for data taken at WIYN.
We find that both ordinary domeflats and flatfields created from images of the twilight sky leave significant large-scale patterns of residuals in the photometry, as shown in the figure above. However, if we create a special "starflat" using images of one field, and then apply that correction to images of another field, we find that the position-dependent residuals in the photometry disappear.
We are continuing to analyze this dataset in order to see how much the variations in sensitivity depend on wavelength.
We have written a self-contained package for simulating various effects involving variations across the SNAP focal plane. The code is written in a mixture of TCL and C, and is freely available.
This is not a pixel-level simulator; its basic units are stellar measurements. The user provides an input set containing
The program carries out a set of observations, calculating the magnitudes which would be produced in each image from each chip. Although the calculations do not treat individual pixels in each detector, they do include the effects of photon noise, dark current, and other effects on a statistical level.
To illustrate the purpose of this photometric simulator, we show below an example of one set of tests which were made with it.
The input stars in this simulation are based on the USNO-A2.0 catalog of the Northern SNAP field. We point the telescope at RA=270 degrees, Dec=+67 degrees, and then consider only the eastern quadrant of the detector. We include all stars with B and R magnitudes brighter than 18.0, in a one-degree box around the center of the eastern quadrant (RA=271.28, Dec=67.0). That yields about 1840 stars. We assign a spectral type to each star based on its (B-R) color from the USNO-A2.0 catalog. Click on the image below for a larger version.
We used both a simplified, "monochromatic" version of the focal plane, in which all detectors were optical CCDs with fiducial filter 5,
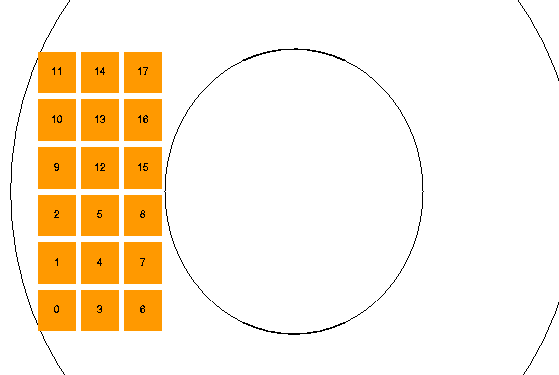
and a realistic focal plane, with a block of optical CCDs and a block of near-IR detectors:
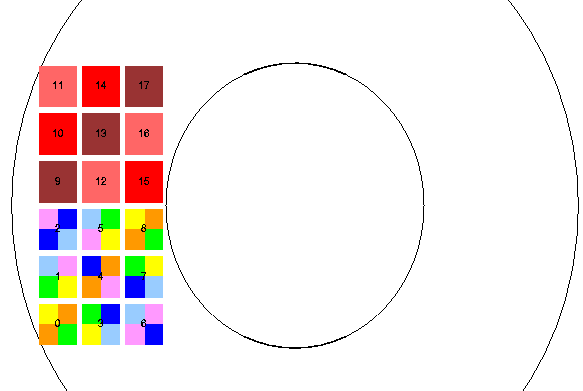
We moved the simulated telescope in a 6x6 grid-like pattern, so that some stars would move across one entire block, appearing at least once on each visible CCD, or at least once on each near-IR detector.
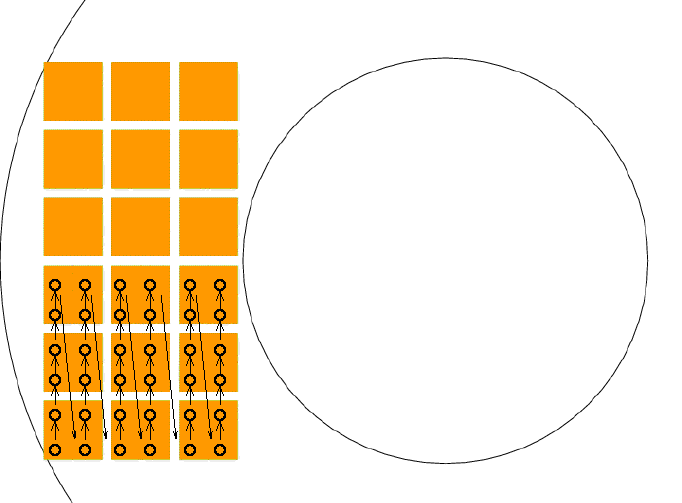
All exposures were 10 seconds long. We used two modes of observing:
Of course, in any particular snapshot, some stars will fall between detectors. Our analysis used Honeycutt's inhomogeneous ensemble photometry technique, including any stars which are detected on at least 10 images.
We did NOT include any of these complicating effects:
The simulator can add all these effects to the "observations", but we are not yet ready to analyze the results in an automated fashion.
In this preliminary simulation, we checked to see how well one can determine the chip-to-chip offsets from a set of exposures which move across a field of stars. We find