I have tried to estimate the number of stars of each spectral type as a function of magnitude in the area of the northern SNAP field. The "spectral types" are really rough estimates based on (B-V) color. The data come from these sources:
The values in the table below are roughly normalized to number of stars of each type per square degree. I used the SDSS as a fiducial and made a small (20%) correction to the FSVS values since I suspect there may be overlap in the FSVS fields.
# MWR 5/8/2003
#
#                    Master table of "stars" per square degree
#                 "mag" means V-band or approximation thereof
#
#            first bunch: from Tycho-2
#           second bunch: from SDSS
#            third bunch: from FSVS
#                 (note last row, mag 23-24, based on incomplete data)
#                 (FSVS data for blue stars is contaminated by QSOs)
#
#                          O       B       A       F       G       K       M    sum
#----------------------------------------------------------------------------------
  7.0 < mag <  8.0      0.00    0.00    0.05    0.06    0.05    0.22    0.04
  8.0 < mag <  9.0      0.00    0.04    0.15    0.29    0.26    0.65    0.05
  9.0 < mag < 10.0      0.00    0.04    0.14    0.55    0.62    1.14    0.01
 10.0 < mag < 11.0      0.00    0.01    0.04    0.38    0.24    0.58    0.00

 14.0 < mag < 15.0      0.91    0.91    0.91   18.18   66.36   30.00    3.64    120
 15.0 < mag < 16.0      2.73    0.00    0.00   19.09  140.00   77.27   11.82    251
 16.0 < mag < 17.0      0.00    0.91    0.00   23.64  160.00  125.45   40.91    351
 17.0 < mag < 18.0      0.00    0.00    0.00   49.09  171.82  190.91   83.64    495

 18.0 < mag < 19.0       2.3     2.3     4.6   101.9   270.8   203.7    48.6    634
 19.0 < mag < 20.0       0.0     9.3    32.4   213.0   280.1   432.9   143.5   1111
 20.0 < mag < 21.0      11.6    34.7    85.6   347.2   319.4   701.4   312.5   1812
 21.0 < mag < 22.0      18.5    99.5   284.7   671.3   631.9   967.6   456.0   3129
 22.0 < mag < 23.0      71.8   298.6   777.8  1196.8  1034.7  1106.5   557.9   5044
 23.0 < mag < 24.0 *   250.0   655.1  1275.5  1287.0   794.0   400.5   127.3   4789
#----------------------------------------------------------------------------------
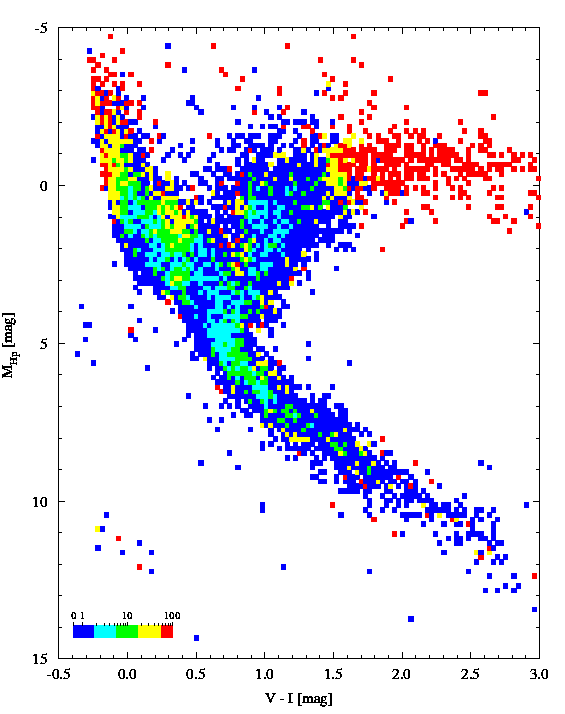
Which stars are most likely to be variable, and which to be constant? One good estimate comes from the Tycho catalog. Because the Hipparcos satellite scanned the sky many times over a three-year mission, it could detect variability over different timescales. Below is a plot showing variability as a function of (V-I) color and absolute V magnitude. The color code runs from "0 percent are variable" (dark blue) through "100 percent are variable" (red). Note that "variable" means as measured by the Hipparcos satellite over its three-year mission, at a threshold which varies with apparent magnitude.

Note that the most constant stars lie in the range 1.0 < (V-I) < 1.5, which corresponds roughly to K stars. The range 0.5 < (V-I) < 1.0, corresponding roughly to F stars, is only slightly worse.
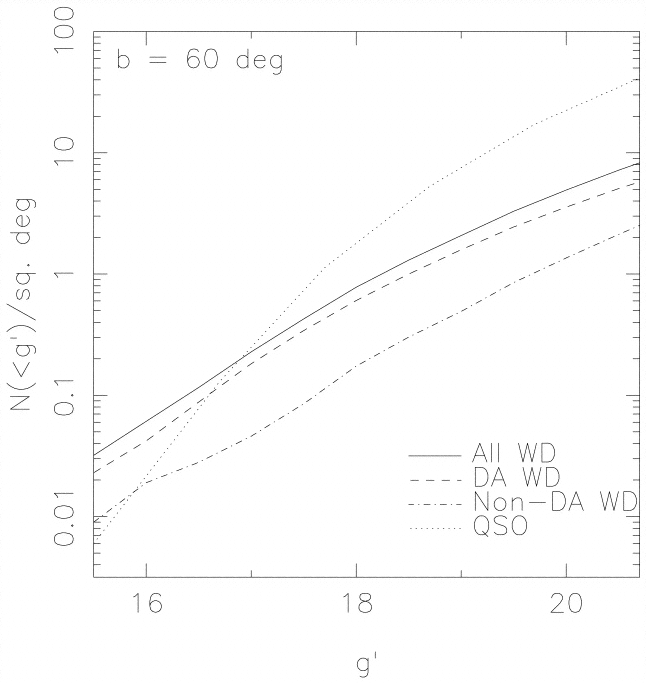
How many white dwarfs can we expect to find? According to Fan (AJ 117, 2528, 1999) , there are roughly 4 white dwarfs per square degree at magnitudes brighter than 19 at the SNAP field's galactic latitude. The number of quasars -- many of which have blue colors similar to WDs -- grows quickly at fainter magnitudes and overwhelms the WDs, as this figure from Fan shows (note the galactic latitude is +60, rather than the SNAP field's +43, so this is somewhat worse than we will encounter).

Added 5/12/2003: A study of white dwarfs confirmed spectroscopically in the SDSS (Harris et al., 2003, accepted in AJ) confirms the density of white dwarfs in the range between magnitude 15 and 19: about five per square degree.
The steep increase in "O" and "B" stars in the tables above is due in large part to the number of QSOs which sneak in "stellar" catalogs at faint magnitudes.
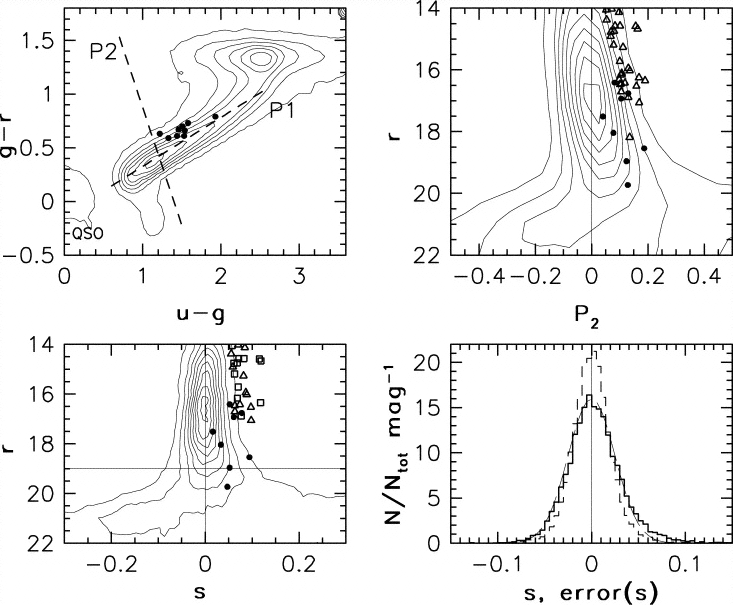
One class of stars which we'd like to identify is K giants. First, they are less likely to vary than K dwarfs; second, we need to know the stellar class in order to do accurate spectrophotometry. Can we distinguish dwarfs from giants, at least well enough to make a list of candidates for followup work? Helmi et al. (ApJ 586, 195, 2003) have found that they can separate metal-poor giants from metal-poor dwarfs reasonably well using SDSS colors. Here's a copy of their Figure 1, together with its caption.
Top left panel: Contours show the distribution of 19,000 stars with r < 19 in
the g-r vs. u-g color-color diagram. A sample of metal-poor giants discovered
by the SPS is shown by solid circles (all panels); note that they are offset
from the locus center. The dashed lines show a principal axes system aligned
with the locus.

Top right panel: r vs. P2 color-magnitude diagram.

Bottom left panel: s vs. P2 diagram, where s is derived from
P2 by accounting for the
magnitude dependence.

The thick solid histogram in the bottom right panel shows
the distribution of s for stars brighter than r = 19 from run 125 that were
also observed in run 1755. The dashed histogram shows the s error distribution
determined from multiple observations. The thin solid curve is a best Gaussian
fit to the s color distribution and shows that the latter is not symmetric: the
red wing has more stars than the blue wing. The candidate giants from the
spectroscopic sample discussed in § 3.2 are shown by triangles in the upper
right panel and divided into confirmed giants (squares) and dwarfs (triangles)
in the bottom left panel.

Using the selection criteria of Helmi et al., I find in the two SDSS fields flanking the SNAP field
                  metal-poor giant candidate selection
        stars per square degree with (r < 19) and appropriate colors

               candidate giant     non candidate
                     22                 814
In other words, about three percent of the stars with appropriate colors (G and K star colors, approximately) pass the Helmi et al. giant criteria. Helmi et al. found that roughly 50 percent of their giant candidates turned out to be giants. However, that sample was biased towards brighter stars (r < 17), and the success rate will drop at fainter magnitudes.
This method provides a good first cut at selecting giants, but may yield enough false positive (especially for fainter stars) that we could use a second, more efficient method before going for spectroscopy of individual stars.
The bottom line is that we may expect to find a few F-K giants per square degree in the northern SNAP field.
In other words, the numbers of white dwarfs and F-K giants are likely to be very approximately the same in the range between fifteenth and nineteenth magnitude.