I have added some new capabilities to my simulator:
This is still a primitive tool: it assumes that all the star's light falls within the aperture. I also use a single aperture size for light of all wavelengths; in real life, since the PSF would increase at longer wavelengths, one would choose a different aperture size for each passband. Nonetheless, its results may be useful for some planning purposes.
The values below assume:
I follow Howell's article on "Two-Dimensional Aperture Photometry" in the calculation of signal, noise, and signal-to-noise ratio within the aperture.
For each exposure time, the table contains three columns -- one each for a star of spectral class A0V, G0V and M0V -- and rows showing the signal-to-noise ratio for stars of magnitude V=15, V=20, V=25 through each of the passbands. The uncertainty in a magnitude measurement can be estimated from the signal-to-noise ratio like so:
                                   1.0
          mag_uncertainty  =  ---------------
                              signal_to_noise
So, for example, a star with signal-to-noise of 50 would have an uncertainty of about 0.02 magnitudes.
Here is the output in tabular form; I'll present graphs later in this document.
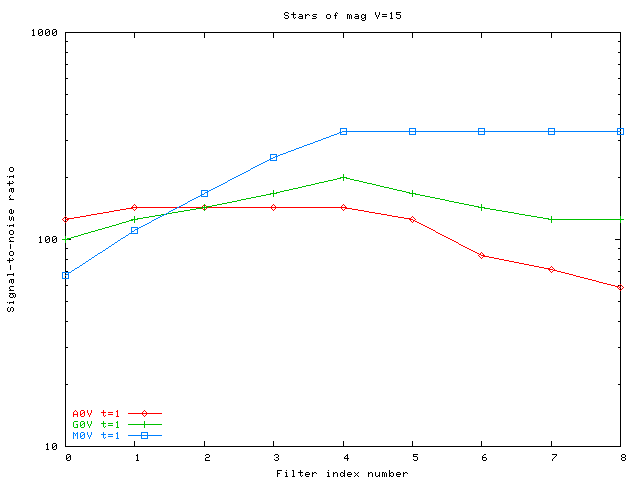
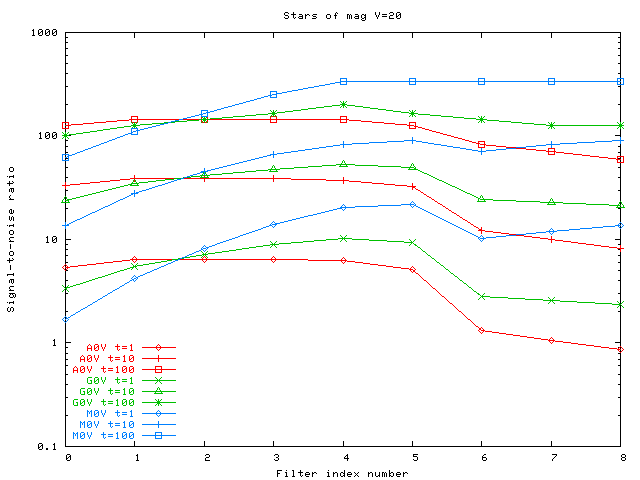
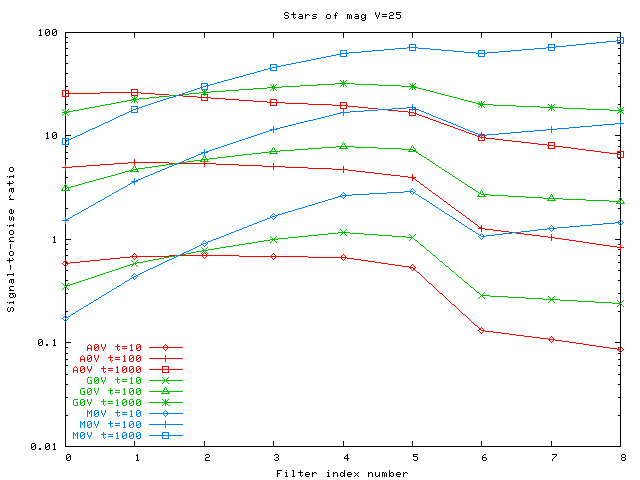
The graphs below show the signal-to-noise ratio (logarithmic) for each of the 9 SNAP filters. My numerical output doesn't provide meaningful numbers for S/N greater than 1000 (uncertainties less than 0.001 mag), and I've included only data which falls in an interesting portion of parameter space.
Stars with magnitudes V=15:
Stars with magnitudes V=20:
Stars with magnitudes V=25:
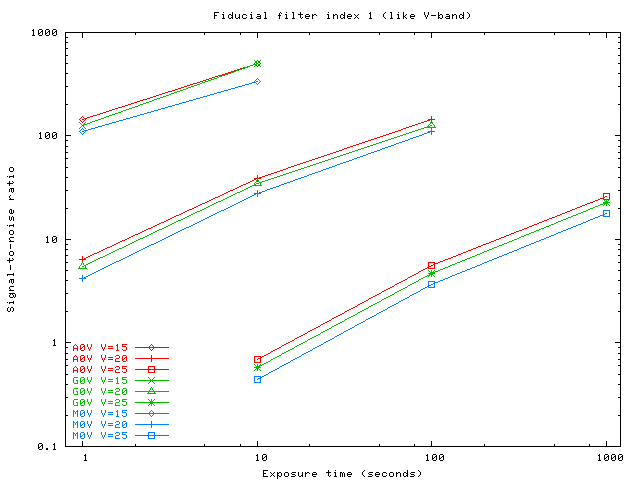
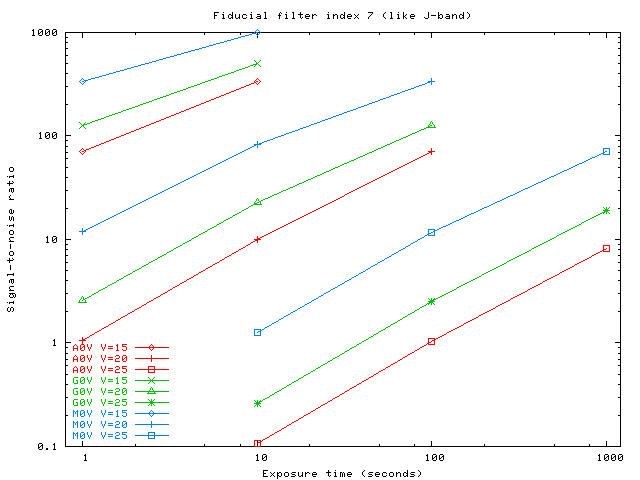
We can also plot the signal-to-noise ratio as a function of exposure time. In the graphs below, I choose only three filters from the entire set; in my notation, the indices run from 0 to 8.
Note that the difference in signal-to-noise between stars of the same V-band magnitude, but different spectral types, is small in the blue portion of the visible, rises towards the red, and becomes very large in the near-IR. This occurs simply because I chose to compare stars with the same V-band magnitude; had I chosen stars with the same J-band magnitude, the trends would be reversed.
Filter index 1 (similar to V-band):
Filter index 5 (similar to I-band):
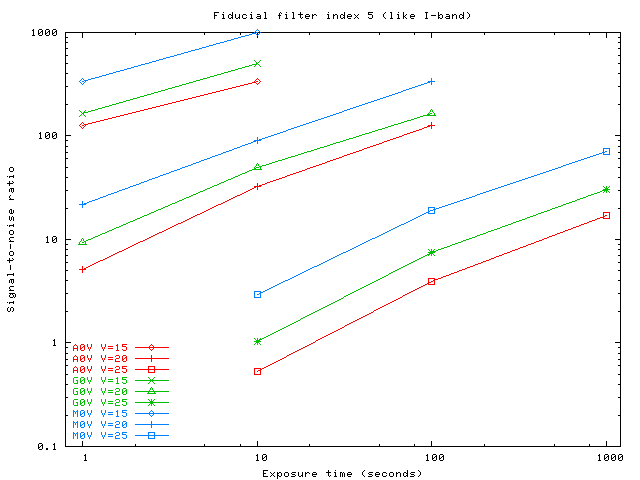
Filter index 7 (similar to J-band):
At which exposure time in each filter does the noise from background sky equal the readout noise? Assuming readout noise of 4 electrons per pixel in the visible, and 20 electrons per pixel in the infrared (which is somewhat lower than the IR devices tested so far can provide -- see Tarle's plenary talk from the 2004 Collaboration Meeting -- but somewhat higher than the desired value), I find the following.
   Filter         exposure (seconds)
 ------------------------------------
     0               443
     1               254
     2               175
     3               127
     4               104
     5               125

     6              1735
     7              1977
     8              2148
 -----------------------------------
One might conclude that if the actual readout noise is similar to the values I've assumed, and if the exposure times are a few hundreds of seconds,