 Copyright © Michael Richmond.
This work is licensed under a Creative Commons License.
Copyright © Michael Richmond.
This work is licensed under a Creative Commons License.
For hundreds of years, astronomers have been using a very versatile instrument to measure the brightness of stars in the sky:
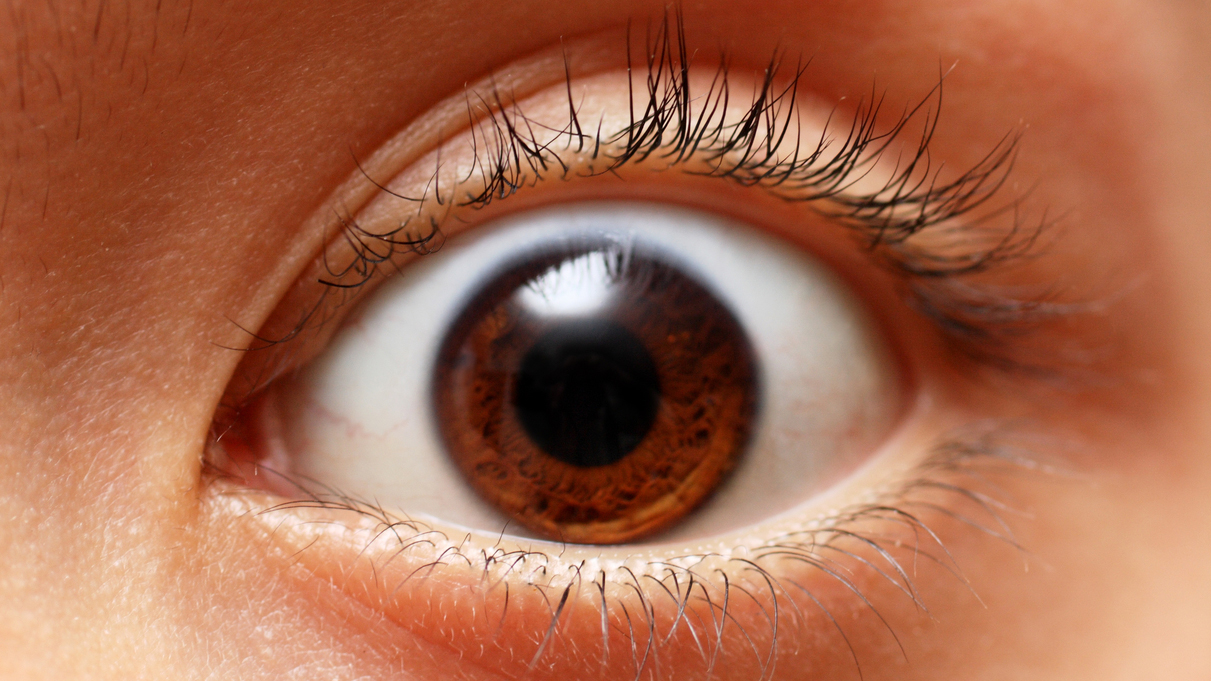
Image courtesy of
Jezebel.com
It's easy to use, always available, and requires no external power supply or electrical connections. The one drawback of the human eye is that its reponse is somewhat non-linear.
Suppose we look at two stars, A and B. If B is twice as bright as A -- by which we mean that star B sends twice as many photons into the eye each second as star A -- then we might expect the eye-plus-brain to decide that star B is, well, twice as bright as star A. But that doesn't happen: our brain tends to perceive star B as somewhat LESS than twice as bright as star A, especially when the differences are large.
Fortunately, the eye is very good at relative measurements: we can accurately determine that B is brighter than A, and C is brighter than B, and so forth. Therefore, as long as we have a good set of reference objects, it turns out that we humans can do a pretty darn good job of estimating the brightness of some particular star of interest.
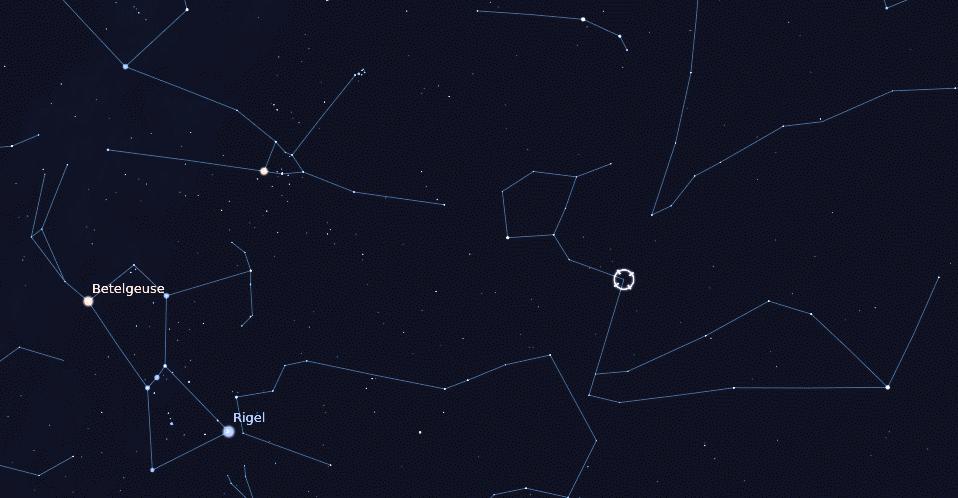
Let me show you what I mean. You may know the star Mira, near the tail of Cetus the Whale:
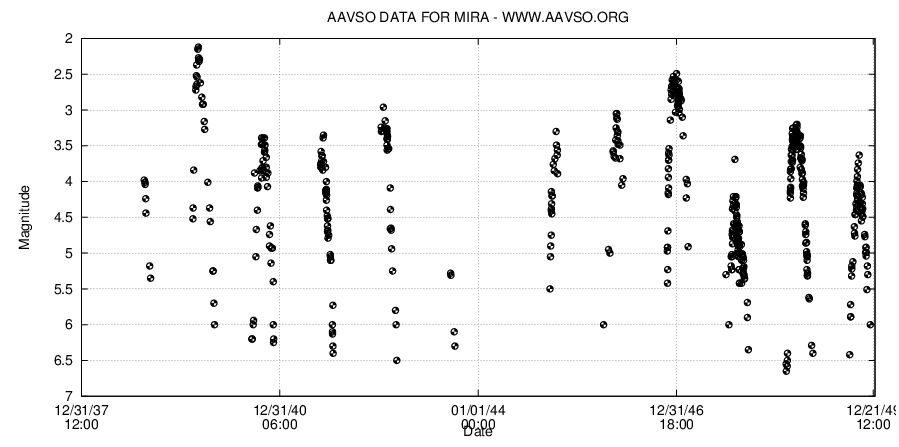
Astronomers noticed that this star changed in brightness strongly over periods of months, sometimes growing so faint as to disappear. Here are measurements made from 1838 to 1850 (yes, that's more than 150 years ago), in a graph created by the AAVSO's Light Curve Generator:
Mira: 1838 - 1850
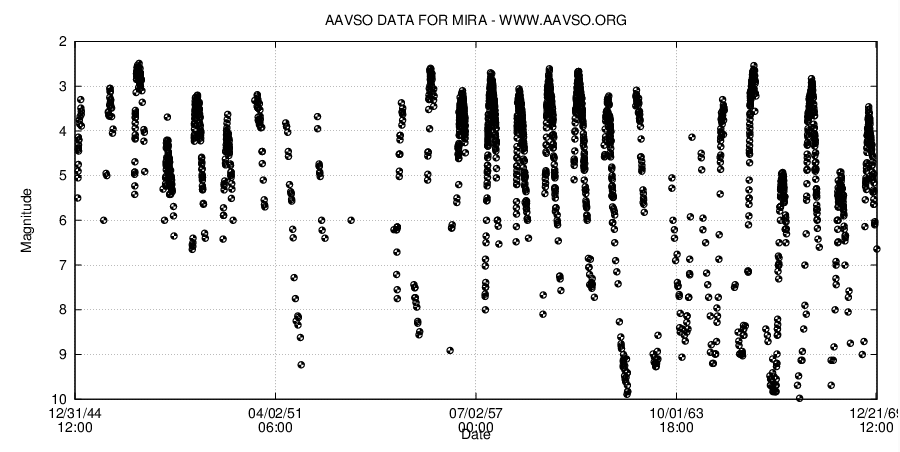
After 1850, some observers began to use telescopes to follow the star even when it was invisible to the naked eye.
Mira: 1845 - 1870
In recent years, AAVSO observers have grown more numerous, and share observing techniques and reference materials. As a result, our knowledge of Mira's behavior is excellent:
Mira: 1990 - 2015
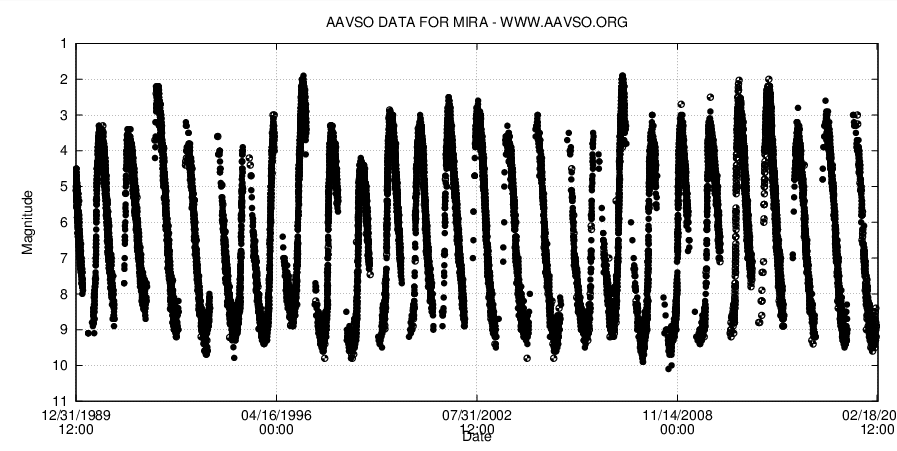
Based on this long history of measurements, we can measure a period of about 332 days. Mira is one of large group of giant stars with very large, diffuse envelopes. Pulsations of this envelope cause the star to change its size, temperature and brightness over many months.
It turns out that many stars go through a similar variable phase, late in their evolution. Best of all, the period of these pulsing giants is connected (somewhat loosely) to their luminosity.
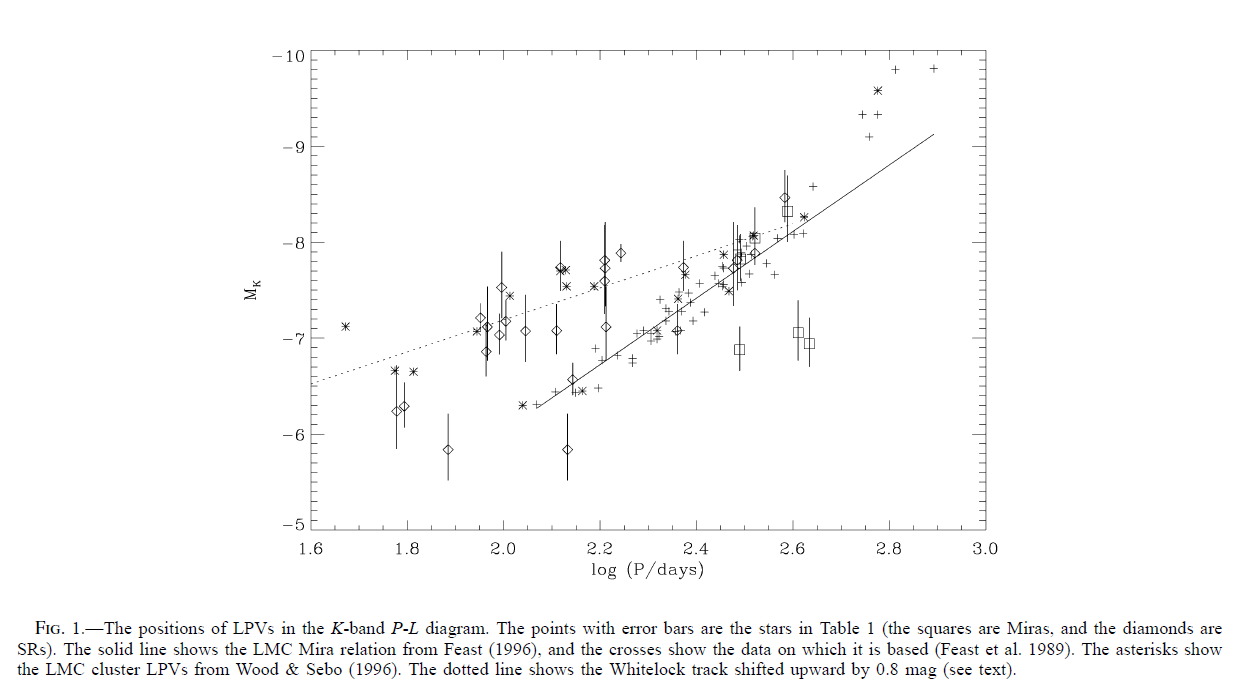
Figure 1 from
Timothy R. Bedding and Albert A. Zijlstra, ApJ 506, L47 (1998)
That means that if we can measure the period of a Mira-type variable star (which is pretty easy), and the apparent brightness of a Mira-type variable star (also pretty easy), we can figure out at least a rough estimate of its distance!
Another strength of visual measurements is their flexibility. Astronomers who want to use an instrument mounted on a big telescope, or an instrument in space, must make requests many months ahead of time; if something new and exciting happens all of a sudden, it's hard to re-arrange schedules. But visual observers control their own instruments, and can respond quickly when circumstances arise.
Consider the case of the variable star SS Cygni. For decades, AAVSO members have been monitoring its behavior. Its light curve features frequent outbursts: some relatively broad, some narrow:
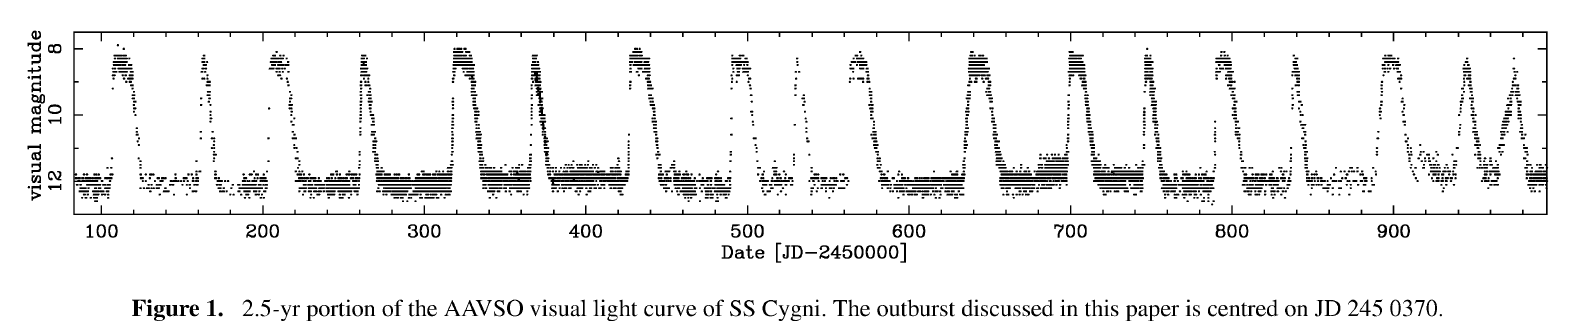
Figure 1 from
The X-ray and extreme-ultraviolet flux evolution of SS Cygni throughout outburst
MNRAS 345, 49 (2003)
Astronomers wanted to study this star in outburst with X-ray and ultraviolet telescopes in orbit, simultaneously with visual observations from the ground. However, they couldn't schedule the ground-based observations in advance, because they didn't know exactly when the outburst would begin. Fortunately, AAVSO members came to the rescue, in two ways:
This information triggered the X-ray and UV satellites to start their pre-planned sequences at 7:15 UT, less than 4 hours after the first visual evidence.
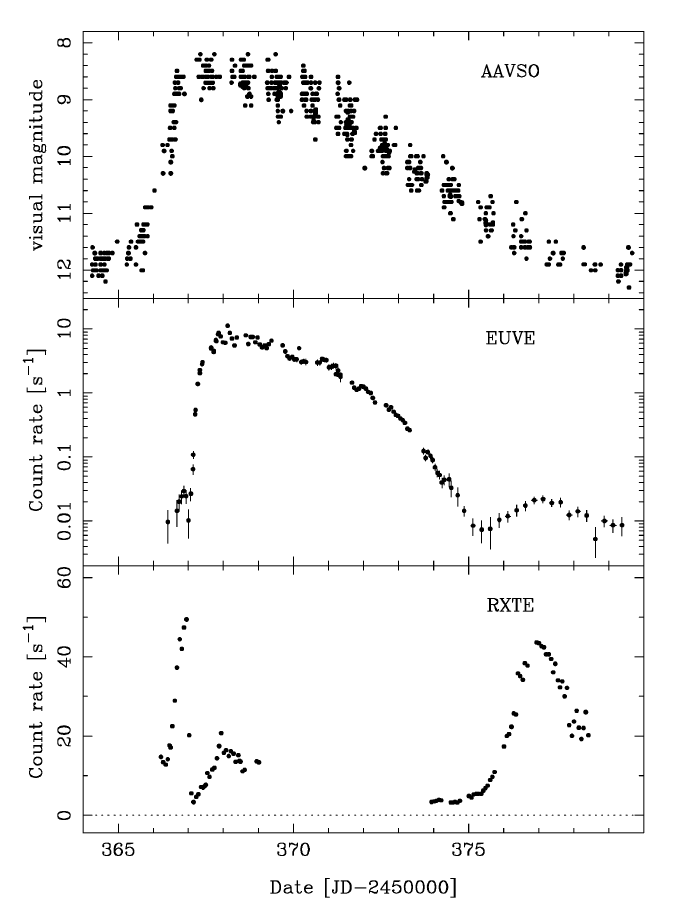
Figure 2 from
The X-ray and extreme-ultraviolet flux evolution of SS Cygni throughout outburst
MNRAS 345, 49 (2003)
Remember what I said earlier about the eye as a photometric instrument?
Fortunately, the eye is very good at relative measurements
Let's find out how this works, in a hands-on (eyes-on?) exercise. We'll follow the method given by the AAVSO
and try to make a light curve of the variable star RR Aqr over a three-year period. The images we'll use were acquired by the Stardial Project at the University of Illinois around 15 years ago.
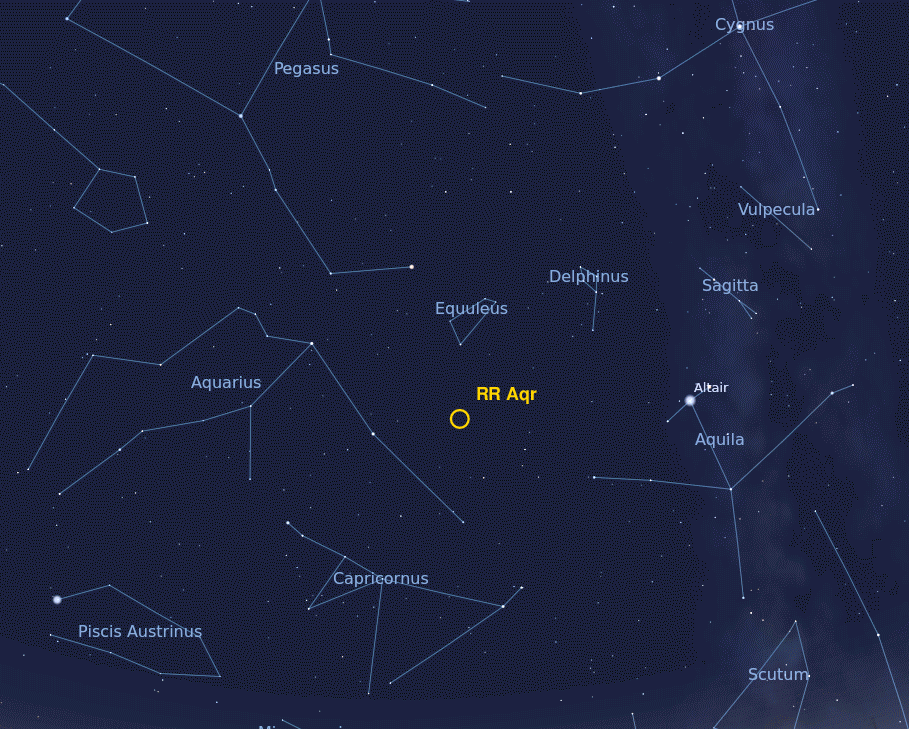
The Stardial camera had a wide field of view, so each image you'll examine includes lots and lots of stars. Focus on the region shown by the gold box below:
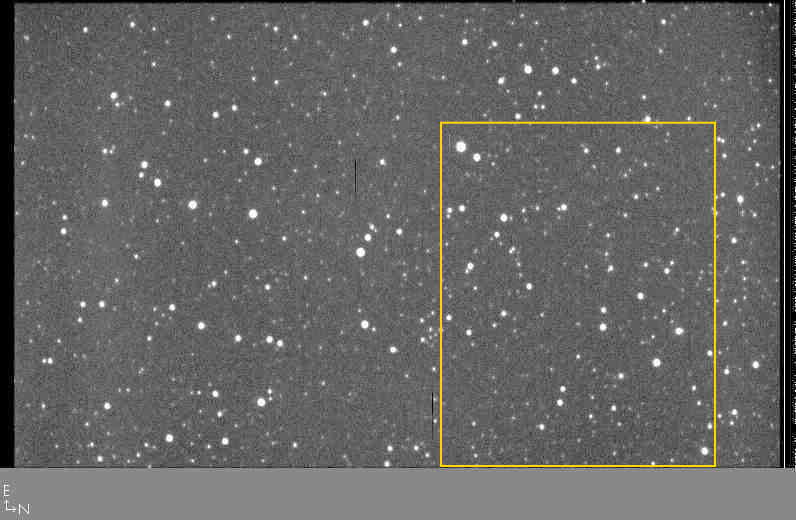
Inside this region are a number of stars which can be used as references: their magnitudes have been well measured.
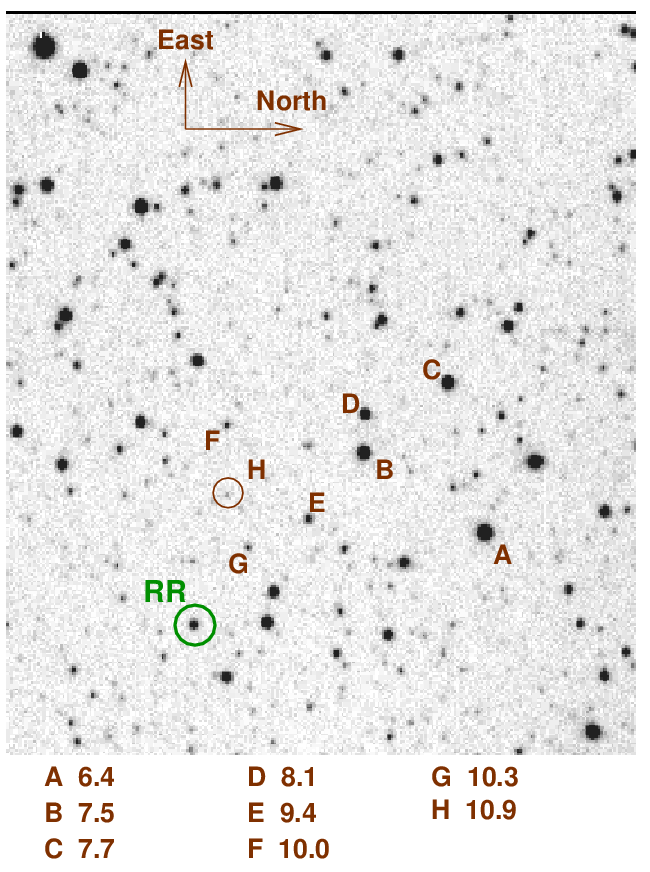
Your job is to examine a set of images and estimate the magnitude of RR Aqr in each one. Can you do it? The images are here:
You can write down your results in a table which lists the Julian Date for each image.
After every group has finished their measurements, we'll combine them into a single big table and make a light curve.
Click for amusing graphic during intermission
So, one way that amateur astronomers can make valuable contributions is by choosing a variable star or two, growing familiar with the neighboring stars, and using them to make regular measurements of the variable star.
Oh, and submitting your measurements to the AAVSO, of course. See Chapter Seven in the AAVSO Visual Observing Manual for details on reporting your results.
But that's not the only way that you can provide a valuable service to the astronomical community. Another task which always needs more effort is checking to see if certain variable stars are in outburst.
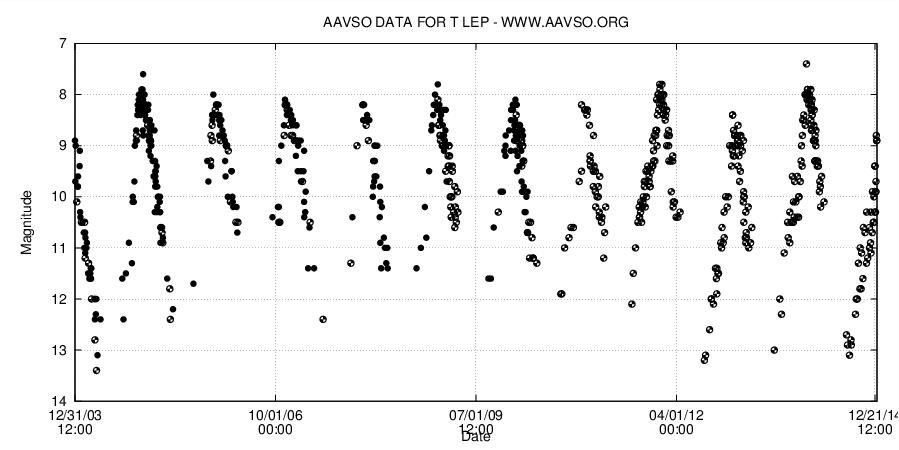
As you know, stars vary in brightness for many reasons. Some pulse in size, like Mira or T Leporis. These stars have very large envelopes
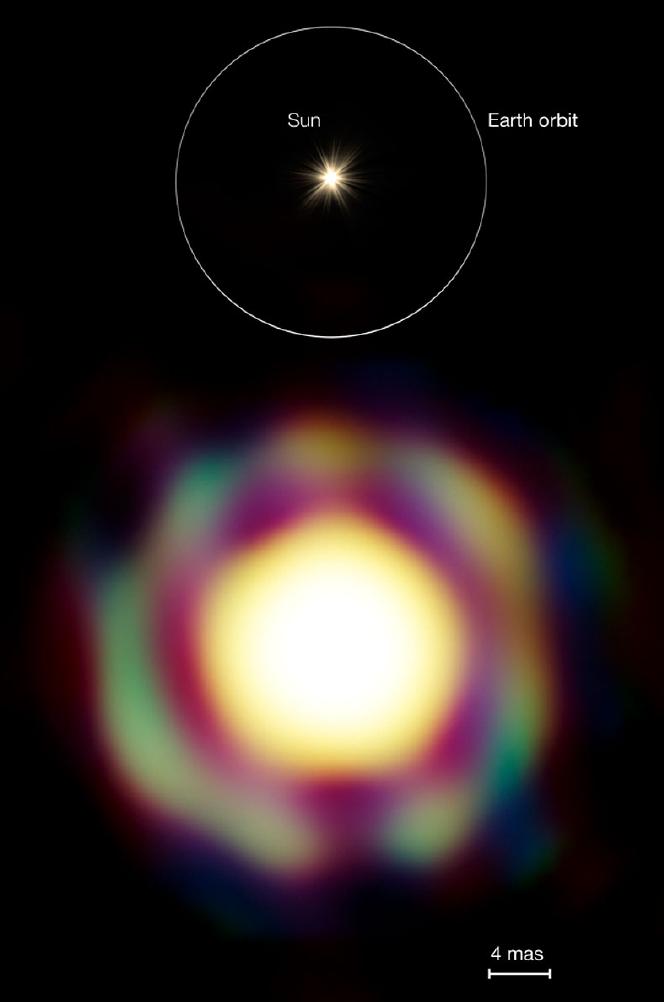
Image courtesy of
ESO/J.-B. Le Bouquin et al.
which will pulse in and out, in and out, with a very regular pattern.
Other stars, such as Algol, are members of a binary system.
Two ordinary stars circle their common center of mass, blocking each other's light in turn. These variations are also very regular.
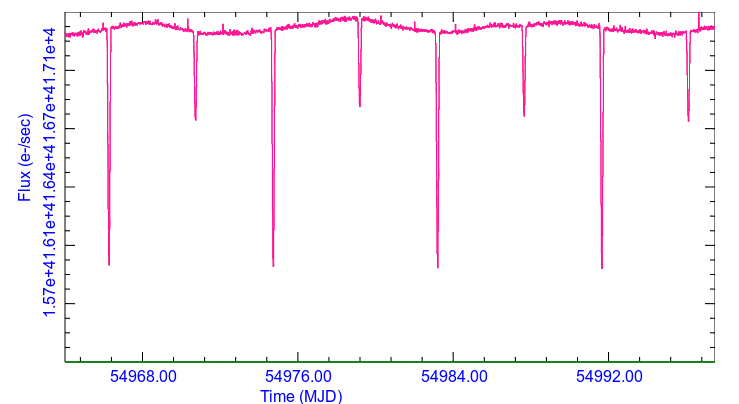
Light curve of KPLR001026032-2009166043257 thanks to
the Kepler Eclipsing Binary Archive
However, there are some binary star systems which are different: cataclysmic variables. These systems involve an ordinary main-sequence star and a compact object, usually a white dwarf. Notice that some material from the outer regions of the ordinary star may be pulled off by the gravitational influence of the compact star; it tends to settle into an accretion disk around the compact object.
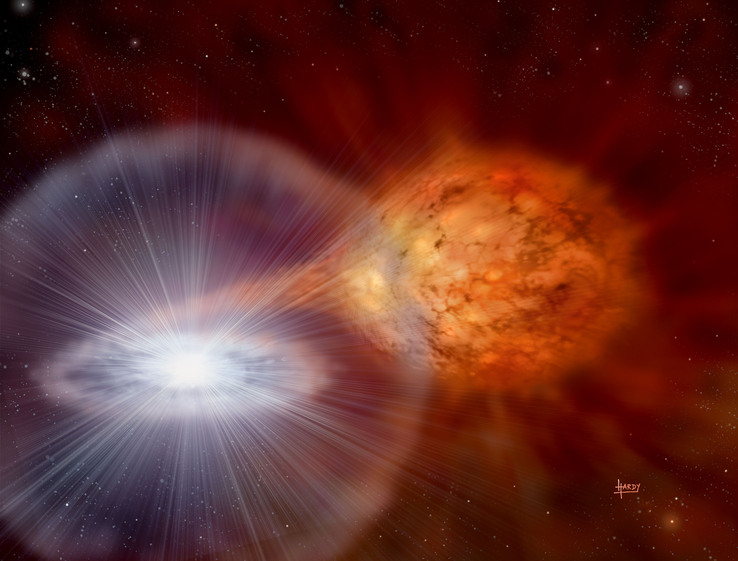
Image courtesy of David Hardy
and PPARC.
Most of the time, the material in the accretion disk circles around and around in a placid manner; as a result, the disk shines with a nearly constant light, and the each star shines with a nearly constant light, so that, overall, the system has a nearly constant light.
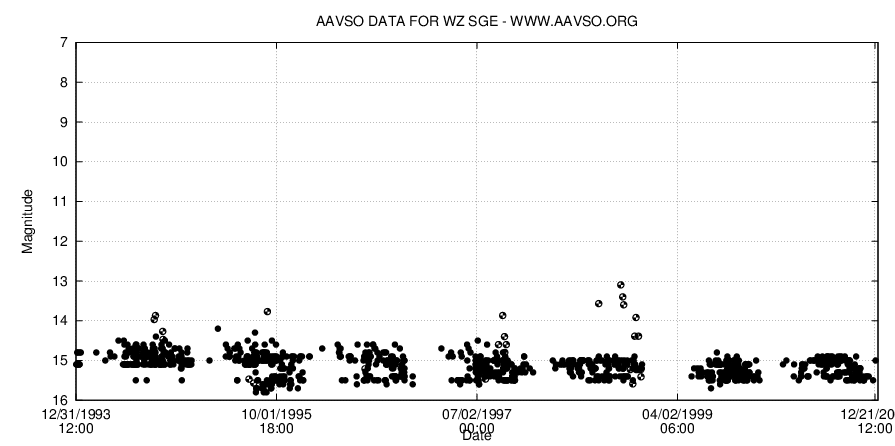
Every now and then, however, for reasons we don't entirely understand, the transfer of material from the ordinary star to the accretion disk increases dramatically. The accretion disk heats up and grows much, much brighter, creating an outburst.
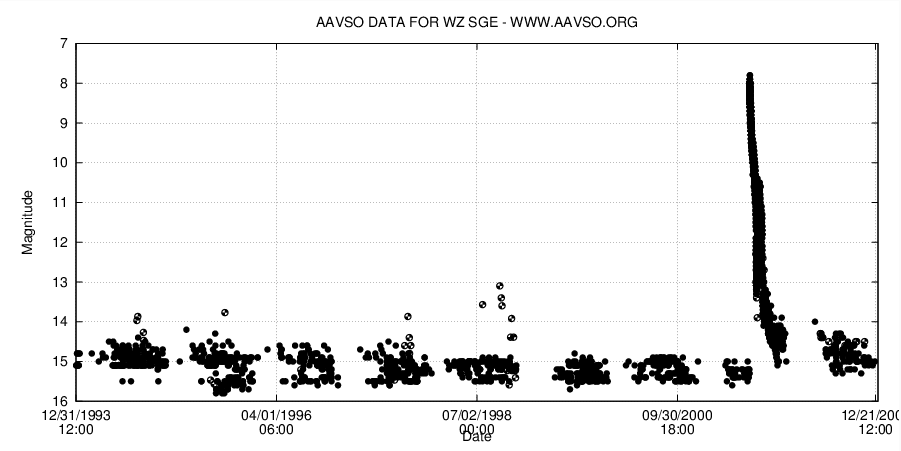
Some people find these outbursts ... exciting.
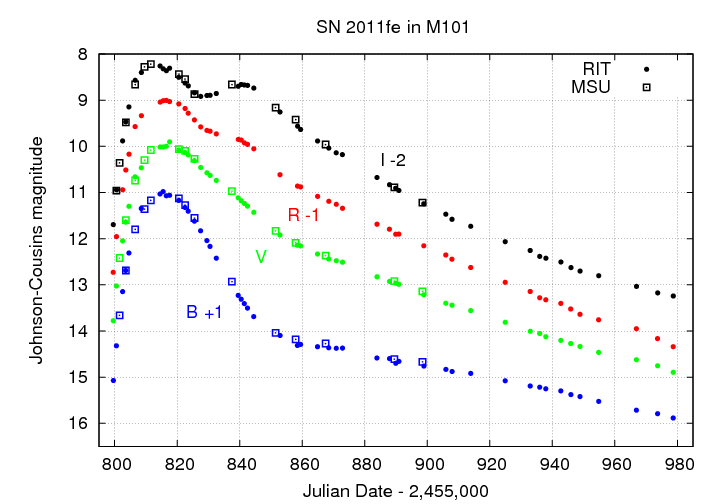
I observed this star many times over the next few weeks at the RIT Observatory. It was so bright that there was no problem at all recording the light curve with high signal-to-noise.

So, the question is -- how do we find out that one of the binary stars has entered its outburst phase?
The answer is ...
someone checks them, night after night
One of these "checkers" is an amateur astronomer named Gary Poyner.
As you can see, he lives in a region with ... a bit of light pollution: close to Birmingham, England.
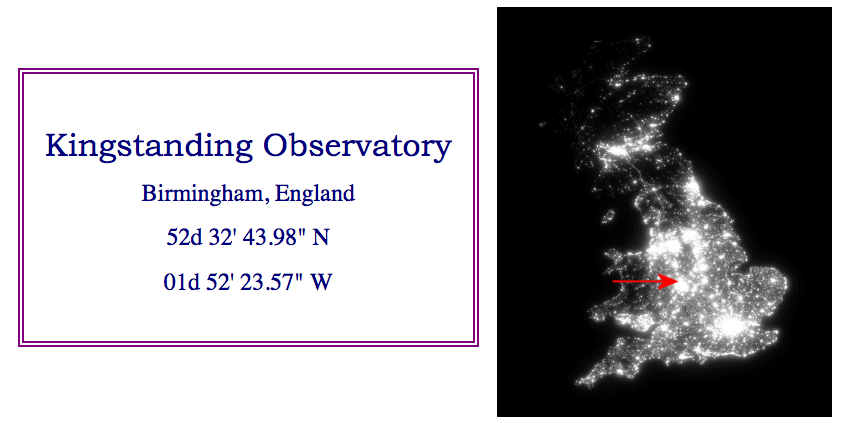
Night-time image of England taken from
Gary's astronomy pages

Gary was for a time the head of the Recurrent Objects Programme within the British Astronomical Association. You can see a list of the objects they check regularly at
The 2001 outburst of WZ Sge was first detected visually by Japanese amateur astronomers Oshima, Itoh, and Maehara.
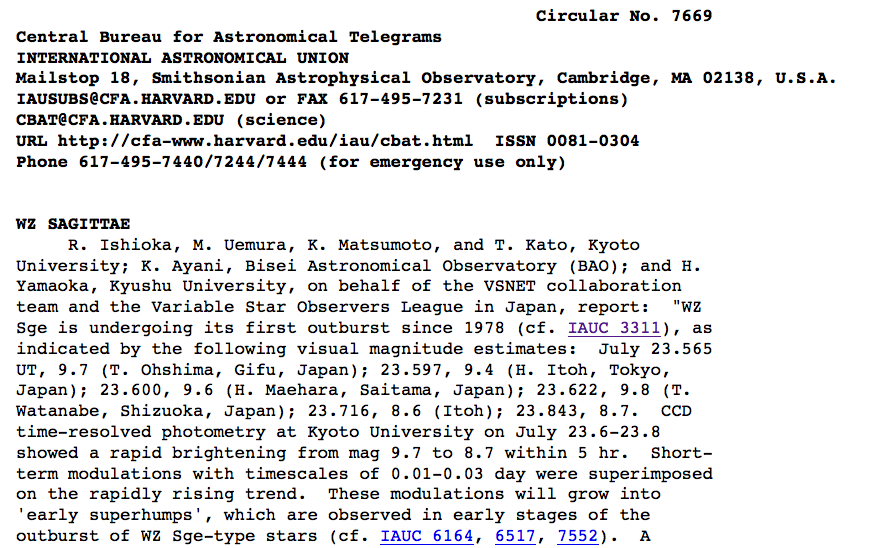
Click on the image to read the
full text of IAUC 7669, 2001 July 24
Look how quickly the news of the outburst spread to other astronomers:
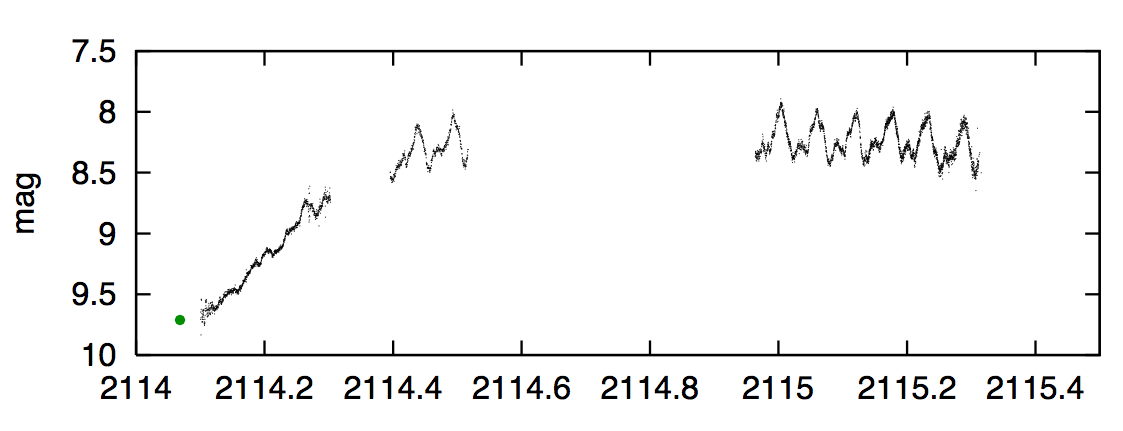
Figure 1 from
Ishioka et al., A&A 381L, 41 (2002)
with a symbol added for Oshima's discovery.
So, if you have a telescope or binoculars, and a good deal of patience, perhaps you, too, can participate in this endeavour: checking the fields of known cataclysmic variable stars, night after night, to see if any of them have suddenly grown bright.
Please consider loading some images onto your laptop during this time ....
Why use a camera, instead of the good ol' eyeball?
Advantages over visual measurements:

For example, look at the stars in this picture. The star at lower-right is clearly the brightest, right? But is it twice as bright as the star to its left? Three times as bright? Four times as bright?
Drawbacks of using a camera:
It really is possible to take astronomical images from a location in a city. For example, consider these pictures taken at the Astrophysical Observatory of the City University of New York, College of Staten Island:
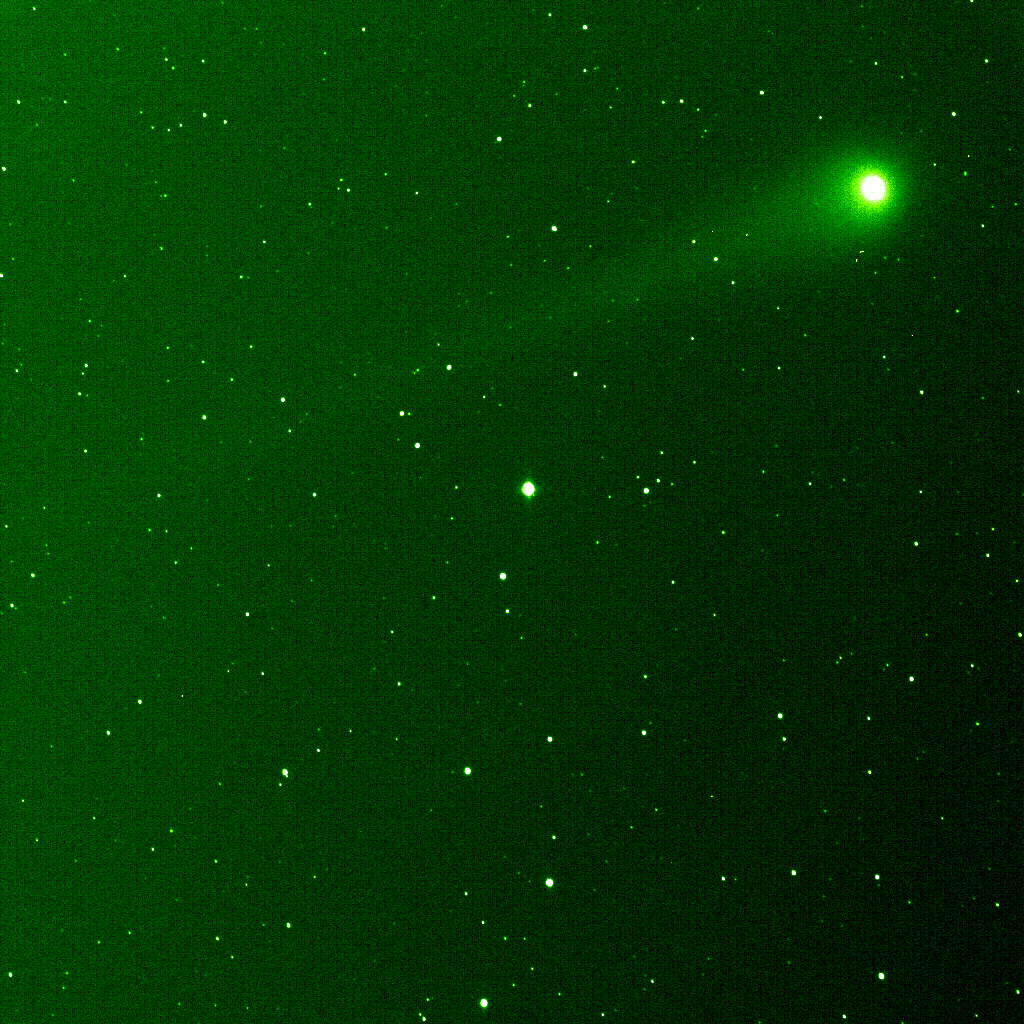
Image of Comet Lulin courtesy of
Observatory of CUNY Staten Island
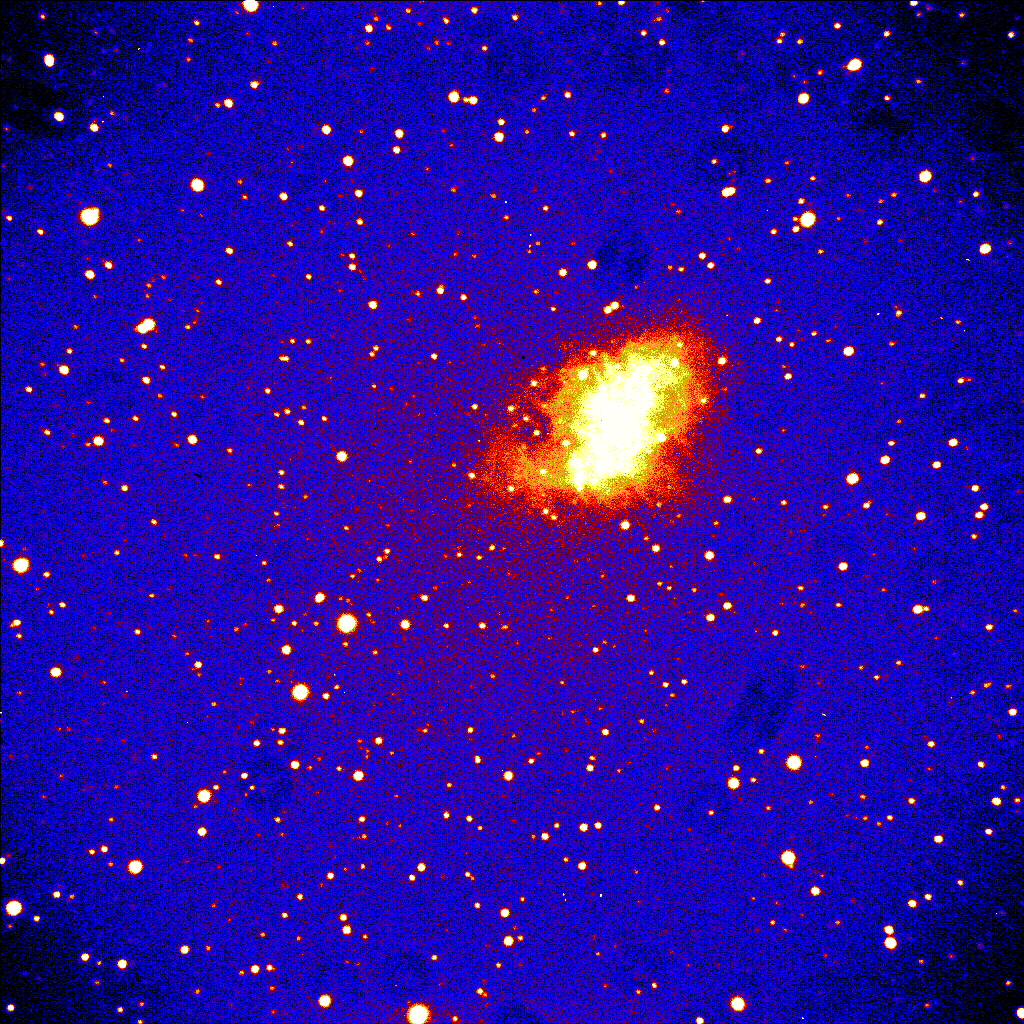
Image of Crab Nebula courtesy of
Observatory of CUNY Staten Island
My own home city of Rochester, New York, isn't nearly as big as New York City; but with a population of 210,000 in the city proper, and about one million in the greater metropolitan area, it still makes the night sky pretty darn bright.

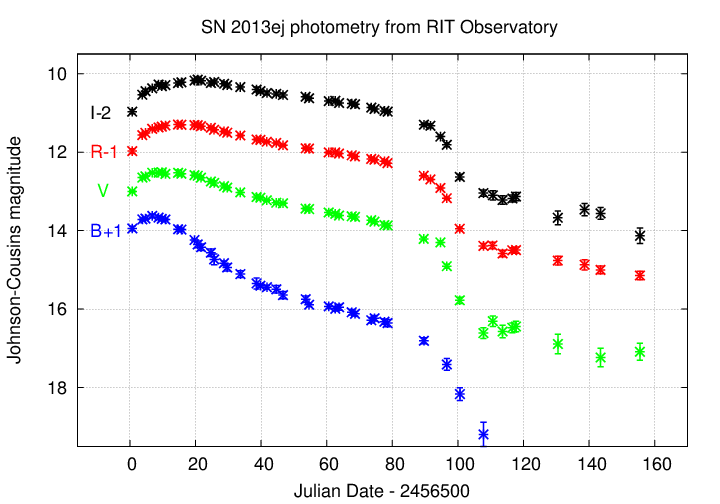
The RIT Observatory is just 6 miles from downtown Rochester, and I have trouble seeing all the stars in the Little Dipper. Nonetheless, with some patience and care, one can still make light curves good enough to contribute to the astronomical community:
Let's see what one can learn from digital images of a variable star. I happen to have a set of images of the star IY UMa , one example of the cataclysmic variable stars I mentioned earlier.
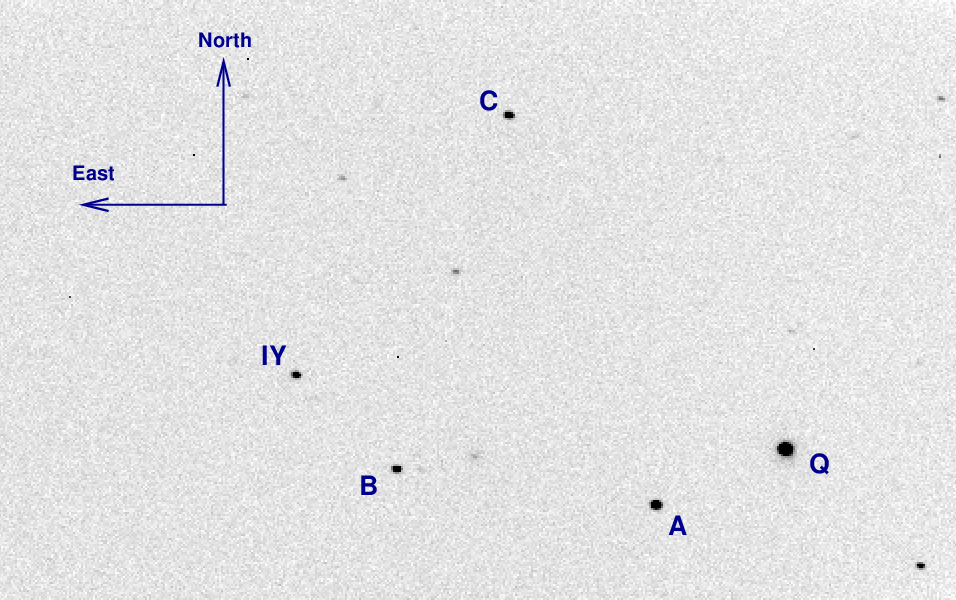
What I'd like you to do is to select a small set of images -- perhaps 5 per person or per group -- from the list of FITS images of IY UMa I took at the RIT Observatory way back on Apr 11, 2006.
For each image, could you please
     image        A       B         IY
     1          12.592   13.670   13.079
     2          12.612   13.642   13.091
If you are interested in using a camera to measure variable stars, you might find these guidelines useful:
Copyright © Michael Richmond.
This work is licensed under a Creative Commons License.