 Copyright © Michael Richmond.
This work is licensed under a Creative Commons License.
Copyright © Michael Richmond.
This work is licensed under a Creative Commons License.
Contents
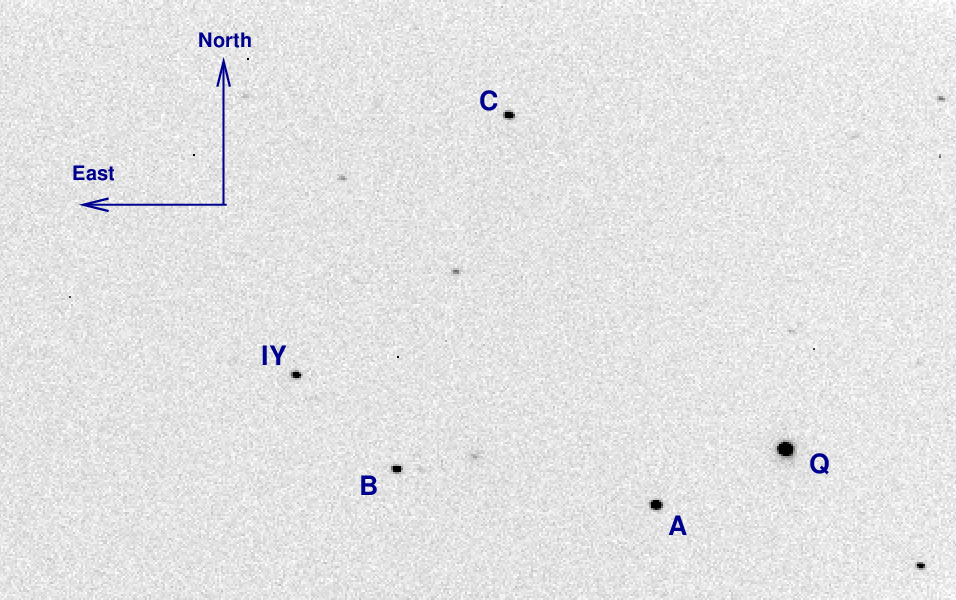
Last time, I left you with a homework problem: use aperture photometry to make measurements of three objects in the field of the variable star IY UMa , which is at RA = 10:43:56.73, Dec = +58:07:31.9 (J2000).
You can download FITS images of this field from one of my courses, if necessary:
Your job was to use aperture photometry to measure the instrumental magnitudes of the stars "A", "B", and "IY", with an aperture of radius 5 pixels. When done, you were to make a table that looks something like this:
image        A       B         IY
1          12.592   13.670   13.079
2          12.612   13.642   13.091
Now, there were many images, which would take any one person a very long time to measure. So, we split the images into groups of five, and each person measured just one group (well, a few people measured extra images, just for fun).
Let's look at the results. I'll place them onto a graph which shows instrumental magnitude versus time, like the one below. Note that I've reversed the graph, so that bright objects will be at the top .
![]()
Okay, let's begin. Here are the measurements of the star IY UMa.
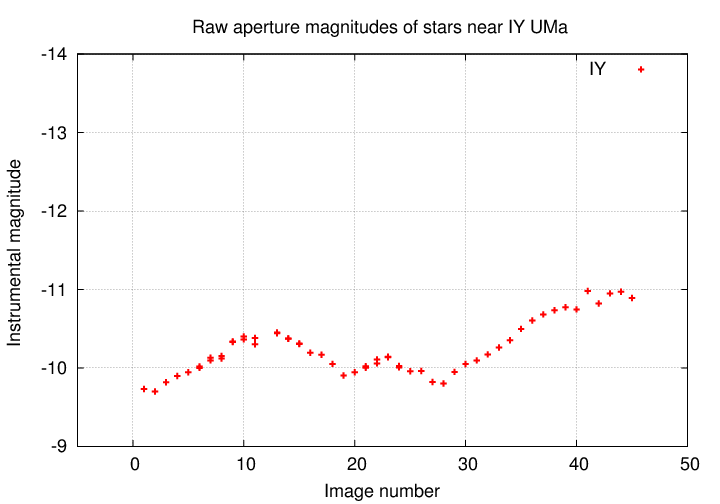
Q: Is the star IY UMa changing in luminosity?
Golly, it surely looks as if the star is growing brighter, then fainter, then brighter, throughout the observing period. Based on this information, we might conclude that IY UMa really does produce a varying amount of power over the course of several hours.
But, just to make sure, let's look at a second object in the same images.
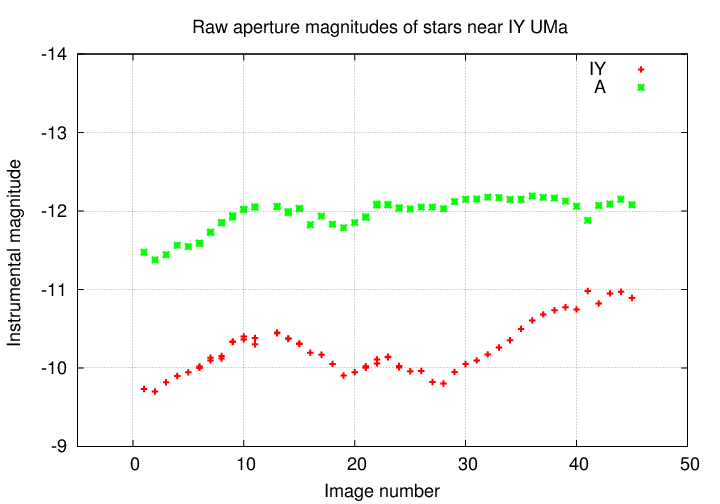
    Q:  Is the star IY UMa changing in luminosity?

    Q:  Is the star A      changing in luminosity?
Hmmmmmmmm. It looks as if both stars are changing in brightness, in almost, but not quite, the same manner. Does that make sense? These two stars aren't really close together in space; why should they be varying in sync?
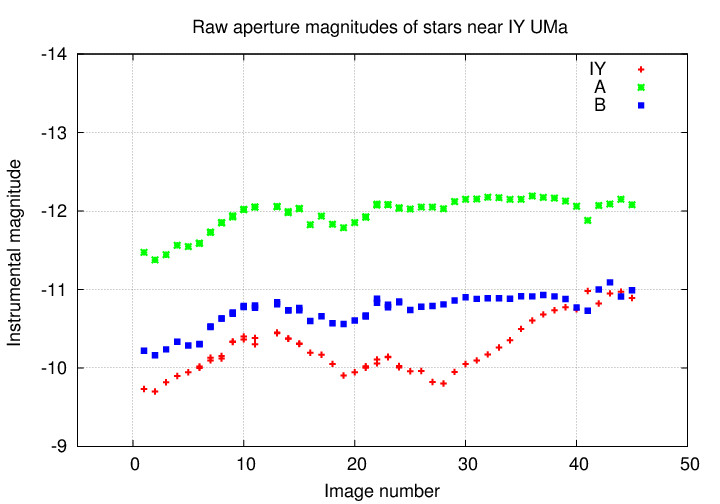
Well, let's look at the third star we measured, the one called "B".
    Q:  Is the star IY UMa changing in luminosity?

    Q:  Is the star A      changing in luminosity?

    Q:  Is the star B      changing in luminosity?
Huh? All three stars just happen to be producing more and then less and then more power, all at the same time? This just doesn't make sense.
Q: What is going on here?
Why should three stars in the same region of the sky all grow brighter and fainter at the same time? While it's possible that they might all have the exact same sort of instability within their atmospheres, affecting them identically, it's much more likely that the culprit is the Earth's atmosphere.
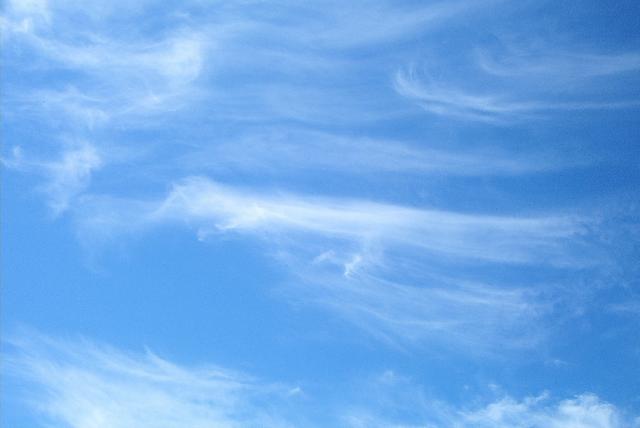
Image courtesy of
Lin Chambers and NASA
If clouds happen to move in front of the tiny patch of sky we are observing, then ALL the stars in that patch will grow dimmer simultaneously; if those clouds then move away, then ALL the stars will grow bright again, simultaneously. To a good approximation, changes in transparency will cause all stars in an image to vary in apparent brightness, in sync with each other.
Well, if we want to measure the REAL variations in one particular star -- variations caused by a real change in the amount of light produced by the star -- those real variations are going to be all mixed up with "fake" variations caused by the atmosphere.
  Q:  Is there any way to isolate the REAL variations
      in one star from these "fake" changes?
Yes! There is a relatively simple procedure which will remove (most of) the changes due to the Earth's atmosphere. All we need to do is to compute the differential magnitudes of stars relative to some reference object. Suppose, for example, that we choose our reference object to be star A. Then we just subtract the instrumental magnitude of star A from the instrumental magnitude of every object:
    diff mag of star A  =  (mag of A)   -  (mag of A)

    diff mag of star B  =  (mag of B)   -  (mag of A)

    diff mag of star IY =  (mag of IY)  -  (mag of A)
Let's look at the results. How much does star A change, relative to star A?
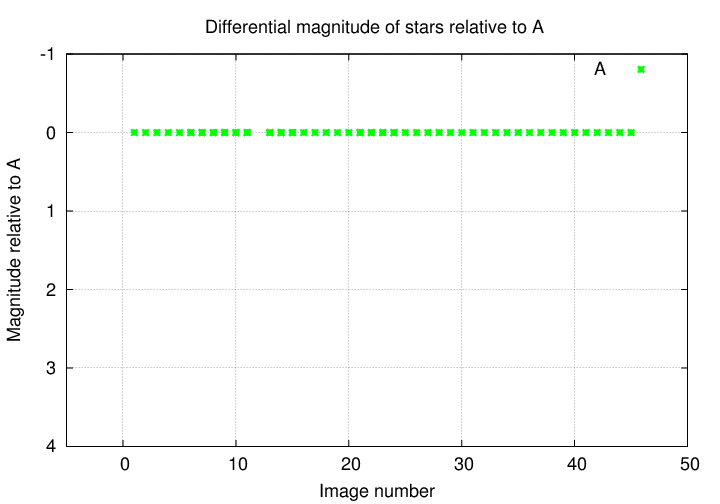
Not at all. Good!
Okay, something more interesting. How about star B, relative to star A?
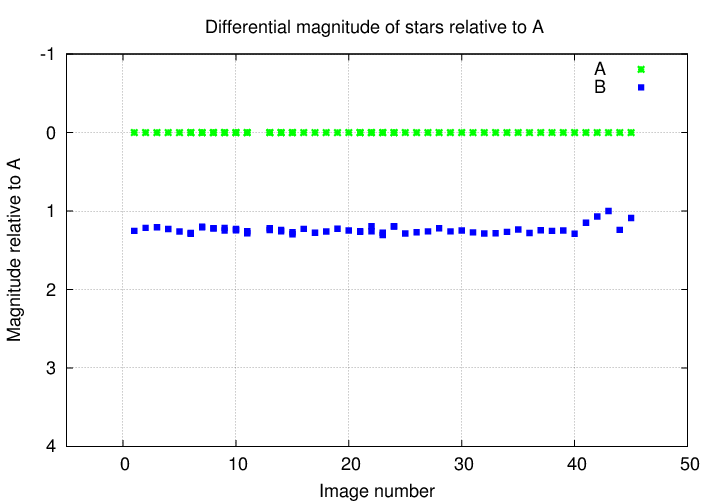
Well, star B seems to be roughly the same brightness relative to star A, with little variations from image to image. There is a bit of a rise near the end, but nothing really convincing.
But if we add IY UMa to the mix ....
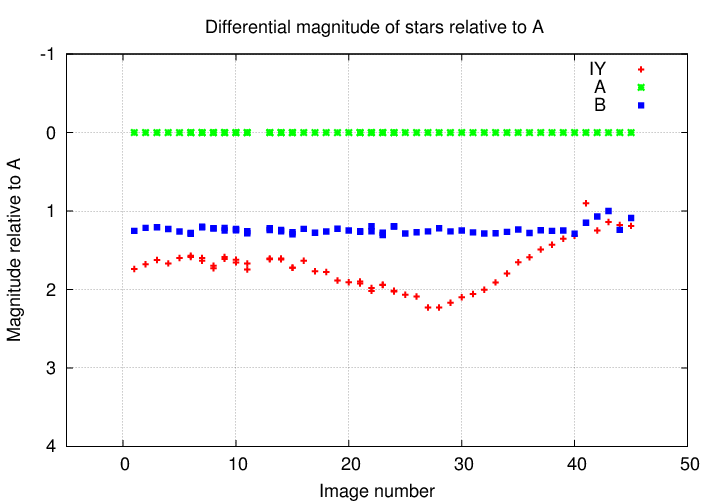
A-HA! Now, this is some strong evidence that the star IY UMa really is producing more light, then less light, then more light again.
There are several nice features about differential photometry:
Take a look at this closeup of star B, relative to star A.

Q: What is the typical uncertainty in these measurements?
In our data, for example, I looked up the magnitude of the star we've called "A". It has many other names, among them UCAC4 741-049891. The UCAC4 catalog says that its V-band magnitude is V = 12.20
            Q:  What is the magnitude of star B?

            Q:  What is the faintest magnitude of IY UMa?
Now, there is one big possible problem with differential photometry: what if you happen to pick a reference star which is actually an intrinsic variable itself? If you do, then EVERY OTHER STAR in the field will appear to be varying .... because you will be subtracting a variable magnitude from each other star's measurements.
Is there some way to avoid this problem? Well, if you have previous knowledge of stars in the field, then you can pick a reference star which is known (from previous work) to be non-variable. But what if you don't have any previous knowledge?
You might try the empirical route:
Calvin and Hobbes was written by the
terrific Bill Watterson and syndicated by Universal Press.
Just pick a star, compute all the differential magnitudes, and then examine the light curves of other stars. If all the other stars appear to vary in sync with each other, then -- whoops! -- you picked a bad reference star.
But there is a different approach which, while requiring more work, will help you to avoid picking a bad reference star. The basic idea is not to choose just ONE reference star, but instead to use a set of MANY stars together to form a reference. Astronomers have a fancy word for "a set of MANY stars used together as a reference:" they call it an ensemble.
The idea is to use the stars together to make a more robust reference source. You might compute the average magnitude of all the stars together
(well, actually, that wouldn't make much sense; the average flux would be a better choice ... but let's avoid that whole can of worms for now)
and then subtract that value from the magnitude of each star.
Suppose that you have N = 20 stars in your ensemble. If one of them does happen to be a variable star, unknown to you, then its effect on the reference will be diluted by the combined signal of the 19 other constant stars. In fact, you might even be able to use the ensemble average to check and verify that each of the stars you've included isn't varying.
I use this sort of approach a LOT in my work. Long ago, as a grad student, I stumbled across a paper which described this technique:
I found the technique so useful that I wrote a set of computer programs to run them, which you may download freely, compile, and run, if you wish.
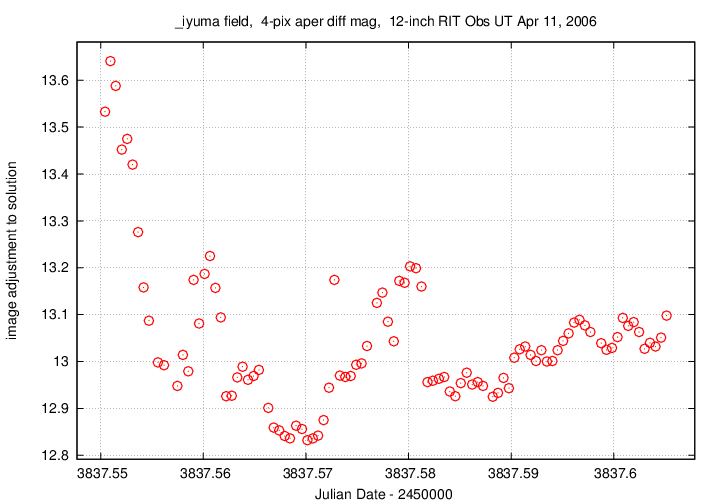
When I run these programs on the entire set of 99 images of IY UMa and its friends, I get several very handy bits of information.
One is the amount by which all the stars in the images appeared to grow dimmer and brighter in unison, due to clouds or changes in the atmosphere. Take a look: clouds at the start of the night gradually thinned out, but it never was perfectly clear -- you can still see little "bumps" due to clouds.
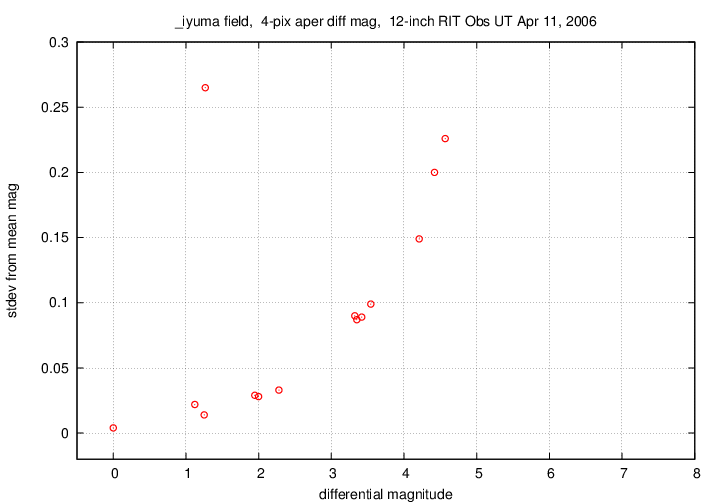
Another useful result of the ensemble photometry analysis is an estimate of the size of the random scatter in each star, after we have removed the atmosphere's effect. If we plot this scatter versus the average magnitude each star, we get a graph you'll see in many discussions of photometry: the "sigma-vs-mag" graph:
Finally, the procedure also creates a light curve of each star in the field.
![]()
You can read more about my measurements of IY UMa on this night if you wish:
http://spiff.rit.edu/classes/phys445/work/apr11_2006/You should find 99 images, each a simple 16-bit integer FITS image, 510-by-340 pixels in size.
Copyright © Michael Richmond.
This work is licensed under a Creative Commons License.