
Just want the data? Here it is:
If you'd like to know more about the provenance of the meausurements, keep reading ...
This web page provides the latest results of our photometry of SN 2013ej in the optical BVRI passbands from the RIT Observatory in upstate New York. You can find reports on individual nights at the list of observing sessions at RIT Observatory.
The setup for all our work (unless mentioned otherwise) is pretty simple:
The regular practice is to take 5-15 exposures in each band. Some of these exposures show trailing, but a good fraction yield round, or at least round-ish, stars. The seeing is not good, and I don't spend a great deal of time focusing, so the FWHM is typically 2-3 pixels. I bin the images 3x3 within the camera to speed up readout time, and each pixel subtends 1.85 arcsec, so the FWHM is about 4-6 arcseconds. Fortunately, the field isn't crowded.
Below is a set of images taken in (left to right, top to bottom) B, V, R, I. This set comes from UT 2013 Aug 2, and has not been selected in any special manner (not the best images, not the worst). In all cases, North is up and East to the left. The SN is the bright point source to the lower-left of the galaxy, at about the 7 o'clock position.
|
|
|
|
|
|
At late times, I combined 10-30 images of the field using a median technique in order to improve the signal-to-noise ratio. Below is an example of one of these co-added images, in V-band.
This is a chart of the field of SN 2013ej. The field of view is about 10 by 8 arcminutes.
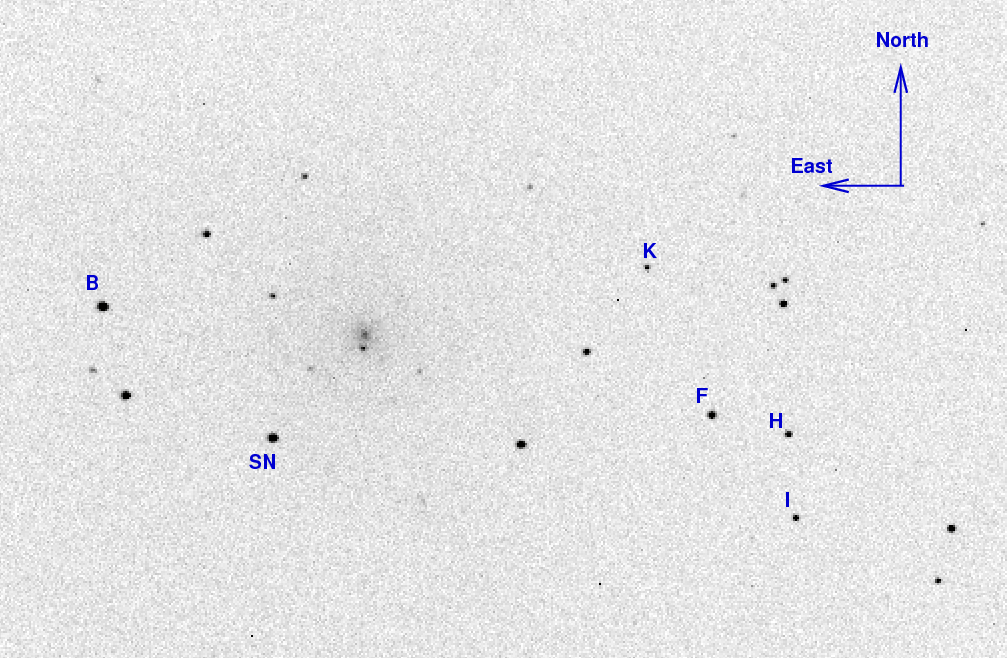
The reference stars marked above have magnitudes in AAVSO chart 12459CA, as follows:
 letter      B     sigB       V     sigV      R      sigR     I    sigI
  B        13.012  0.019   12.510  0.019    12.154  0.019   11.834  0.019
  F        13.848  0.026   13.065  0.022    12.622  0.025   12.152  0.027
  H        14.338  0.029   13.692  0.024    13.329  0.029   12.964  0.030
  I        14.832  0.027   13.912  0.023    13.416  0.026   12.939  0.030
  K        15.192  0.034   14.613  0.027    14.275  0.034   13.915  0.036
I measure the instrumental magnitude of each star with aperture photometry, using a radius of 4 pixels (7.4 arcsec), and sky defined by an annulus around each star. Following the procedures outlined by Kent Honeycutt's article on inhomogeneous ensemble photometry, I use all stars available in each image to define a reference frame, and measure each star against this frame.
Starting on UT 2013 Sep 11, I combine all the individual images taken in each passband via a median technique to create a single image with higher signal-to-noise ratio. I then extract instrumental magnitudes from this image. See notes from Sep 11, 2013 for additional details.
Using several nights of observations of Landolt fields PG 1633+009 and PG2213-006,
B  =  b  +  (  0.231 +/- 0.012 ) * (b - v)   +  zero_point

V  =  v  +  ( -0.079 +/- 0.017 ) * (v - r)   +  zero_point

R  =  r  +  ( -0.087 +/- 0.021 ) * (r - i)   +  zero_point

I  =  i  +  ( -0.018 +/- 0.040 ) * (r - i)   +  zero_point
So, after running the ensemble photometry routines on each night's data, I use equations of the form shown above and BVRI magnitudes of stars B, F, H, I and K from the AAVSO sequence to compute the magnitude of the SN. Fitting the model (equations above) to the data (four stars with calibrated magnitudes) yields a result with some scatter; call this S1.
At later times, as the signal from the SN fades, we can identify a third significant source of error: the uncertainty in the instrumental magnitude of the SN itself. If we call this S2, then we can now compute the overall uncertainty as
uncert = sqrt ( S1*S1 + S2*S2 )
On good nights at early times, the uncertainty in the photometric sequence dominates; on cloudy nights, or at late times, after the SN has faded, the uncertainty in the instrumental magnitude of the target can be larger.
You can find a complete set of the RIT Obs measurements by grabbing the file sn2013ej_mags.out.
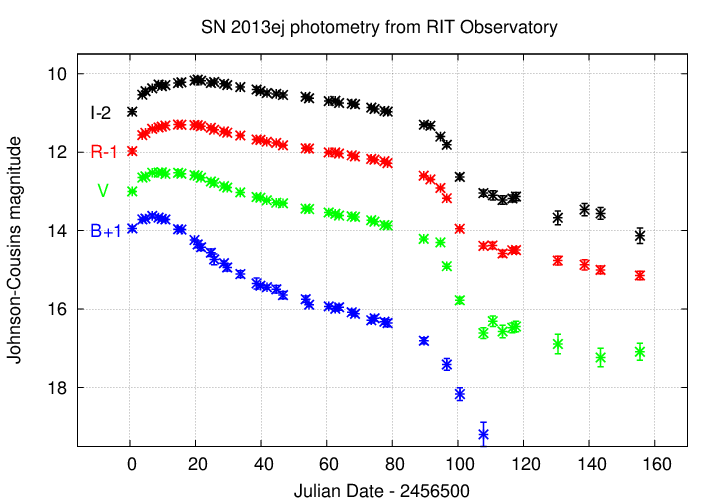
A graph of the light curve is shown below.
Last modified 02/15/2015 by MWR.