Update! We have written a technical article describing our work together with Horace Smith and his observations at Michigan State. The paper has been submitted to the Journal of the American Association of Variable Star Observers. See a preprint at arXiv 1203.4013 .
On August 24, 2011, The Astronomer's Telegram number 3581 announced that the Palomar Transient Factory had found a young supernova in the nearby galaxy M101. Since this promised to be the closest Type Ia supernova since 1972, astronomers around the world turned their telescopes to the event. We joined them here at the RIT Observatory.
This web page provides the latest results of our photometry of SN 2011fe in the optical BVRI passbands. You can find reports on individual nights at the list of observing sessions at RIT Observatory.
The setup for all our work (unless mentioned otherwise) is pretty simple:
The regular practice is to take 15 exposures in the B-band, and 10 exposures in VRI (increased to 15 each in BVR and 25 each in I as of Feb, 2012). Some of these exposures show trailing, but 5-8 yield round, or at least round-ish, stars. The seeing is not good, and I don't spend a great deal of time focusing, so the FWHM is typically 2-3 pixels. I bin the images 3x3 within the camera to speed up readout time, and each pixel subtends 1.85 arcsec, so the FWHM is about 4-6 arcseconds. Fortunately, the field isn't crowded.
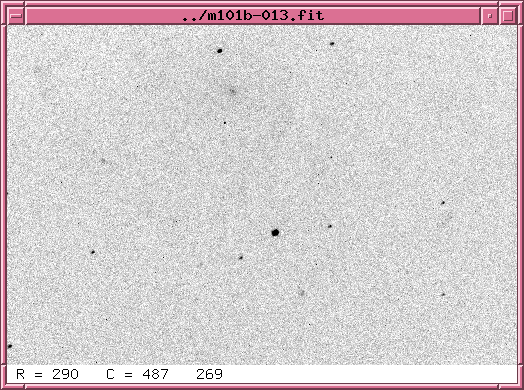
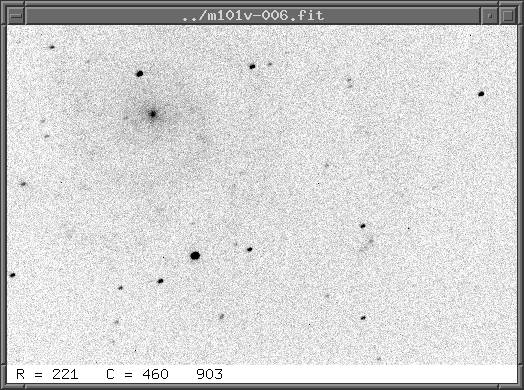
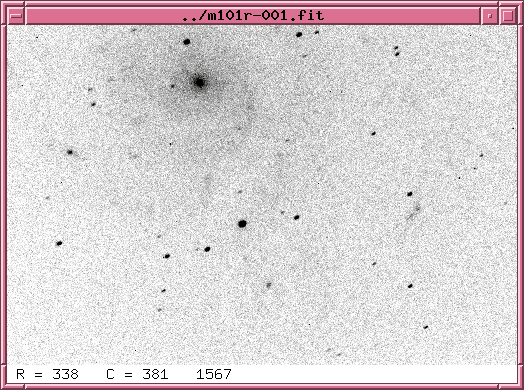
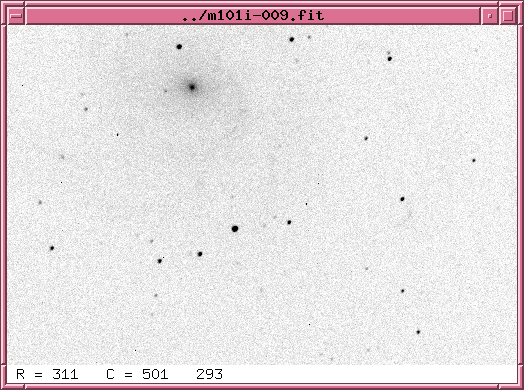
Below is a set of images taken in (left to right, top to bottom) B, V, R, I. This set comes from UT 2011 Sep 25, and has not been selected in any special manner (not the best images, not the worst). In all cases, North is up and East to the left. The SN is the brightest object in all images.
|
|
|
|
|
|
This is a chart of the field of SN 2011fe, based on a stack of five R-band images. The field of view is about 10 by 8 arcminutes.
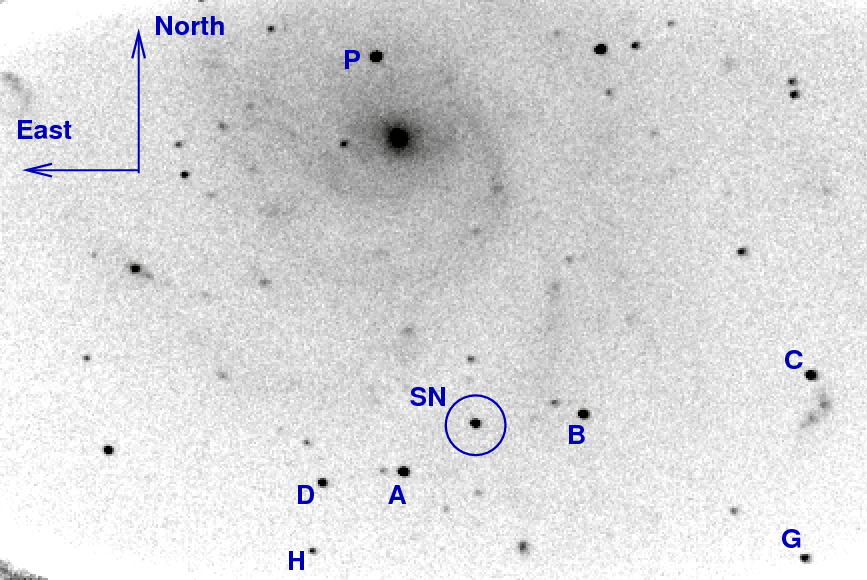
Some of the marked objects appear in a list of comparison stars with magnitudes in BVRI, created by the AAVSO. You can find the original at the AAVSO web site; go to the Variable Star Plotter (VSP) area. I've made a simplified ASCII version of the catalog below, or you can look at the AAVSO's original version in a local copy.
#AUID   RA.   Dec.   Label   U   B   V   Rc   Ic   J   H   K   Comments
# Label            RA         Ra(deg)       Dec        Dec(deg)  ID       U    B                 V                  R                 I
000-BKD-527   14:03:49.86 [210.95775d]   54:09:05.8 [54.15161d]   117 x   -   12.268 (0.057)29  11.735 (0.040)29  11.359 (0.048)29  11.006 (0.054)29  -   -   -
000-BKD-528   14:04:21.68 [211.09033d]   54:19:22.4 [54.32289d]   119 x   -   12.572 (0.068)29  11.948 (0.047)29  11.528 (0.056)29  11.134 (0.063)29  -   -   -
000-BKD-529   14:02:00.79 [210.50330d]   54:23:15.8 [54.38772d]   128 x   -   13.553 (0.062)29  12.751 (0.031)29  12.253 (0.045)29  11.788 (0.056)29  -   -   -
000-BKD-530   14:01:55.32 [210.48050d]   54:16:21   [54.27250d]   131 x   -   13.540 (0.064)29  13.094 (0.044)29  12.716 (0.051)29  12.361 (0.056)29  -   -   -
000-BKD-531   14:02:02.00 [210.50833d]   54:20:43.9 [54.34553d]   133 x   -   14.188 (0.094)29  13.291 (0.057)29  12.772 (0.074)29  12.287 (0.088)29  -   -   -
000-BKD-532   14:01:49.79 [210.45746d]   54:23:02.7 [54.38408d]   134 x   -   14.187 (0.047)29  13.436 (0.033)29  12.970 (0.049)29  12.534 (0.061)29  -   -   -
000-BKD-533   14:03:13.67 [210.80696d]   54:15:43.4 [54.26205d]   138 A  -   14.699 (0.091)29  13.801 (0.046)29  13.230 (0.062)29  12.698 (0.074)29  -   -   -
000-BKD-534   14:02:54.17 [210.72571d]   54:16:29.5 [54.27486d]   140 B   -   14.557 (0.107)29  13.991 (0.074)29  13.581 (0.078)29  13.197 (0.083)29  -   -   -
000-BKD-535   14:02:29.54 [210.62308d]   54:16:55.2 [54.28200d]   141 C   -   14.959 (0.102)29  14.100 (0.045)29  13.598 (0.063)29  13.130 (0.077)29  -   -   -
000-BKD-536   14:02:31.15 [210.62979d]   54:14:03.9 [54.23442d]   146 G   -   15.158 (0.078)29  14.605 (0.029)29  14.204 (0.061)29  13.828 (0.082)29  -   -   -
000-BKD-540   14:01:50.86 [210.46191d]   54:16:08.1 [54.26892d]   149 x   -   15.373 (0.010)29  14.925 (0.000)29  14.635 (0.006)29  14.361 (0.008)29  -   -   -
000-BKD-538   14:03:23.74 [210.84892d]   54:14:32.6 [54.24239d]   155 H   -   16.015 (0.042)29  15.475 (0.000)29  15.133 (0.046)29  14.811 (0.065)29  -   -   -
000-BKD-539   14:03:05.64 [210.77350d]   54:17:26.2 [54.29061d]   162 x   -   16.776 (0.091)29  16.177 (0.000)29  15.640 (0.079)29  15.140 (0.112)29  -   -   -
#Report this sequence as: 5249bgj in the chart field of your observation report. This table is for a 0.25000° fov around PTF11KLY, RA: 14:03:05.81 (210.77421) & Decl.: 54:16:25.40 (54.27372).
Over the past few weeks, I've determined that comparing my instrumental measurements to the stars marked A, B, C and G yields the best results.
I measure the instrumental magnitude of each star with aperture photometry, using a radius of 3 or 4 pixels (5.6 or 7.4 arcsec), and sky defined by an annulus around each star. Following the procedures outlined by Kent Honeycutt's article on inhomogeneous ensemble photometry, I use all stars available in each image to define a reference frame, and measure each star against this frame.
Starting on Dec 10, 2011 (JD = 2,455,905), I combine all the individual images taken in each passband via a median technique to create a single image with higher signal-to-noise ratio. I then extract instrumental magnitudes from this image. See notes from Dec 10, 2011 for additional details.
Using observations of the Landolt field PG1633+009, I determined color terms for our equipment, so that we can convert instrumental magnitudes to Johnson-Cousins BVRI. The simple first-order conversions are:
  B  =  b  +  0.238 (043) * (b - v)  +  zp1

  V  =  v  -  0.077 (010) * (v - r)  +  zp2

  R  =  r  -  0.082 (038) * (r - i)  +  zp3

  I  =  i  +  0.014 (013) * (r - i)  +  zp4
So, after running the ensemble photometry routines on each night's data, I use equations of the form shown above and BVRI magnitudes of stars A, B, C and G from the AAVSO sequence to compute the magnitude of the SN. Fitting the model (equations above) to the data (four stars with calibrated magnitudes) yields a result with some scatter; call this S1. The AAVSO sequence itself lists a considerable uncertainty in each star's magnitude; call the typical scatter in stars A, B, C, G S2. I've adopted these values for S2: 0.10, 0.06, 0.06, 0.07 mag in B, V, R, I, respectively. Some of this could be random statistical noise, but some is likely to be systematic. I compute an effective uncertainty for each measurement of the supernova as follows:
uncert = sqrt ( S1*S1 + S2*S2 )
At later times, as the signal from the SN fades, we can identify a third significant source of error: the uncertainty in the instrumental magnitude of the SN itself. If we call this S3, then we can now compute the overall uncertainty as
uncert = sqrt ( S1*S1 + S2*S2 + S3*S3 )
On good nights, the uncertainty in the photometric sequence dominates; on cloudy nights, the uncertainty in our measurements can be larger.
I have been reporting our measurements to the AAVSO via their WebObs tool. You can see the accumulated measurements reported to the AAVSO from observers around the world with their Light Curve Generator.
Update 3/23/2012: Thanks to Arne Henden at the AAVSO, we have been using a slightly improved set of comparison stars. See our preprint for details. The measurements below have been re-calibrated using these new magnitudes for comparison stars.
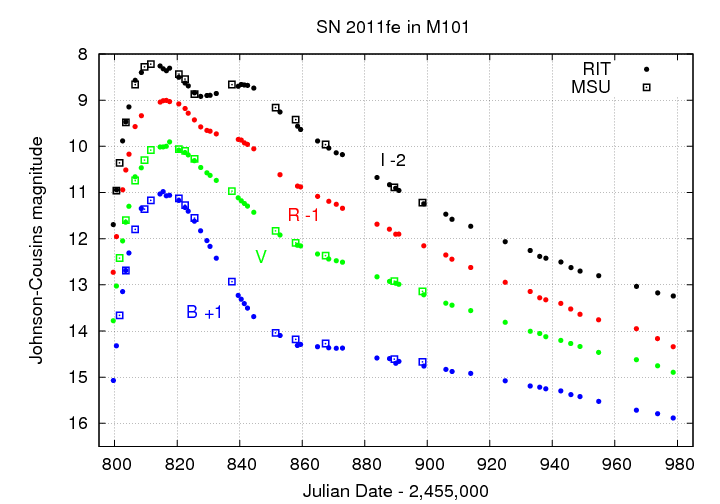
You can find a complete set of the RIT Obs measurements by grabbing the file sn2011fe_ritobs_recalib.out. I've plotted our measurements in two graphs. First, the measurements of SN 2011fe so far (including data provided by Horace Smith at MSU):
Last modified 03/23/2012 by MWR.