 Copyright © Michael Richmond.
This work is licensed under a Creative Commons License.
Copyright © Michael Richmond.
This work is licensed under a Creative Commons License.
Over the course of this semester, you will use a telescope and camera to make repeated measurements of the brightness of some star which varies in brightness. Why? Because the record of a star's changes in brightness over time, its light curve, reveals a great deal about its physical properties. Astronomers can use light curves to determine the size, mass, temperature, and even the distance to a star system.
Today, we'll look at the light curves of two types of variable stars, and discuss exactly what sort of measurements are required to give us all this information. That will help you to plan out your observations of your target.
You already know what a star is. A binary star is simply a pair of stars which orbit around each other due to their mutual gravity.
Now, if we are very lucky, and the following conditions are ALL met,
then we can use geometry and one solid bit of physics -- the spectrum of radiation emitted by a hot gas -- to determine the masses and sizes of the stars, their temperatures, and even the distance to the system.
This is not such a common occurence. In many cases, we CAN'T tell that a tiny little dot of light in the sky is actually the combined light of two stars. Even when we can, in the overwhelming majority of cases, the plane of the orbit is NOT edge on, so we won't see the effects of one star blocking the other's light. Finally, even if we do notice the changes in brightness that reveal eclipses, we may not be able to measure spectra of BOTH stars. If we can only acquire spectra of one of the two stars, then we can't learn quite so much about the stars in the system.
But let's suppose that we happen to stumble across a system which meets all the conditions, allowing us to make light curves and high-quality spectra of both stars.
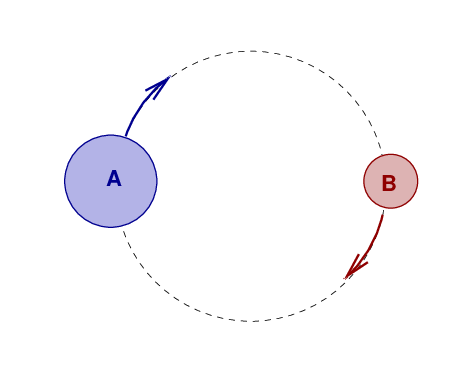
If we measure the light from the system over one full orbital period, then we'll see one dip in the brightness as star B passes in front of A, and then a second dip when A passes in front of B.
Throughout today's class, I'll use as examples the measurements and calculations of this paper:
We'll discuss below
The first and easiest (usually) aspect of a binary system to measure is the period of the orbit. Our example involves measurements of a star with the Kepler space telescope, which made very precise light curves. Take a look at its measurements of KIC 8736245.
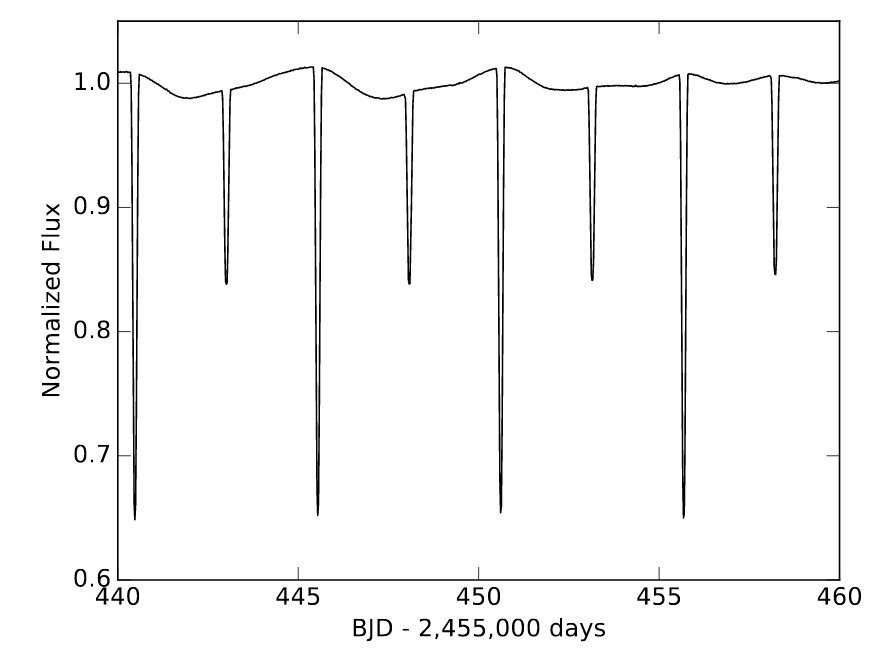
Taken from Figure 1 of
Fetherolf et al., AJ 158, 198 (2019)
  Q:  What is the period of this orbit?  Express your answer in days,
             and in seconds.
Another important parameter is the inclination of the orbit, relative to our line of sight. If the orbit is face-on (in which case we can't see eclipses), the inclination is zero degrees; if the orbit is edge-on (in which case we CAN see eclipses), the inclination is 90 degrees. We'll almost always assume that the orbit is edge-on, which simplifies all the calculations.
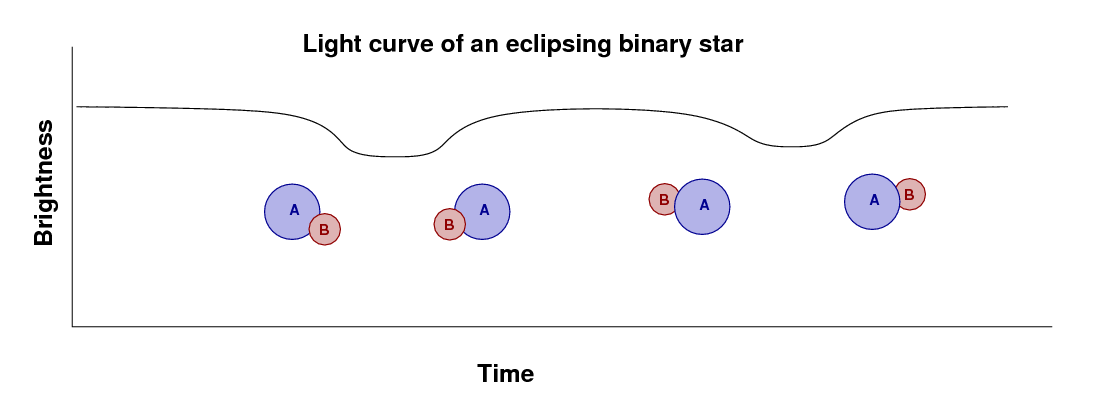
If we zoom in on each of the two eclipses, we see that one is deeper than the other; we call the deeper one the primary eclipse, and the shallower one the secondary eclipse.
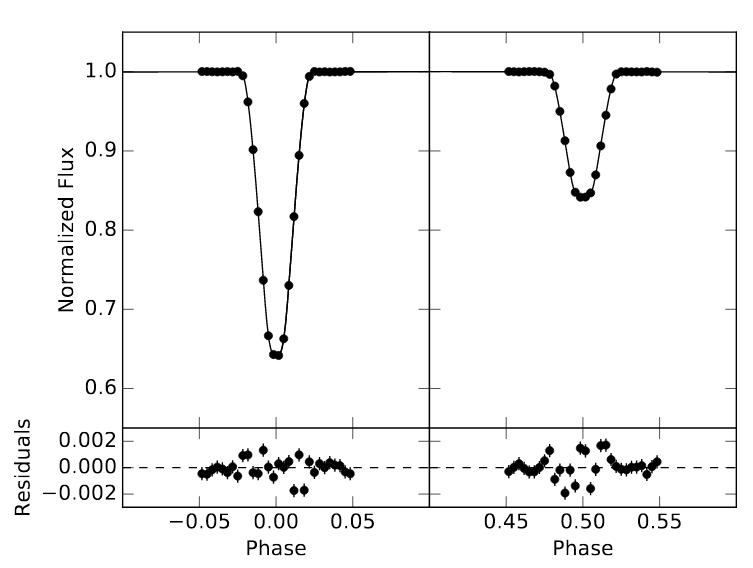
Figure 3b taken from
Fetherolf et al., AJ 158, 198 (2019)
  Q:  What is the depth of the primary eclipse?  Express it as
          the fraction of the light which is blocked.

  Q:  What is the depth of the secondary eclipse?
Next, we'll concentrate on the duration of the eclipse. Let's pick the secondary eclipse. The authors have made a model of the system which emphasizes the shape of the light curve during this dip. I've chosen a small piece of their Figure 7 in order to show clearly the shape of their model.
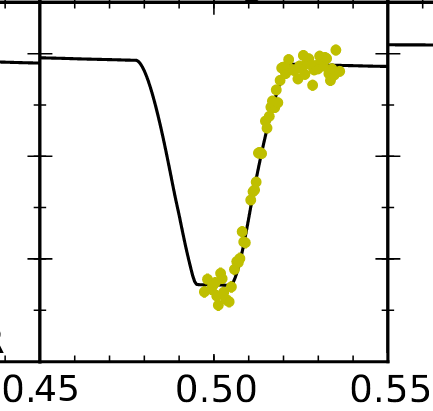
A small piece of Figure 7 taken, and modified, from
Fetherolf et al., AJ 158, 198 (2019)
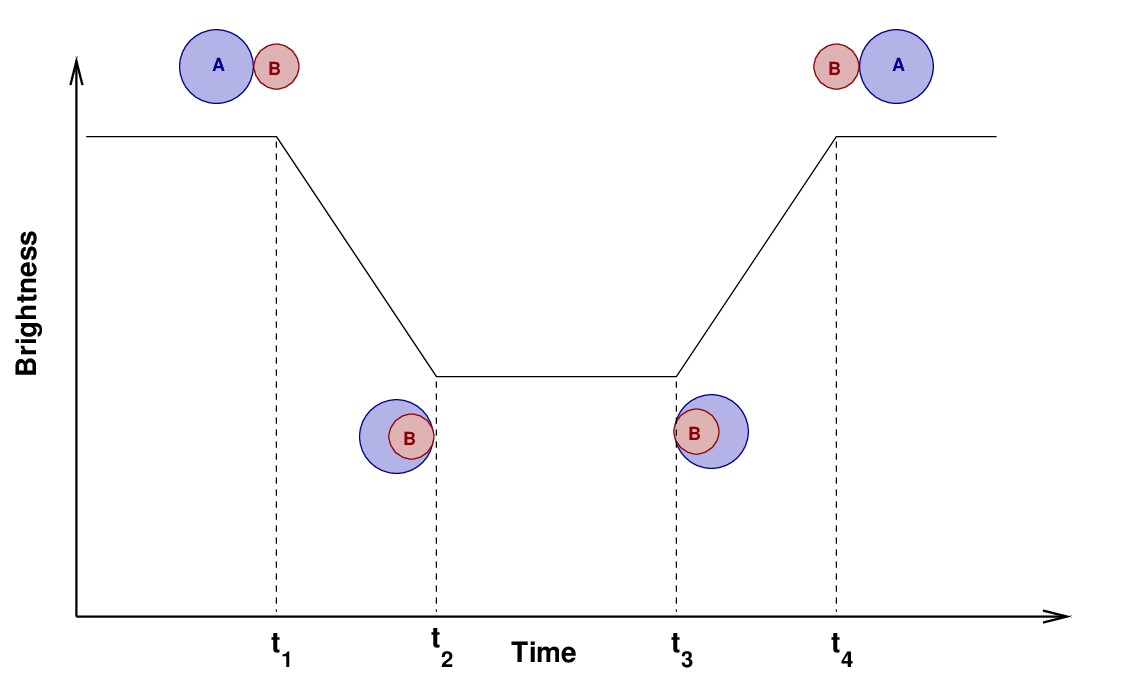
You can see that the model has a flat bottom; the light stays constant during the middle of the dip. Why? Take a look at this close-up view of an eclipsing system. As star "A" moves to the right, and star "B" crosses in front of it to the left, we can identify four moments when the limbs of the stars first (or last) touch each other.
Now, look again at the model of KIC 8736245. You should be able to identify all four moments in the model. Your job is to measure two intervals: the width at the "top" of the dip, and the width at the "bottom". The tick marks on the horizontal axis measure time in phase. Each mark is 0.01 units of phase; in other words, each mark is 0.01 times the period of the star.
A small piece of Figure 7 taken, and modified, from
Fetherolf et al., AJ 158, 198 (2019)
  Q:  The width at the top of the dip is (t4 - t1).
            What is this time, measured in phase (fractions of a period)?
            What is this time, measured in seconds?


  Q:  The width at the bottom of the dip is (t3 - t2).
            What is this time, measured in phase (fractions of a period)?
            What is this time, measured in seconds?
The width at the top of the dip is often called the "duration" of the eclipse.
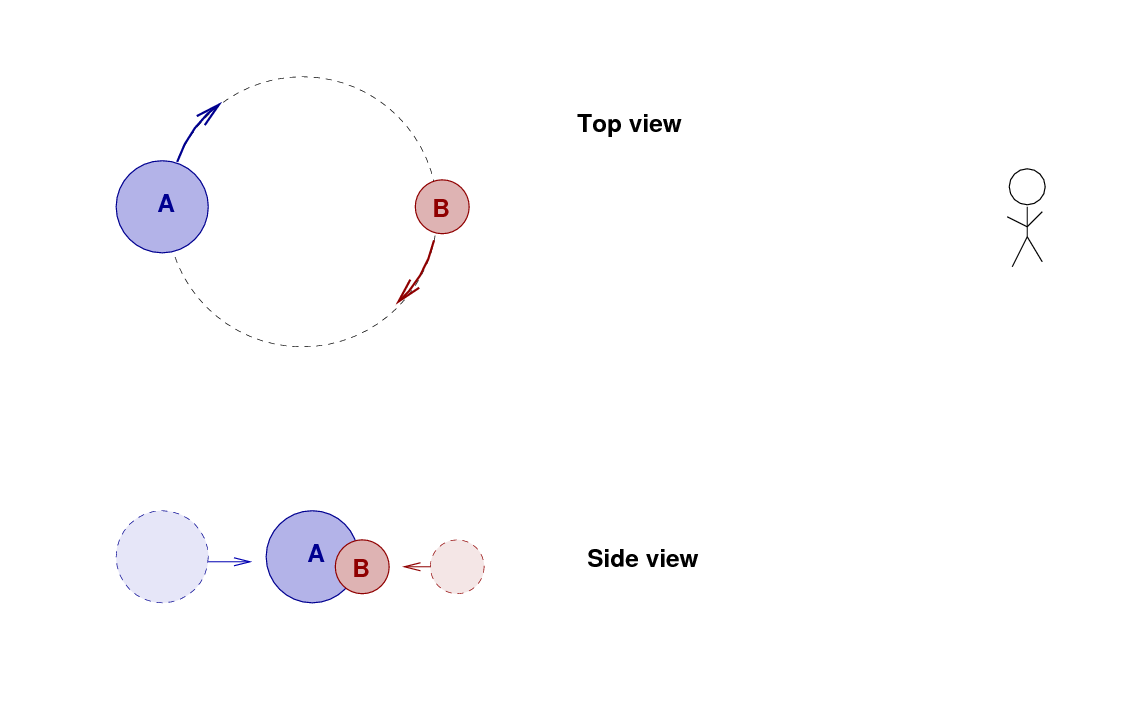
The final property of an eclipsing binary system that we will measure ourselves is the change in color during eclipses. Suppose that a binary has two stars: a hot, blue component (A), and a cooler, reddish component (B), as shown below.
One fundamental property of objects which emit radiation due to their heat is that the intensity of that radiation depends on the temperature of the object. Although one can say quite a bit about this so-called "blackbody radiation," one aspect is quite simple:
Look at the diagram above: during each of the two eclipses, the same AREA of a star is covered by its partner. However, since star A is hot, and star B is cool, those identical areas emit quite different amounts of energy.
  Q:  Which star emits more light per square meter of its surface,
            A or B?

  Q:  During which eclipse is more light blocked?
The DEPTH of the two eclipses in a light curve is one way to find out when the hotter star is being blocked, and when the cooler star is being blocked. But there's another method we can use, too.
  Q:  Suppose we measure the combined color of the light from both stars.
            During each eclipse, how does the color of the system change?
As we will see later, the way to measure the COLOR of a star, in a quantitative sense, is to make measurements of its brightness through two different filters.
The final piece of information we need is the velocity of each star in its orbit. We can derive these speeds using spectra of each star measured at several locations in the orbit. The Doppler shift of the lines yield the radial velocities of each star -- that is, the motion of each one toward or away from us. Click on the figure below to watch a short video illustrating these Doppler shifts; the observer is shown as the green dot at the left.
Image and video courtesy of
Richard W. Pogge, Ohio State University
By measuring the shifts in the spectral lines from each star over a full orbit, astronomers can figure out the speed of each star.
In this paper, Fetherolf et al. provide a nice graph showing the radial velocities at eight moments during the orbit. Note that the average speed of each star is not zero, but around +12 km/sec. That means that the entire binary system as a whole is moving away from the Sun at a systemic velocity of 12 km/sec.
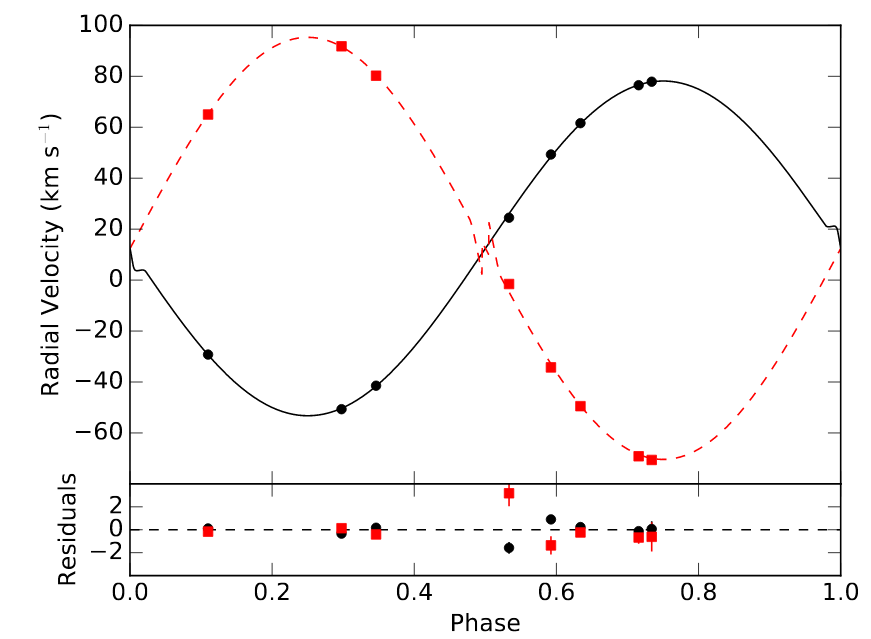
Figure 3a taken from
Fetherolf et al., AJ 158, 198 (2019)
  Q:  What is the amplitude of each star's motion?  In other words,
           what is the maximum speed away from the systematic velocity
           for each star?
Now, the RIT Observatory's telescope is not big enough to record a spectrum with enough accuracy to measure stellar speeds --- so we'll have to rely on other astronomers to do that particular job for us. Where can you find such measurements? Use SIMBAD, of course!
Q: What is the speed of each star in the V505 Per system?
Some stars show periodic variations with a characteristic light curve shape: a quick rise, followed by a slower decline:
Taken from
Bonanos et al., 2004AJ....127..861B
Taken from Musella et al., 2006MmSAI..77..291M
It turns out that these stars change their size, color and luminosity in a periodic manner. The diagram below shows a rough approximation of the relationships.
Why do the stars grow and shrink? Hmmm. The answer might make more sense if we first consider a more familiar situation -- a pot of water with a lid, full of water, sitting on a hot stove.
What happens as the water starts to boil?(Click the picture to find out)
As water turns into steam, it presses against the walls of its container. The pressure pushes the lid upwards, against the force of gravity. But when the lid rises high enough to expose a gap through which the steam can escape, the pressure inside the pot drops suddenly. As a result, the lid falls back into place, and the cycle begins anew.
In a way, the same cycle happens inside certain types of stars. Stars don't have REAL lids, of course ... but under certain circumstances, they can contain a sort of lid. It all boils down (hah!) to the interaction of light with atoms.
Ordinary hydrogen, for example, consists of a negative electron attached to a positive proton. The result is a neutral atom.
If a photon of ordinary visible light impinges on this atom, it will very probably pass right through it.
Deep inside some stars, the conditions --- temperature, pressure, chemical composition, electron density --- allow a variety of hydrogen to form: the negative hydrogen ion.
It turns out that the second electron in this ion makes the ion much more likely to interact with passing photons.
So, let's consider a star which has a layer somewhere in its interior which is rich in negative hydrogen ions (or negative helium ions, which behave in a similar manner).
If we zoom in on that region, we see that photons can't pass through it easily. On their way out from the center of the star into space, many of the photons are absorbed by ions. The collisions push the ions in this layer outwards, away from the hot center of the star.
(Click the image to see what happens)
As a result of this instability, the outer layers of the star expand and cool, then contract and heat up, and the star shrinks and grows in brightness.
Which stars suffer from this sort of instability in their outer atmospheres? It turns out that conditions are right only for a relatively small fraction of all stars; most do NOT pulse in any significant manner.
We'll discuss below
The most important property of a pulsing variable star, by far, it is period. Finding the period can be very easy if the data are plentiful, precise, and cover many periods.
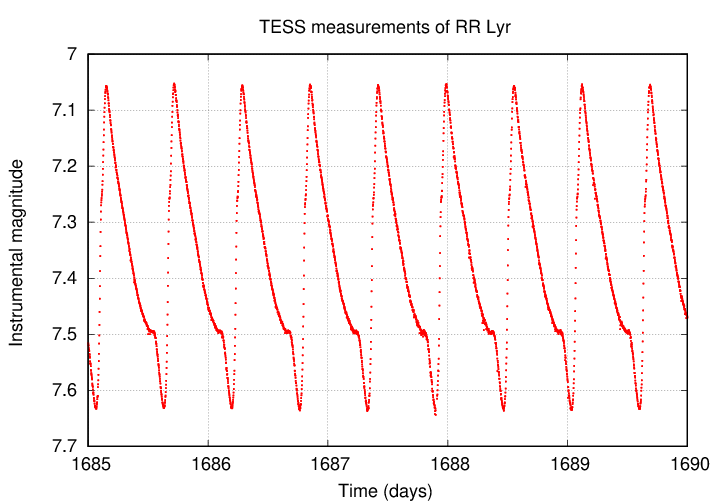
  Q:  Use the light curve above to estimate the period of the
         star RR Lyr.


  Q:  Look up the period of RR Lyr in Vizier's copy of the
          General Catalog of Variable Stars
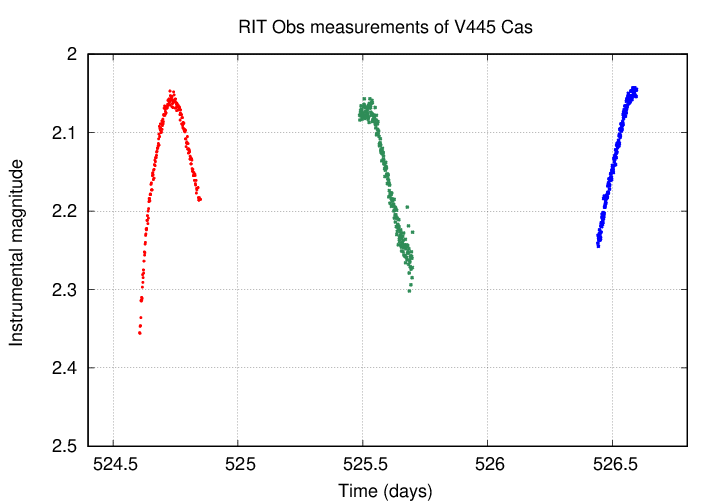
On the other hand, if the measurements are split over a night of nights, and cover only a small number of periods, determining the period can be a challenging task.
Another property of pulsing stars which we ought to measure is the amplitude of their light curves: what is the total change from faintest to brightest, expressed in magnitudes?
  Q:  Use the light curve above to estimate the amplitude of the
         star RR Lyr.


  Q:  What is the amplitude of RR Lyr in Vizier's copy of the
          General Catalog of Variable Stars?
         (Hint: compute the difference between Min1 and MagMax)
The final characteristic of a pulsing star that we can measure from its light curve is its change in color over one complete cycle. In order to make a quantitative measurement of this change, one must create a "color curve".
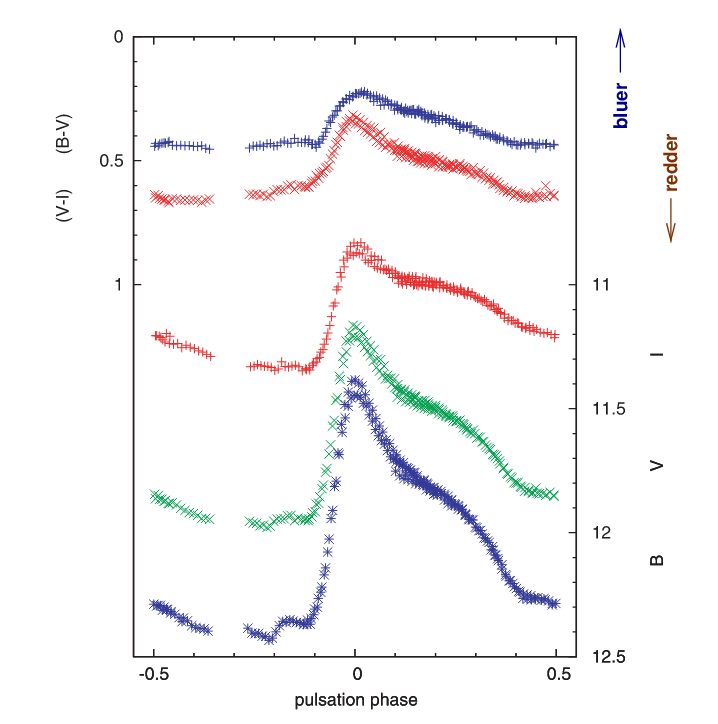
Figure 4 taken from
Jurcsik et al., MNRAS 423, 993 (2012)
You will, on Friday, choose a target -- a variable star which you should be able to measure accurately with our equipment over the next few months. Let's go over some of the items to keep in mind as you try to choose from the tens of thousands of stars in the sky.
Your star ought to satisfy all of the following criteria:
In addition, it will be a great help if we can compare our results to those of other astronomers, and make use of additional measurements they might have made. So there's a bonus for targets which
Copyright © Michael Richmond.
This work is licensed under a Creative Commons License.