 Copyright © Michael Richmond.
This work is licensed under a Creative Commons License.
Copyright © Michael Richmond.
This work is licensed under a Creative Commons License.
This week's classes focus on eclipsing binary star systems, which are among the most valuable items in an astronomer's toolbox. Today, we'll look at the physics of a binary star, and figure out how to derive fundamental properties of a system -- the mass and size of the stars, for example -- from the quantities we can easily observe. Next time, we'll see what astronomers have learned from applying these lessons to certain particular binary systems.
You already know what a star is. A binary star is simply a pair of stars which orbit around each other due to their mutual gravity.
Now, if we are very lucky, and the following conditions are ALL met,
then we can use geometry and one solid bit of physics -- the spectrum of radiation emitted by a hot gas -- to determine the masses and sizes of the stars, their temperatures, and even the distance to the system.
This is not such a common occurence. In many cases, we CAN'T tell that a tiny little dot of light in the sky is actually the combined light of two stars. Even when we can, in the overwhelming majority of cases, the plane of the orbit is NOT edge on, so we won't see the effects of one star blocking the other's light. Finally, even if we do notice the changes in brightness that reveal eclipses, we may not be able to measure spectra of BOTH stars. If we can only acquire spectra of one of the two stars, then we can't learn quite so much about the stars in the system.
But let's suppose that we happen to stumble across a system which meets all the conditions, allowing us to make light curves and high-quality spectra of both stars.
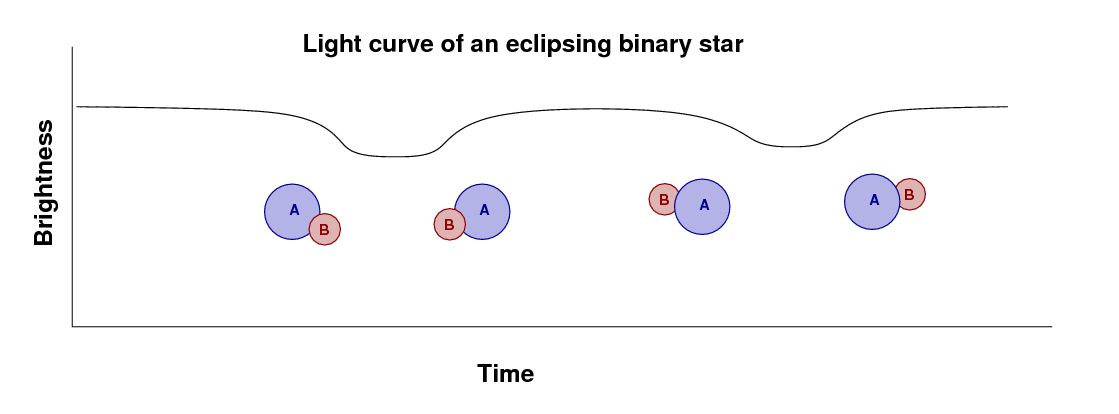
If we measure the light from the system over one full orbital period, then we'll see one dip in the brightness as star B passes in front of A, and then a second dip when A passes in front of B.
Going from this light curve, and spectra of the two stars measured at several times, to the physical parameters of each star involves several steps.
Step II
Step III
Step IV
The first step is pretty simple, and it doesn't involve a great deal of expertise. The second step is not so simple, since stars do not emit like blackbodies at levels of a few percent; but for our purposes today, we'll accept the errors for the sake of simplicity, and pretend that all stars are blackbodies. The third step is again pretty simple, though there can be complications due to extinction and reddening.
Throughout today's class, I'll use as examples the measurements and calculations of this paper:
Our simplified calculations may not match the results reached by the authors of this paper, who do everything much more carefully and take no shortcuts. I apologize to them in advance for over-simplifying their work!
The first and easiest (usually) aspect of a binary system to measure is the period of the orbit. Our example involves measurements of a star with the Kepler space telescope, which made very precise light curves. Take a look at its measurements of KIC 8736245.
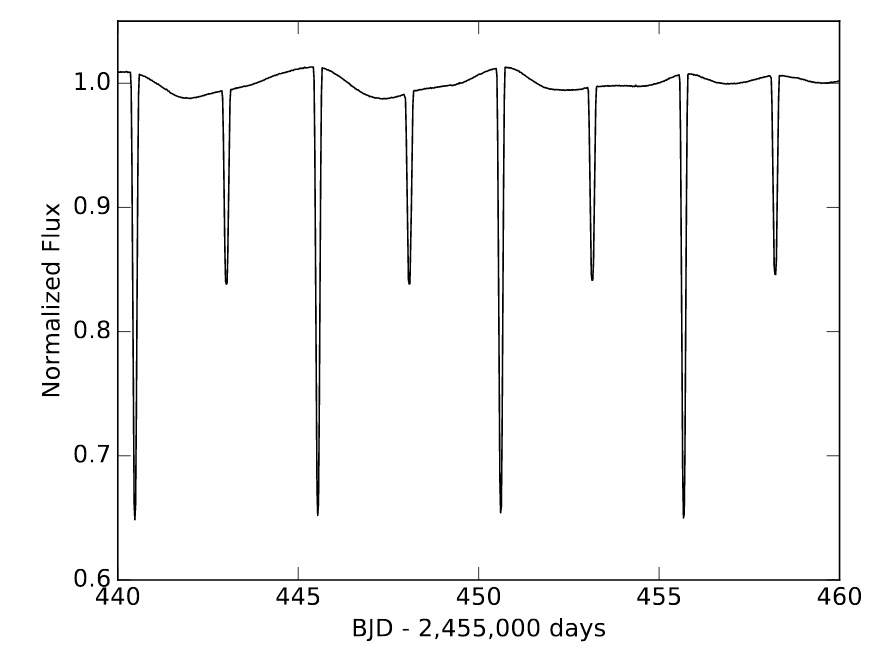
Taken from Figure 1 of
Fetherolf et al., AJ 158, 198 (2019)
  Q:  What is the period of this orbit?  Express your answer in days,
             and in seconds.
Another important parameter is the inclination of the orbit, relative to our line of sight. If the orbit is face-on (in which case we can't see eclipses), the inclination is zero degrees; if the orbit is edge-on (in which case we CAN see eclipses), the inclination is 90 degrees. We'll just assume that this orbit is perfectly edge-on, which simplifies all the calculations.
If we zoom in on each of the two eclipses, we see that one is deeper than the other; we call the deeper one the primary eclipse, and the shallower one the secondary eclipse.

Figure 3b taken from
Fetherolf et al., AJ 158, 198 (2019)
We'll come back to the depth later; for now, we need to concentrate on the duration of the eclipse. Let's pick the secondary eclipse. The authors have made a model of the system which emphasizes the shape of the light curve during this dip. I've chosen a small piece of their Figure 7 in order to show clearly the shape of their model.
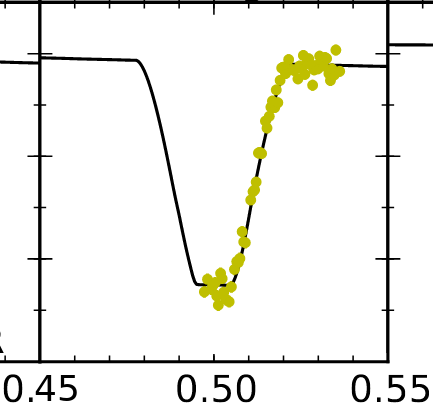
A small piece of Figure 7 taken, and modified, from
Fetherolf et al., AJ 158, 198 (2019)
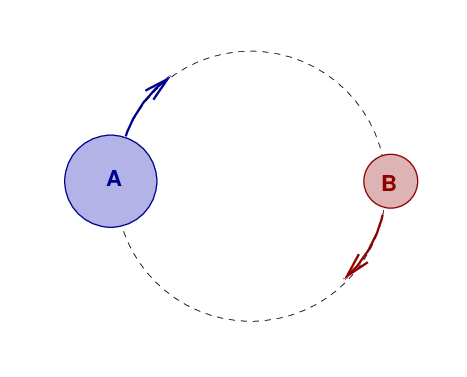
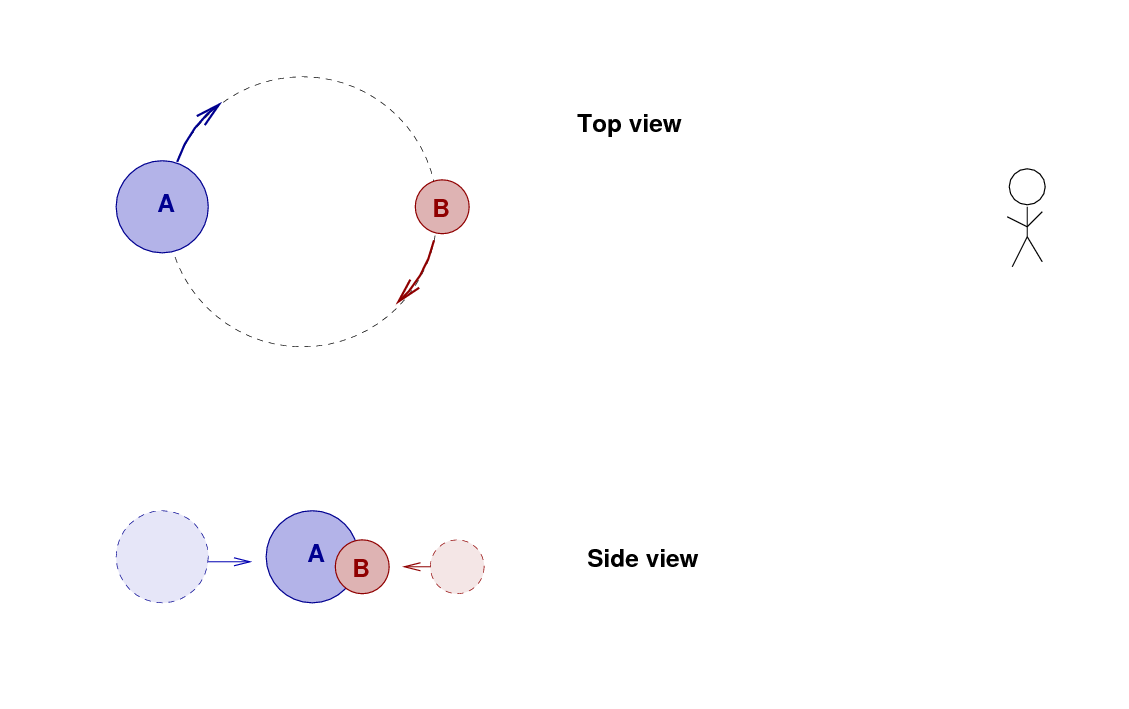
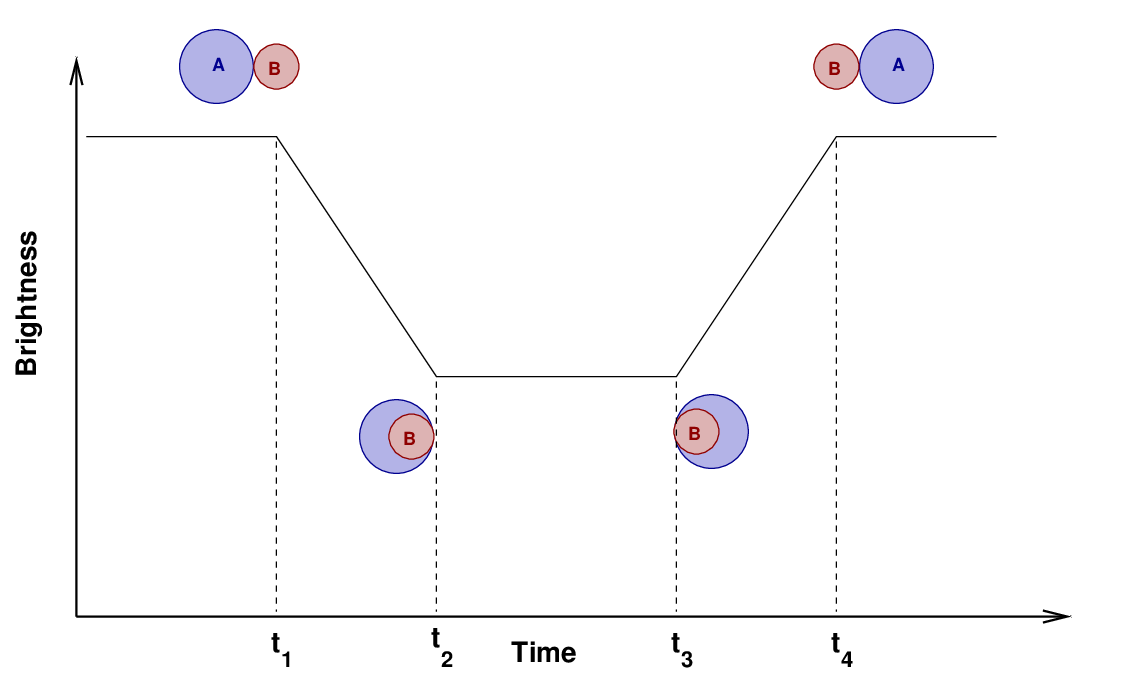
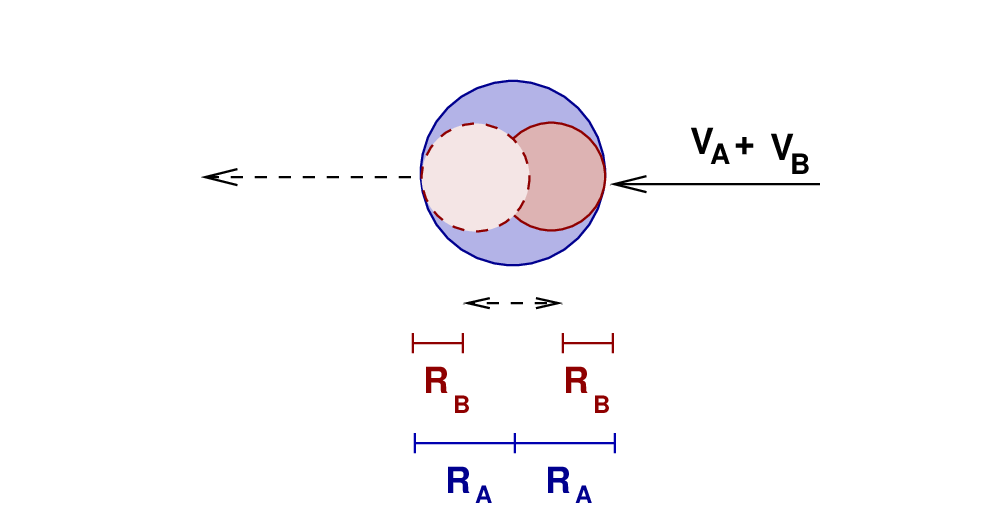
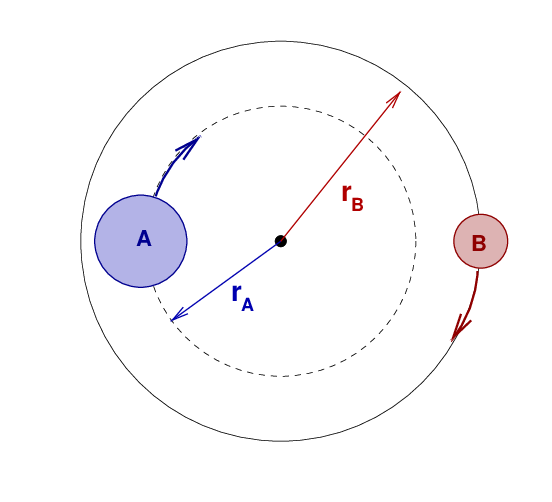
You can see that the model has a flat bottom; the light stays constant during the middle of the dip. Why? Take a look at this close-up view of an eclipsing system. As star "A" moves to the left, and star "B" crosses in front of it to the right, we can identify four moments when the limbs of the stars first (or last) touch each other.
Now, look again at the model of KIC 8736245. You should be able to identify all four moments in the model. Your job is to measure two intervals: the width at the "top" of the dip, and the width at the "bottom". The tick marks on the horizontal axis measure time in phase. Each mark is 0.01 units of phase.
A small piece of Figure 7 taken, and modified, from
Fetherolf et al., AJ 158, 198 (2019)
  Q:  The width at the top of the dip is (t4 - t1).
            What is this time, measured in phase (fractions of a period)?
            What is this time, measured in seconds?


  Q:  The width at the bottom of the dip is (t3 - t2).
            What is this time, measured in phase (fractions of a period)?
            What is this time, measured in seconds?
  Q:  What is the duration of the eclipse?  Measure the two widths
             and average them.  Express the result in terms of
             "phase" = fraction of the period, and in terms of seconds.
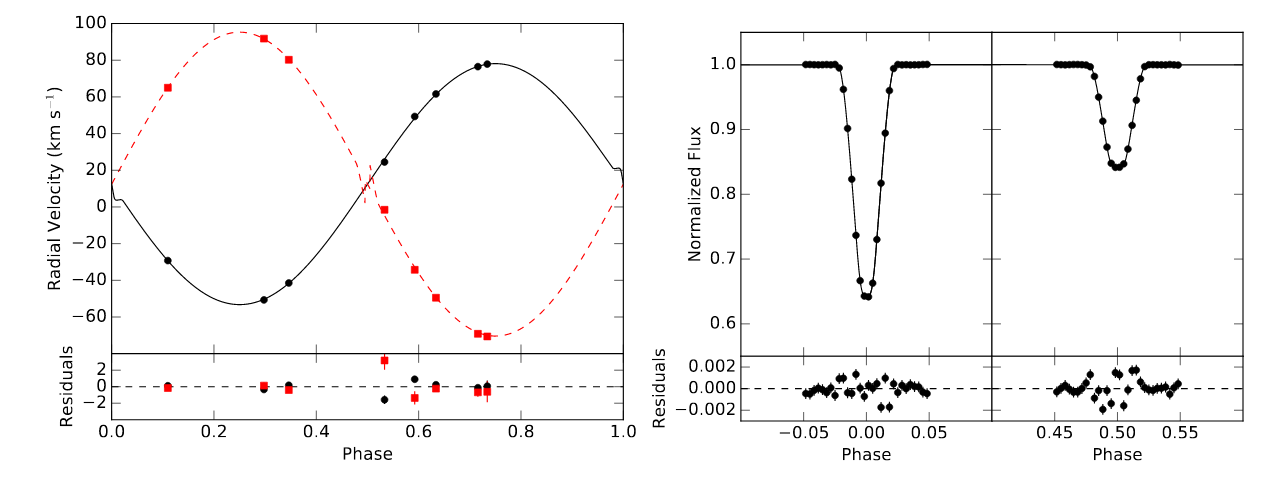
The final piece of information we need is the velocity of each star in its orbit. We can derive these speeds using spectra of each star measured at several locations in the orbit. The Doppler shift of the lines yield the radial velocities of each star -- that is, the motion of each one toward or away from us.
In this paper, Fetherolf et al. provide a nice graph showing the radial velocities at eight moments during the orbit. Note that the average speed of each star is not zero, but around +12 km/sec. That means that the entire binary system as a whole is moving away from the Sun at a systemic velocity of 12 km/sec.
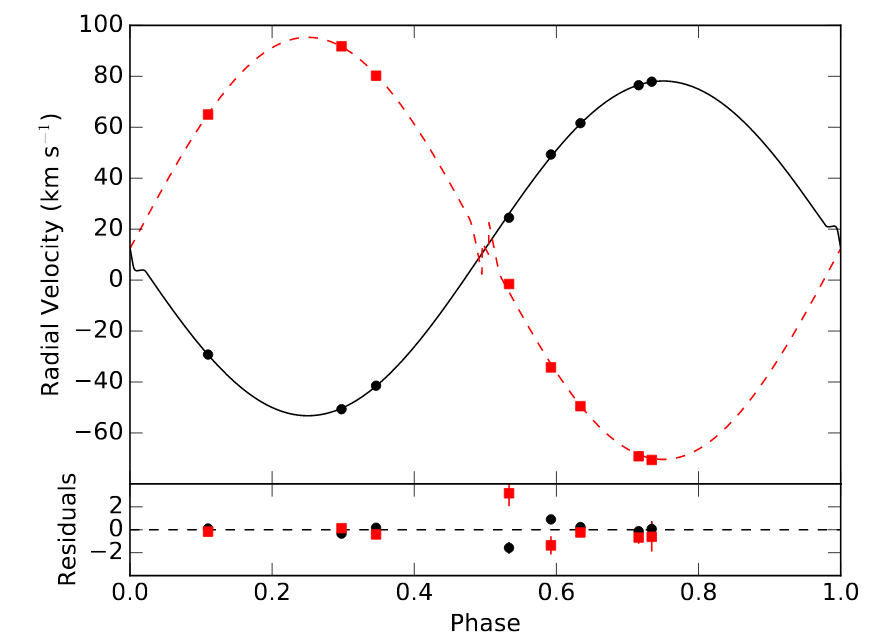
Figure 3a taken from
Fetherolf et al., AJ 158, 198 (2019)
  Q:  What is the amplitude of each star's motion?  In other words,
           what is the maximum speed away from the systematic velocity
           for each star?
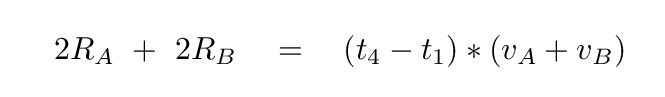
Right. We're almost ready to compute the size of each star. Look closely at the motion of the two stars as the eclipse happens. Since the two stars are moving in opposite directions as they pass each other, their RELATIVE speed is simply (vA + vB). Let's fix the star B in place, and watch as the star A moves across it from right to left at this combined speed. During the time period from first to fourth contact, the star A must move a distance of RB + RA + RA + RB.
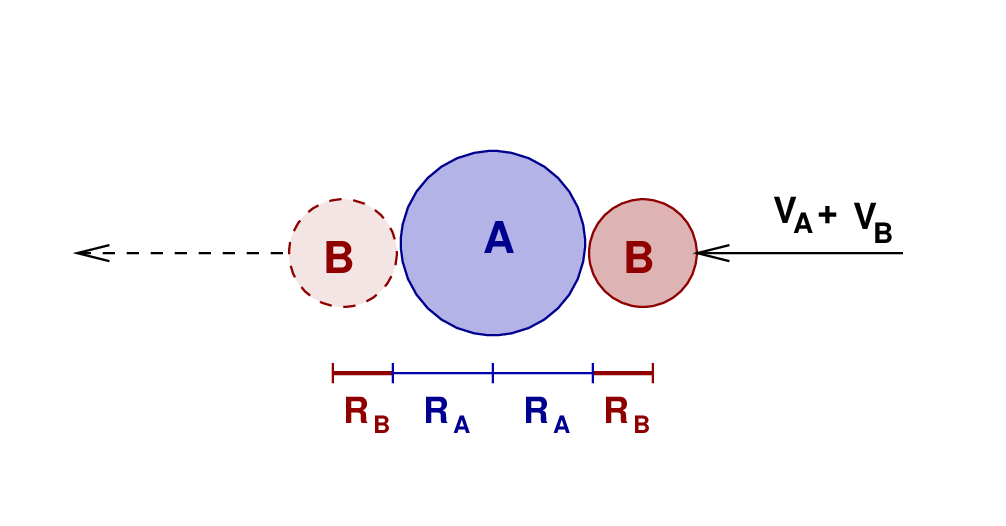
That means that we can find one equation for the radii of the stars.
In a similar way, we can derive a second relationship involving the radii and the time between second and third contact.
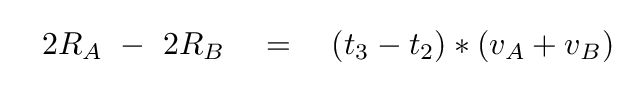
Hmmm. Two equations for two unknown radii. This is a job for linear algebra.
  Q:   Add these two equations together, then solve for the
             radius RA.

       Then plug in values to compute the radius of star A in meters.

                 (t4 - t1) = 17300  s
                 (t3 - t2) =  6050  s
                 (v1 + v2) =   150  km/s

             Compare to the radius of the Sun.
In a similar way, one can compute the radius of the other star using this information.
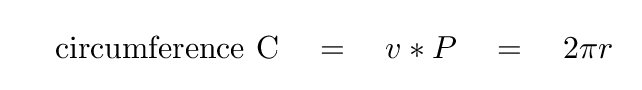
In order to compute the mass of each star, we will apply Kepler's Third Law. You remeber that relationship between period and size of an orbit, right?
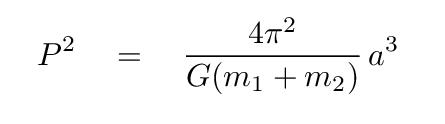
The period -- we already know that: it is 5.0 days = 432,000 seconds. But what is the semi-major axis?
In a binary star system, the semi-major axis is the separation between the two stars. If the two stars have different masses, then each will orbit the center of mass with a different orbital radius. The semi-major axis a is just the sum of these two radii.
So, if we could figure out the orbital radius of each star, we could add them together to find a, and then compute the total mass using Kepler's Third Law. And we CAN figure out the orbital radii; here's how. We know how fast each star is moving,
  Q:  What is the radius of star A's orbit?

  Q:  What is the radius of star B's orbit?

  Q:  What is the semi-major axis?
Great! Now we can compute the mass of the two stars added together using Kepler's Third Law:
  Q:  What is the mass of the two stars added together?
             Express in kg, and in solar masses (1.99 x 1030 kg).
But we want to know the mass of each star individually, too. Fortunately, we already possess a clue that provides the answer. The radial velocity measurements showed that one star moved more quickly than the other.
Figure 3a taken from
Fetherolf et al., AJ 158, 198 (2019)
Why is that? Because the gravitational force is the same on both stars, the less-massive object will be given a larger acceleration, and thus a larger velocity. It's a simple relationship:
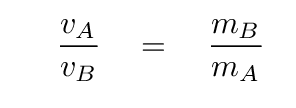
  Q:  Use this relationship, and the velocities we measured earlier

             vA  =  68 km/s          vB  =  82 km/s

           to determine the ratio of masses.


  Q:  Use the ratio of masses, and the total mass you calculated,
           to determine the mass of each star.
Next on the shopping list is the temperature of each star. In this case, we can use simple arguments to get a rough answer, but precise values will require much more detailed modeling of the stellar spectra than we can do in this class. So, our results will only be approximate.
The first order of business is to figure out which star is the hot one, and which the cool one -- if they have different temperatures. During one full orbit, each star goes behind the other once. During each eclipse, the same surface area of one star is covered by the other. So, if the two stars were the same temperature, then each would emit the same amount of energy per square meter, and so covering the same area of each would dim the system by the same amount.
Is that what's happening in this system? Compare the depth of the primary eclipse at phase = 0.0 to the depth of the secondary eclipse at phase = 0.5.
Taken from Figure 3 of
Fetherolf et al., AJ 158, 198 (2019)
  Q:  Are the two eclipses the same depth?   If not, which one involves
              a greater dimming?


  Q:  So, during the primary eclipse at phase = 0.0, which star is hidden:
              the hotter one, or the cooler one?
Okay, good. We know that the hotter star must be hidden from us during the primary eclipse.
But which one is the hotter star? The more massive component, or the less massive component?
To answer that question, take a look at Figure 3 again. This time, pay attention to the left-hand panel. At phase = 0.0, each star is moving sideways to our line of sight. But as the phase advances, the one which was in front will start moving away from us, and the one which was behind will start moving toward us.
Taken from Figure 3 of
Fetherolf et al., AJ 158, 198 (2019)
  Q:   Just after phase = 0.0, which star is moving toward us?


  Q:   So which star is the hot component -- the more massive,
               or the less massive?
Right! In this case, the more massive star is also the hotter star. We've been calling the more massive star "A" throughout these notes, so now we know: star "A" is both more massive than star "B", and hotter, too.
Knowing which star is hotter is fine, I guess, but it's not really very quantitative. If we do a little geometry, and use a little physics, we can derive a formula which will tell us the ratio of the temperatures. Consider the system at three different moments:
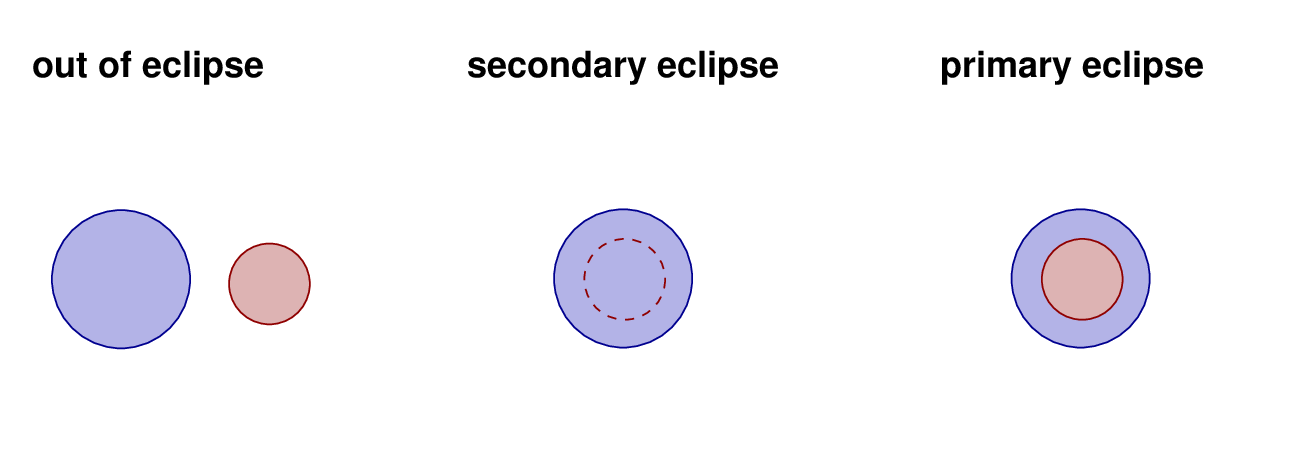
Now, if we assume that each star emits like a blackbody, then we can compute the total brightness of the system at each of these moments.
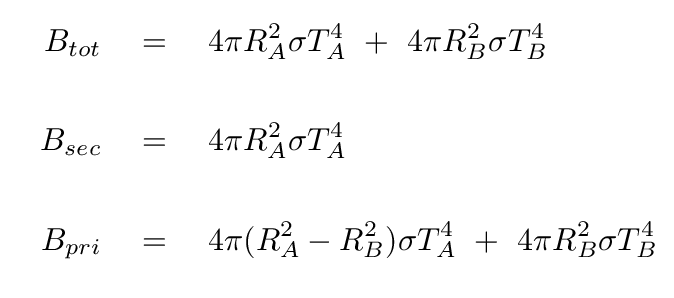
If we subtract the brightness during each eclipse from the full brightness of the system, we get the following differences:
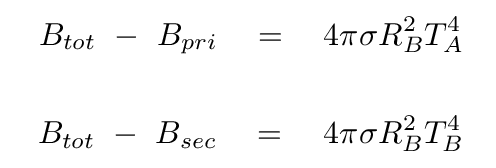
Note the very similar terms in each of these expressions. Only the temperature is different. So, if we divide one expression by the other, we get a very simple result:
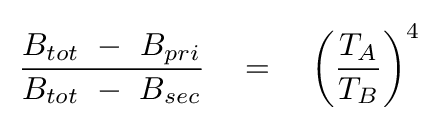
The differences on the left-hand side of this equation are simply the depths of each of the eclipses, measured in linear intensity. Hey! We have seen that the Kepler space telescope made very nice measurements of those depths. Remember this figure?
Figure 3b taken from
Fetherolf et al., AJ 158, 198 (2019)
  Q:   What is the depth of the primary eclipse?  That will give us
                   (B_tot  -  B_pri)


  Q:   What is the depth of the secondary eclipse?  That will give us
                   (B_tot  -  B_sec)


  Q:   What is the ratio of the temperatures of the stars?
Now, this calculation assumes that both stars emit as perfect blackbodies. Real stars are sorta-kinda-mostly blackbodies, but always differ when one drills down to the 10 percent or 5 percent level. So, we can expect this formula to give us an approximate relationship, but not an exact one.
In order to do a proper calculation of the temperatures of the stars, one needs to compute a full spectral model of each star's photosphere; that will depend on the chemical composition, mass, age, and other factors. It's a job too big for us, but astronomers who specialize in the analysis of eclipsing binaries have developed tools to do all this work. See some of the references listed at the end of this lecture.
Well, if we have done all the steps up to this one, computing the luminosity is a cinch! If we continue to assume that each star radiates like a blackbody, then the total energy emitted by the pair is simply

Let's see how we can put this to use. When I worked through the example of KIC 8736245, I ended up with the following values (which are reasonably close to the numbers computed in Fetherolf et al. ):
   R_A  =  1.30 R(solar)  =  9.04 x 10⁸ m
   R_B  =  0.80 R(solar)  =  5.56 x 10⁸ m

   T_A  =  5810 K
   T_B  =  5030 K
Please use these values (and σ = 5.67 x 10⁻⁸ J/K) to compute the total luminosity of this system.
  Q:  What is the total luminosity of this binary star?
           Express in terms of the solar luminosity,   3.8 x 1026 W
Aha! If we know the luminosity of a star, and its apparent magnitude, then we can determine the distance to the star. Let's try that.
In the Gaia "G" magnitude system, our Sun has a absolute magnitude of M = +4.67, according to Casagrande and VandenBerg, MNRAS 479, L102 (2018) ).
  Q:   The binary system is 2.1 times brighter than the Sun.
             What is the absolute magnitude of the binary system?
But the APPARENT magnitude of KIC 8736245 was measured by Gaia to be m = 13.79.
   Q:   Estimate the distance to KIC 8736245, using the formula


                (m - M)  =  5 log d  - 5


   Q:   How does this compare to the distance measured by Gaia
               using parallax?  You can find the Gaia parallax
               at  SIMBAD's entry for KIC 8736245
Copyright © Michael Richmond.
This work is licensed under a Creative Commons License.