 Copyright © Michael Richmond.
This work is licensed under a Creative Commons License.
Copyright © Michael Richmond.
This work is licensed under a Creative Commons License.
Take a look at this photograph of open star cluster M103.

Which are the three brightest stars? Clearly, these stars should have the smallest magnitudes, right? And here are the Bt magnitudes in the Tycho-2 catalog.
      star   Bt mag
      ---------------
        A     7.6
        B     8.6
        C     9.3
        D    12.6
      ---------------
But watch what happens when we take a picture of the same cluster of stars with a different sort of photographic emulsion.
Click on the picture above.
Which are the three brightest now? So which should have the smallest magnitude values?
Okay, something's fishy here: how can one set of stars be brightest in one picture, but a different set of stars be brightest in another? Perhaps looking at this sequence of images will give the answer.
Stars come in a wide variety of colors. It's not glaringly obvious when you look at them up the in sky, for several reasons:
Nonetheless, if you look carefully, you will see slight differences in colors. In the constellation Orion, for example,
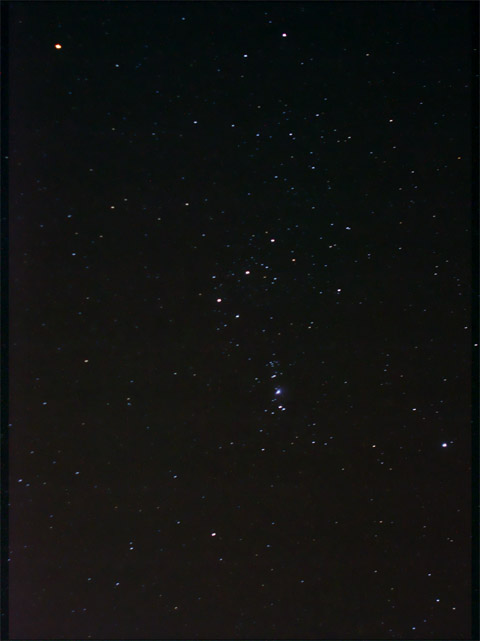
Image courtesy of Denys Sakva
Betelgeuse, at the upper left, is clearly redder than most of the stars.
You can enhance the colors in a photograph (or an eyepiece) by defocusing so that the light is spread out over a larger area.
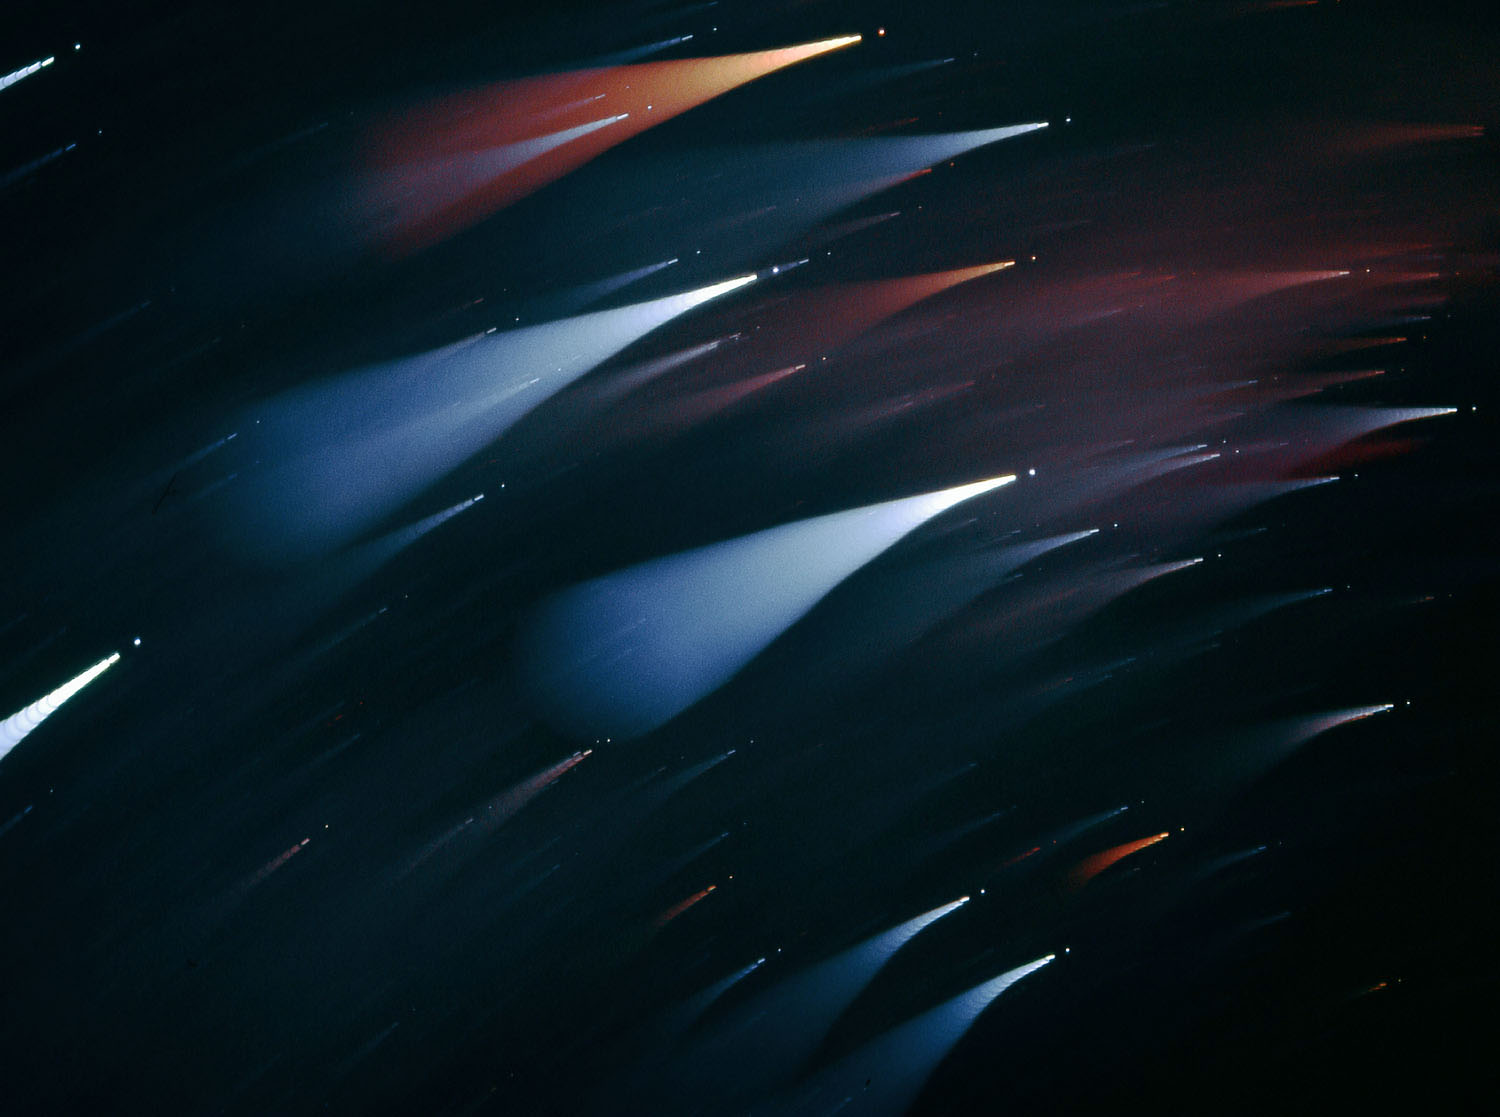
Image from
Astronomy Picture of the Day 2004 July 8 , copyright
Stefan Seip .
  Q:  What causes some stars to look blue and others red?
      In other words, what is the cause of stellar color?
The answer is temperature.
Let's take just a moment to discuss the way astronomers describe temperature. Here on Earth, under ordinary circumstances, people use temperature scales which tend to give "convenient" values for most objects: small positive numbers, like "12" or "45" or "98".
                   Fahrenheit       Celsius
-----------------------------------------------
 temp = 0         salty water      pure water
                   freezes          freezes


 temp = 100       human body       pure water
                 temperature        boils
------------------------------------------------
Astronomers study objects which cover a much, much wider range of temperatures. Very cool clouds of gas and dust may have temperatures which are inconveniently low in this ordinary scales: -420 Fahrenheit or -250 Celsius. Ordinary stars like the Sun have temperatures in the thousands of degrees, and very hot stars may reach many tens of thousands. It is confusing to deal with both negative and positive numbers, so astronomers choose to adopt the Kelvin temperature scale: it starts at the coldest possible temperature, then moves upwards in steps which are the same size as Celsius degrees.
                   Fahrenheit       Celsius        Kelvin
-----------------------------------------------------------
coldest possible     -459            -273            0
temperature

pure water
freezes                32               0          273

pure water
boils                 212             100          373

------------------------------------------------------------
It's easy to convert from Celsius to Kelvin: just add 273. Converting from Fahrenheit to Kelvin is a bit harder, but if you use Celsius as an intermediate step, it isn't so hard.
Note that scientists often omit the word "degrees" when describing a temperature in Kelvin. Pure water freezes at "0 degrees Celsius," but at "273 Kelvin". Someone who wants to sound old-fashioned might even write "273 Kelvins".
You probably already know that hot objects glow with a color that depends on their temperature. Relatively cool lava -- only 1000 Kelvin -- appears a dull red:

while an oxyacetylene blowtorch at 3200 Kelvin emits bluish-white light:
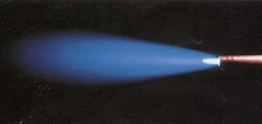
What's happening is that the temperature of an object affects the spectrum of light that it emits. A "spectrum" is simply a description of the amount of light broken up by wavelength. We can display the spectrum of an object as a picture, like this:

Image copyright Maurice Gavin
We can also show spectra in graphical format, with wavelength along the horizontal axis and intensity of light along the vertical axis.
Image and spectrum copyright Maurice Gavin
It turns out that there is a clear pattern to the spectrum of light emitted by an object (we'll discuss this in more depth next week).
Now, let's see what happens if we look at two stars of different temperatures through a set of filters: blue, green and red. The most common broad-band filters used by astronomers have names which almost make sense:
The most commonly used filters used to be B and V, though these days I is coming on strong. In many catalogs and databases, all you see is the B-band and V-band magnitudes for stars. SIMBAD, for example, by default shows a list like this:
When astronomers measure the magnitude of a star through one of these filters, they often use the name of the filter to describe their measurement:
      V = 10.53   means  "the apparent magnitude measured
                          through a V filter was 10.53"

Hot stars emit most of their light at short wavelengths: in the blue and ultraviolet. So when we measure their light through filters, we see
If we subtract the magnitude in the V filter from the magnitude in the V filter, we get a quantity, (B-V), which astronomers often call the "color" of the star. For a hot star, (B-V) is (small - large) = negative. So very hot stars have negative (B-V) colors.
On the other hand, cool stars emit most of their light in the red part of the spectrum.
So when we measure their light through filters, we see
And the result is that (B-V) is (large - small) = positive. So cool stars have positive (B-V) colors. In short,
    (B-V) color            temperature
    ----------------      ------------
    small   (< 0.5)          hot

    big     (> 2.0)         cool
The color index of the Sun is about (B-V) = 0.6.
The temperature of a star tells us much about the conditions in its atmosphere and the amount of energy it produces. There are several ways to determine the temperature of a star. Spectroscopy (which we will discuss next week) provides a precise value, but it requires a lot of work, both in the observations and the reductions. Just measuring the apparent magnitude (a process called "photometry") of a star through two different filters, on the other hand, is quick and easy; best of all, we can measure hundreds or thousands of stars all at once in a single image.
This image courtesy of the
Optical Gravitational
Lensing Experiment.
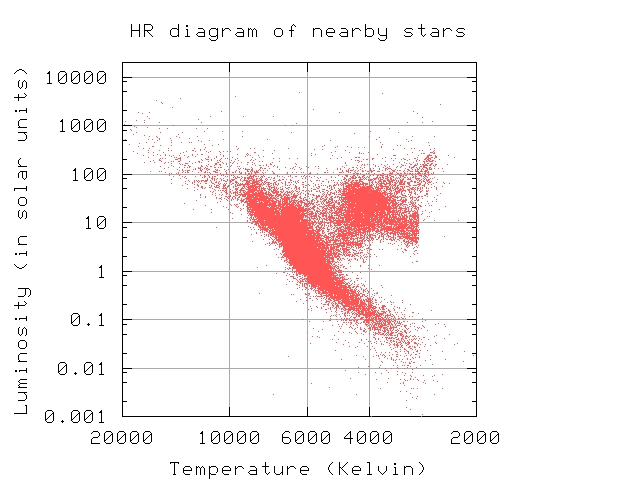
Later on in this course, you will see examples of graphs and equations in which astronomers sometimes use color index, and other times use temperature; from our point of view, they are sometimes equivalent. For example, Hertzsprung Russell diagram, which shows the relationship between the luminosity of a star and its temperature, is sometimes drawn with (B-V) color index on the horizontal axis:
But other times, we put temperature on the horizontal axis:
Astronomers have worked out the relationship between color index and temperature in detail (for a subset of stars): Sekiguchi and Fukugita, AJ 120, 1072 (2000) show
 Q:  What is the temperature of the Sun?

 Q:  What is the color index of a star with temperature 8000 K?

 Q:  What is the temperature of a star with a color index
         (B-V) = 1.0?
Copyright © Michael Richmond.
This work is licensed under a Creative Commons License.