 Copyright © Michael Richmond.
This work is licensed under a Creative Commons License.
Copyright © Michael Richmond.
This work is licensed under a Creative Commons License.
There are many, many types of stars which vary in brightness. Some are single, others are members of binary systems. While they are interesting for their own sakes, a very few of them can be used to help us find distances. But only a few ...
We'll start by discussing how binary stars with JUST the right properties, and with a LOT of observations, both photometric (easy) and spectroscopic (hard), can yield very secure distances. After that, we'll turn to the several types of pulsating stars (not pulsars) which can provide distances with some extra assumptions and approximations.
Consider a pair of stars in a binary system, orbiting around their center of mass. If we are very lucky, and the following conditions are ALL met,
then we can use geometry and one solid bit of physics -- the spectrum of radiation emitted by a hot gas -- to determine the distance to the binary system. Here's how we do it.
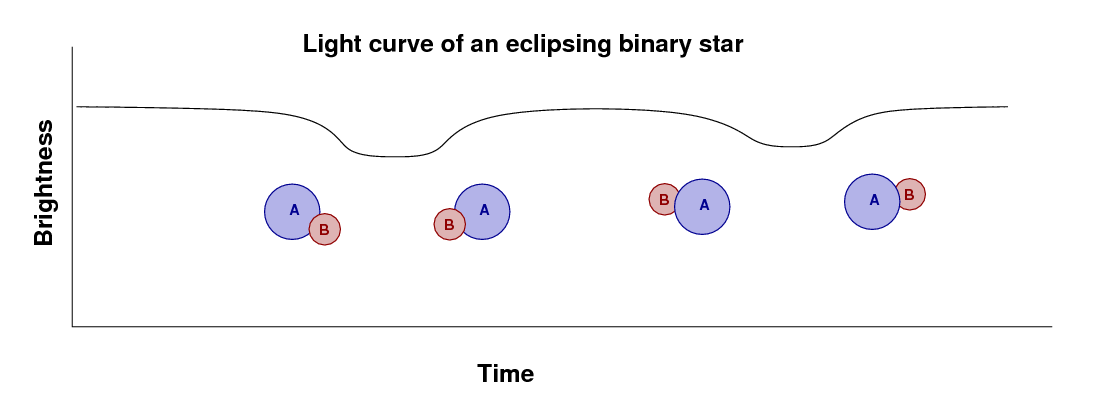
Suppose that two stars orbit each other in such a way that we see them pass in front of each other.
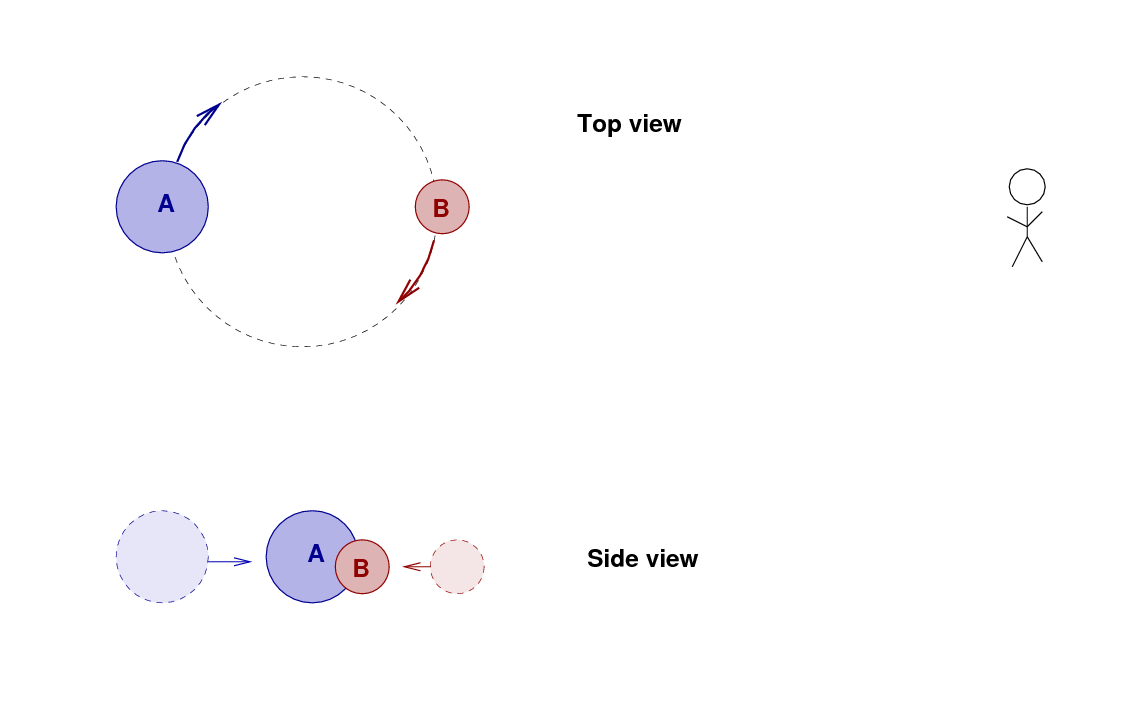
If we measure the light from the system over one full orbital period, then we'll see one dip in the brightness as star B passes in front of A, and then a second dip when A passes in front of B.
How can we use these binary stars to measure distances? We need to determine a number of parameters; we can divide the work into several steps.
Step II
Step III
The first step is pretty simple, and it doesn't involve a great deal of expertise. The second step is NOT simple, since stars do NOT emit like blackbodies at the level of accuracy which we need for this calculation. The third step is again pretty simple, though there can be complications due to extinction and reddening.
Let's go through just a few steps of this process in class. We'll use data from the paper The Distance to the Large Magellanic Cloud from the Eclipsing Binary HV 2274 .
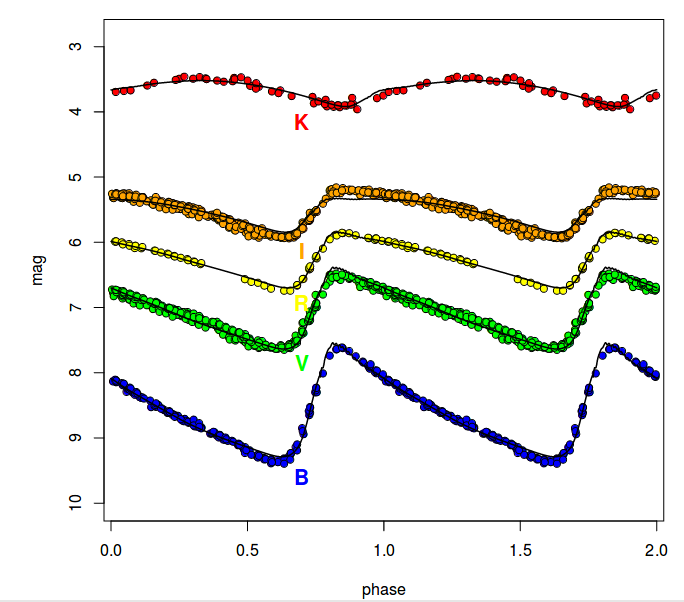
Examine the figure below, which shows both radial velocities and the light curve of this binary as a function of time. The period of the system is 5.73 days.
Figure taken from
Guinan et al., ApJ 509, 21 (1998)
  Q:  What is the orbital speed of each star
      around the center of mass?
      You may pretend that the orbits are circular
      and equal in amplitude for this exercise.


  Q:  How long does the secondary eclipse at
      orbital phase 0.5 last?


  Q:  What is the size of each star?  You may
      pretend that the two stars are equal
      in size.
The authors go through the rest of the procedure and end up with a pretty good measurement of the distance to this system: 45.7 +/- 1.6 kpc. That's an uncertainty in distance of just about 3 percent!
However, the paper we've just discussed was published in 1998 and involves hot stars, for which stellar models may not be very accurate. More recent papers involving binary star systems in the LMC are:
both study binary systems with cooler stars, for which the stellar models are considered more accurate. Pietrzynski et al. (2013) claim that their set of 8 binary systems yields a distance to the LMC barycenter of 50.0 +/- 1.1 kpc, which is not quite consistent with the earlier results.
Elgueta et al. (2016) derive a distance of 49.0 +/- 0.5 (stat) +/- 1.0 (systematic) kpc to the binary OGLE-LMC-ECL-25658, which lies far off to one side of the LMC; once they correct for its location within the little galaxy, they determine a distance to the center of the LMC of 50.30 +/- 0.53 (stat) kpc
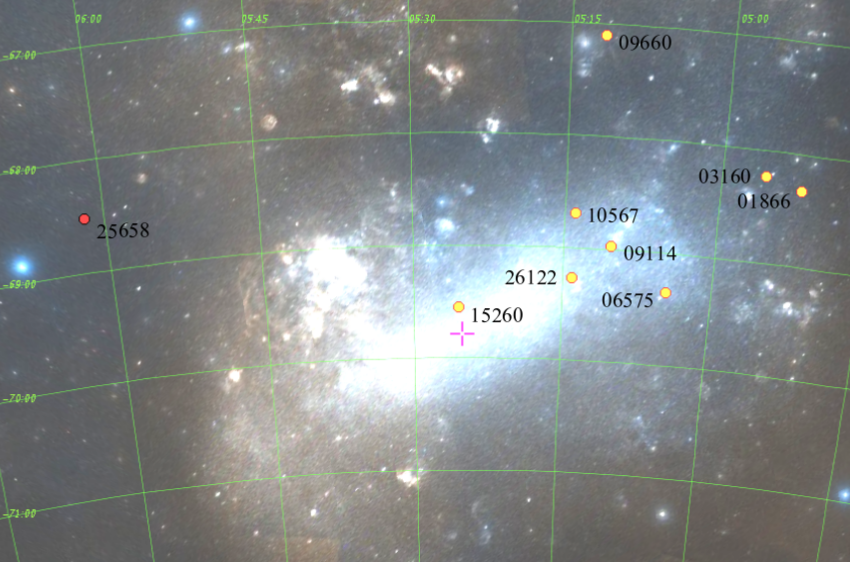
Figure 1 taken from
Elgueta et al. (2016).
The binary system OGLE-LMC-ECL-25658
is the red dot to the left of center.
Some stars show periodic variations with a characteristic light curve shape: a quick rise, followed by a slower decline:
Taken from
Bonanos et al., 2004AJ....127..861B
Taken from Musella et al., 2006MmSAI..77..291M
It turns out that these stars change their size, color and luminosity in a periodic manner. The diagram below shows a rough approximation of the relationships.
Why do the stars grow and shrink? Hmmm. The answer might make more sense if we first consider a more familiar situation -- a pot of water with a lid, full of water, sitting on a hot stove.
What happens as the water starts to boil?(Click the picture to find out)

As water turns into steam, it presses against the walls of its container. The pressure pushes the lid upwards, against the force of gravity. But when the lid rises high enough to expose a gap through which the steam can escape, the pressure inside the pot drops suddenly. As a result, the lid falls back into place, and the cycle begins anew.
In a way, the same cycle happens inside certain types of stars. Stars don't have REAL lids, of course ... but under certain circumstances, they can contain a sort of lid. It all boils down (hah!) to the interaction of light with atoms.
Ordinary hydrogen, for example, consists of a negative electron attached to a positive proton. The result is a neutral atom.
If a photon of ordinary visible light impinges on this atom, it will very probably pass right through it.
Deep inside some stars, the conditions --- temperature, pressure, chemical composition, electron density --- allow a variety of hydrogen to form: the negative hydrogen ion.
It turns out that the second electron in this ion makes the ion much more likely to interact with passing photons.

So, let's consider a star which has a layer somewhere in its interior which is rich in negative hydrogen ions (or negative helium ions, which behave in a similar manner).
If we zoom in on that region, we see that photons can't pass through it easily. On their way out from the center of the star into space, many of the photons are absorbed by ions. The collisions push the ions in this layer outwards, away from the hot center of the star.
(Click the image to see what happens)
As a result of this instability, the outer layers of the star expand and cool, then contract and heat up, and the star shrinks and grows in brightness.
Which stars suffer from this sort of instability in their outer atmospheres? It turns out that conditions are right only for a relatively small fraction of all stars; most do NOT pulse in any significant manner.
Enough with the theory of stellar interiors. How does this help us to measure distances?
One type of stars, called RR Lyrae stars, form a very homogenous group. They all have roughly the same mass, the same (average) size, the same (average) temperature, and so approximately the same (average) luminosity. This luminosity turns out to be high enough to make them visible throughout our own Milky Way Galaxy, as well as in some of the nearest neighbors of the Milky Way.
Most RR Lyrae stars are relatively old and have masses somewhat less than that of the Sun; ranging from about 0.5 to 0.7 solar masses. They sit in a region of the HR diagram called the instability strip, above the main sequence and at moderate temperature.
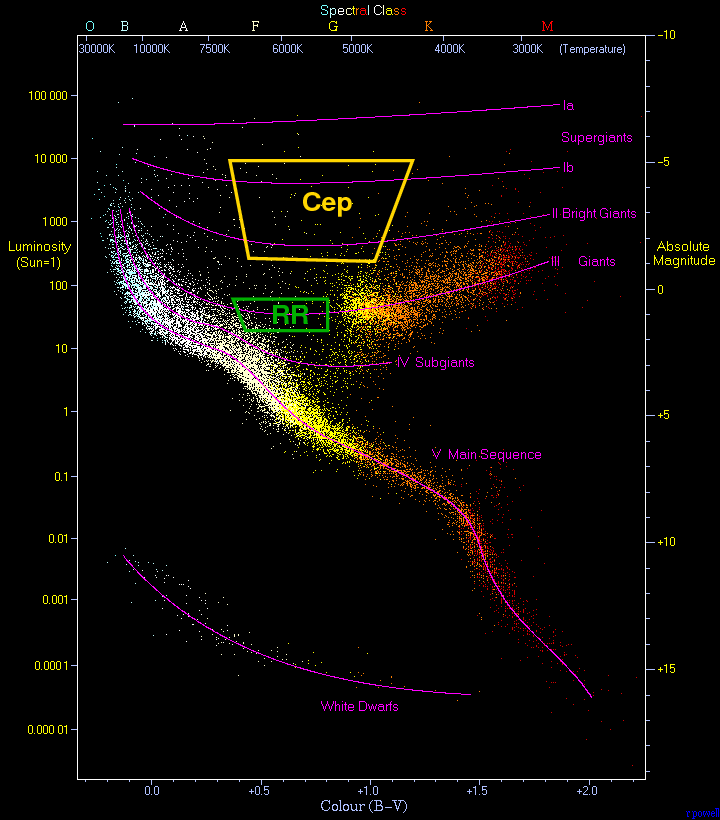
Background image of HR diagram courtesy of
www.anzwers.org
Here's a closeup of the RR Lyrae region in the globular cluster M3, with evolutionary tracks showing the paths of stars with masses ranging from 0.58 to 0.80 solar masses (with the lower-mass models at left).
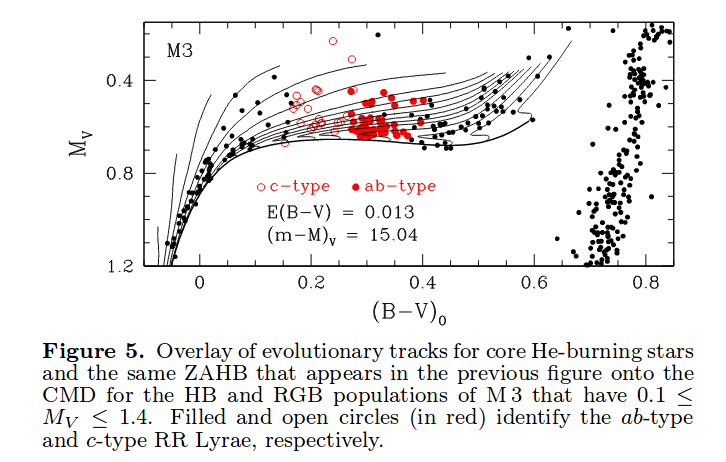
Figure 5 taken from
VandenBerg, Denissenkov and Catelan, ApJ 827, 2 (2016)
RR Lyrae stars are easy to find, because their periods are short -- just 9 to 18 hours or so -- and the amplitude of their variations is large: up to 1 magnitude! You can easily pick out the RR Lyrae stars in this "movie" of M3, which uses images taken during a single night:
Image courtesy of
Joel Hartman and Kristoff Stanek
Now, to a rough approximation, all RR Lyrae stars have the same luminosity, which makes it very easy to use them as rough distance indicators:
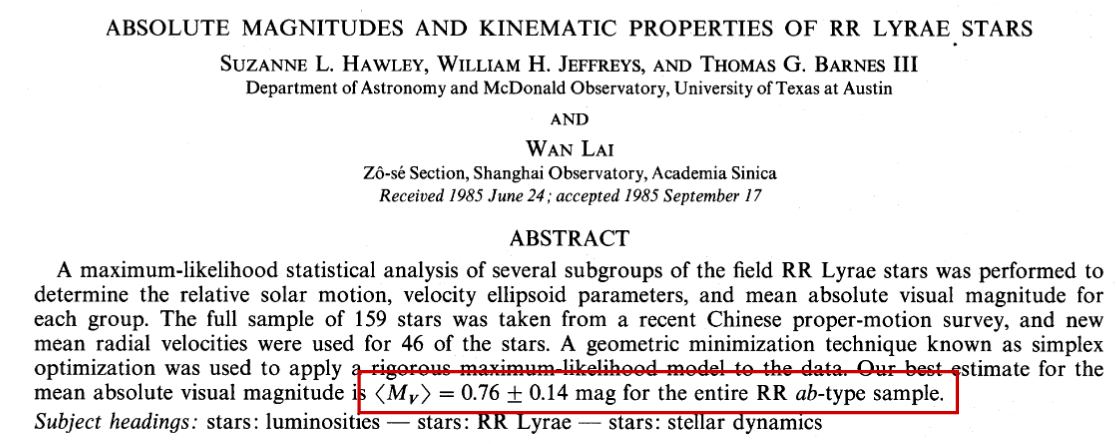
Abstract of the paper
Hawley et al., ApJ 302, 626 (1986)
Let's try out this simple method! Bonanos et al. AJ 127, 861 (2004) provide light curves for RR Lyrae stars in a small galaxy called "the Draco Dwarf Spheroidal Galaxy", a member of our Local Group.


Q: How far from us is the Draco dwarf spheroidal galaxy?
   Bonanos et al. (2004) derived a distance of

             d   =  75.8  +/- 5.4  kpc

   to the Draco dwarf galaxy.  How does your value compare to theirs?
If you look more closely at the RR Lyrae stars, however, you will see small differences between them.
For example, measurements of 70 RR Lyrae in the LMC show this trend in K-band apparent magnitude:
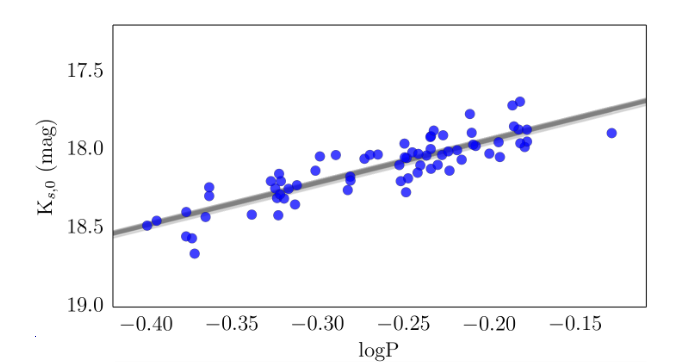
Taken from Figure 2 in
Muraveva et al., ApJ 807, 127 (2015)
which is mirrored closely by a set of 23 RR Lyrae measured within our own Milky Way:
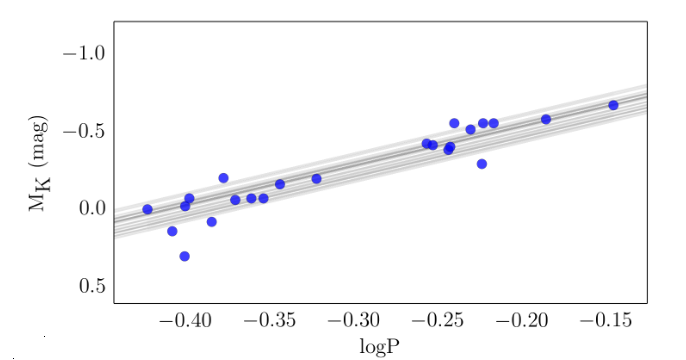
Taken from Figure 3 in
Muraveva et al., ApJ 807, 127 (2015)
If you look even MORE closely, you'll see that the class of "RR Lyrae" stars can be divided into several sub-classes: the RRa and RRb stars, often grouped together into RRab, which have the classic asymmetrical light curve shapes and periods of 12 to 17 hours; and the RRc stars which have more sinusoidal light curves and somewhat shorter periods.
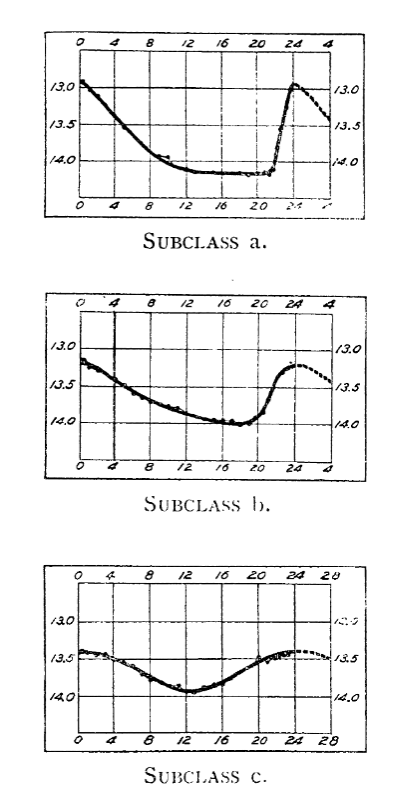
Taken from Plate VII of
Bailey, S. I., Annals of the Astronomical Observatory of Harvard College,
vol 38 (1902)
Within each group, we see again that stars with longer periods have slightly high luminosities.
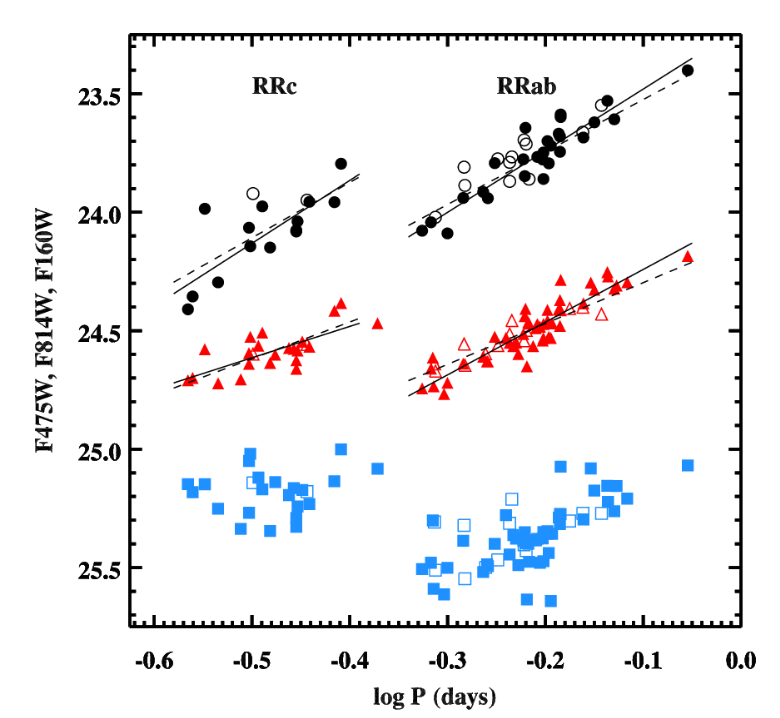
Figure 8 taken from
Hatt et al., arXiv:1703.06468 (2017)
So, if you want to make the best distance measurements using RR Lyrae stars, you will need to account for both the period and chemical composition of the stars in your sample. If you do, the payoff could be big: Neeley et al., arXiv:1705.01970 (2017) suggest that if one properly takes into account the period and metallicity of a star (and the extinction along the line of sight), then one can predict its mid-infrared absolute magnitude with an uncertainty of only 0.02 magnitudes!
Another class of stars, called Cepheid variable stars, takes a bit more work to use as a distance indicator. Cepheids are not even close to identical to each other: they span a very wide range of masses and luminosities. However, as an astronomer named Henrietta Leavitt discovered long ago, there's a connection between the period of a Cepheid variable star and its luminosity.
This figure taken from
Leavitt and Pickering's original paper, published in 1912
This period-luminosity relationship becomes even simpler if we take the base-10 logarithm of the luminosity.
This figure taken from
Leavitt and Pickering's original paper, published in 1912
Now, it turns out that there are two populations of stars called "Cepheids", both of which pulse over periods of 1 to 100 days, but which have very different luminosities. I'm going to concentrate on the "classical" or Type I Cepheids, and ignore the Type II Cepheids, in the following discussion; if you want to learn more about the Type II variables, see the papers by by Gingold, MmSAI 56, 169 (1985) and by Wallerstein, PASP 114, 797 (2002) mentioned in the For more information section at the end of this webpage.
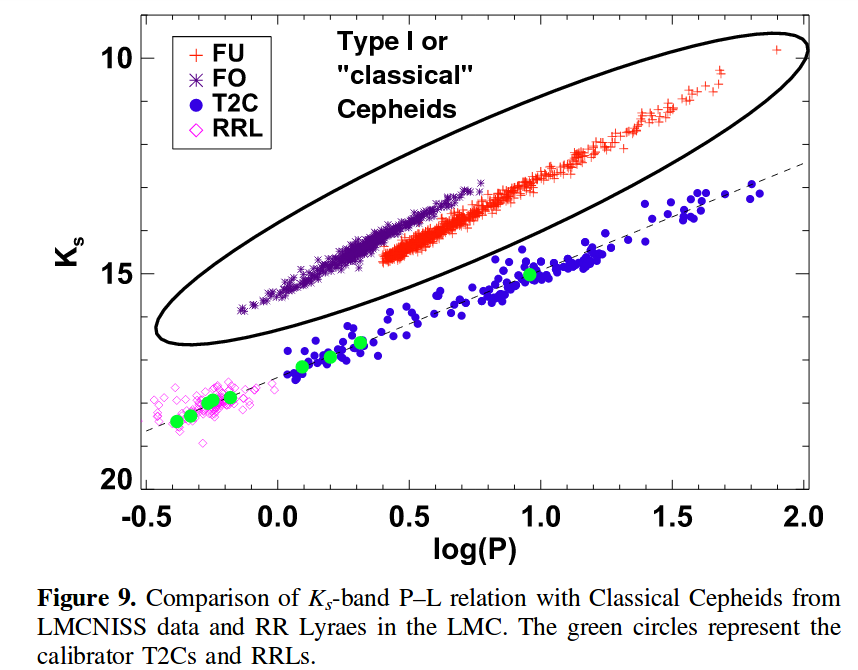
Modified from Figure 9 of
Bhardwaj et al., AJ 153, 154 (2017)
What sort of stars are classical Cepheids? They are relatively massive, and therefore relatively young, stars, which have just run out of hydrogen in their cores and so have evolved off the main sequence and into the red giant branch. However, as their core regions pass through several evolutionary stages, the stars evolve away from the giant region and make "blue loops" into the instability strip, where layers in their outer atmospheres become subject to the kappa instability discussed earlier.
Background image of HR diagram courtesy of
www.anzwers.org
Let's look at a small sample of Cepheids in a cluster within the Large Magellanic Cloud. The figure below shows the location of the Cepheids in the HR diagram, and it shows evolutionary tracks for stars of several ages. The different colors represent models with different versions of convection in the stellar atmosphere. Note how the models first reach the red giant branch (RGB), then make a "blue loop" and pulse as Cepheids, before returning to the asymptotic giant branch (AGB). The models suggest that the stars which are currently Cepheids have masses of about 4.2 solar masses.
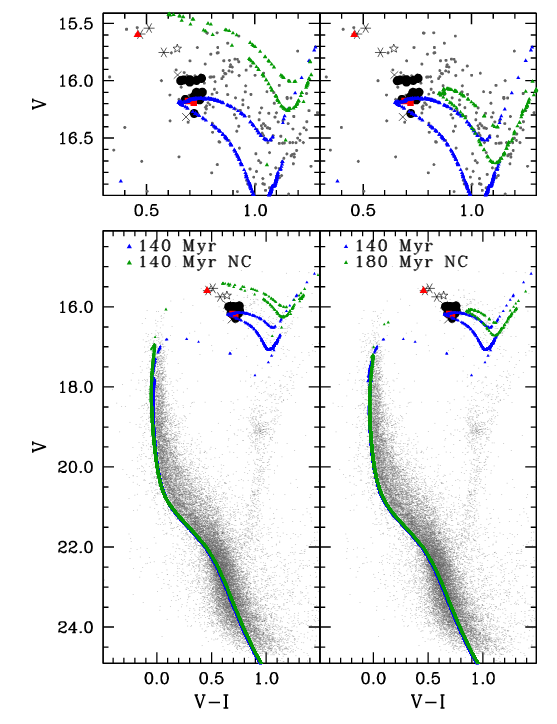
Figure 8 taken from
Musella et al., MNRAS 457, 3084 (2016)
Here's a closeup of the Cepheid region of the HR diagram for a larger set of Cepheids in the Small and Large Magellanic Clouds.
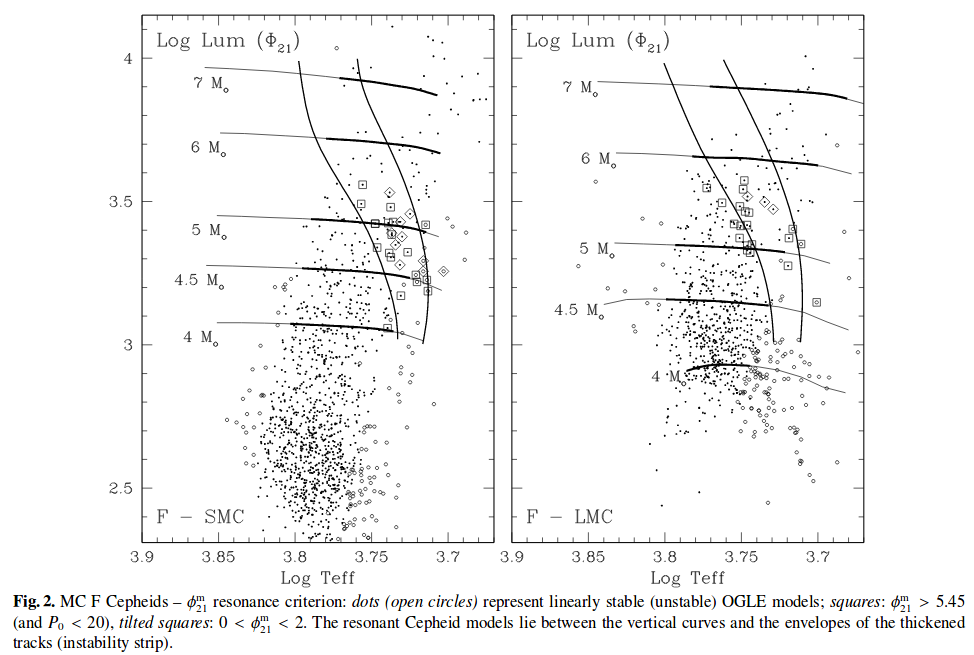
Figure 2 from
Buchler, Kollath, and Beaulieu, A&A 423, 643 (2004)
How can one use Cepheids to determine the distance to a cluster, or a galaxy? The basic procedure sounds pretty simple, but there are many complications in real life.
| Step | Complication(s) |
|---|---|
| Make repeated measurements of brightness of many stars | There can be hundreds or thousands of ordinary stars for each Cepheid |
| Identify those which have Cepheid-like light curves | Amplitude of variation is largest in blue, as shown in Fig 12 of Gaia Collaboration, arXiv:1705.00688 (2017), but extinction is most severe in blue |
| Measure the period P and apparent magnitude m of the Cepheids | Requires multiple epochs over many weeks or months to measure period properly |
| Use a period-luminosity (PL) or period-luminosity-color (PLC) relationship to determine the luminosity of each Cepheid | Requires multiple passbands of photometry to compute color; and spectroscopy to measure and correct for metallicity |
| Use the apparent magnitude and luminosity to calculate the distance | Must correct for extinction (easiest in infrared) and crowding (difficult in external galaxies) |
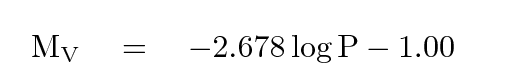
Well, let's skip over most of the complicated stuff and give this a try. We'll adopt a period-luminosity relationship from Gaia Collaboration, arXiv:1705:00688 (2017) (we will ignore the metallicity effects):
So, let's try to estimate the distance to a nice, nearby spiral galaxy.
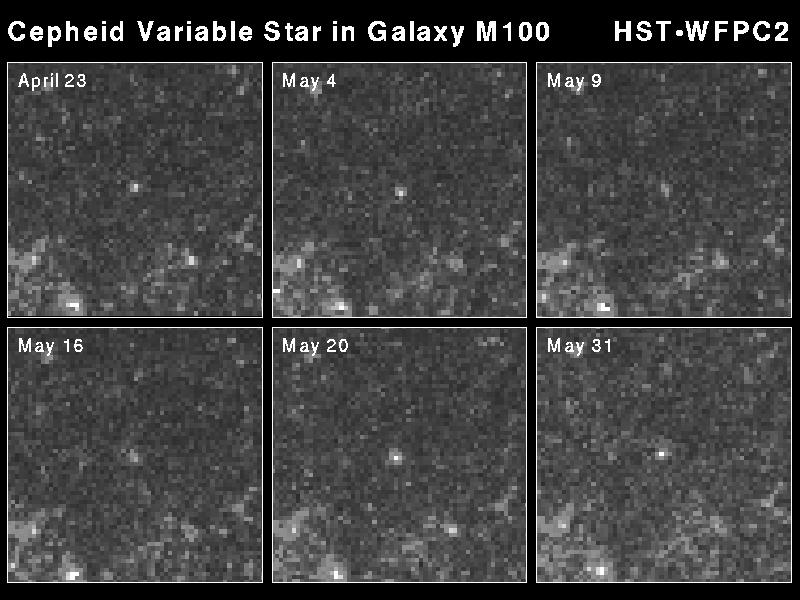
In the figure below, use the symbols marked with filled black circles, which are V-band measurements.
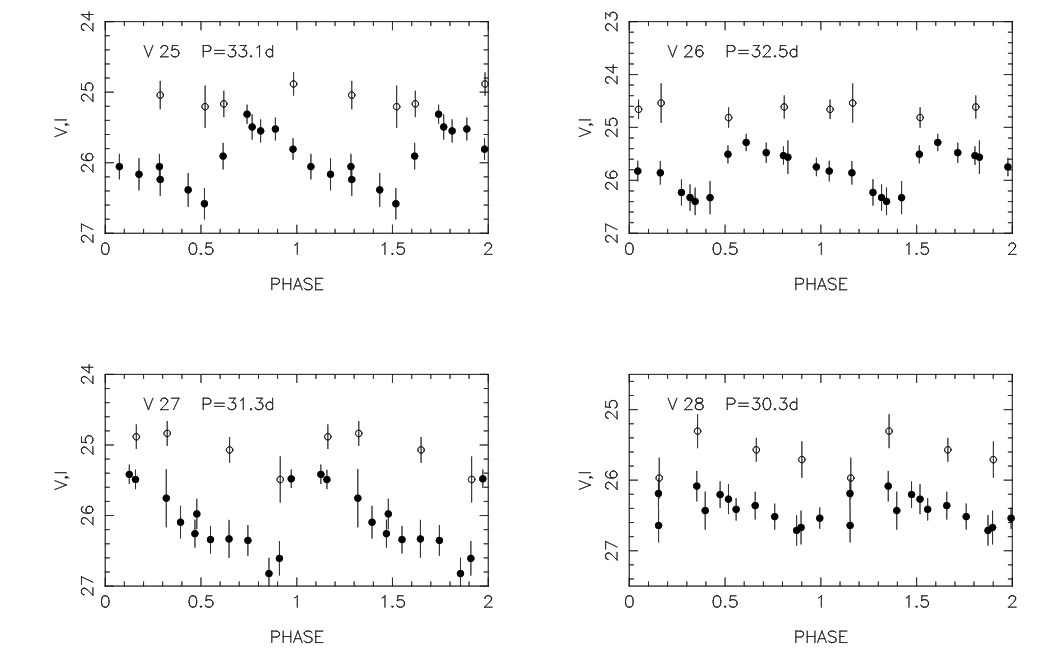
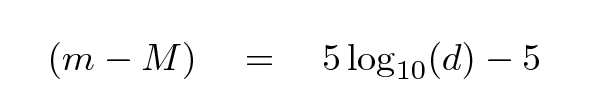
  1.   Pick one variable star.  Measure its average V-band magnitude.

  2.   Use its period to determine its absolute magnitude.

  3.   Compute the distance modulus (m - M)

  4.   Compute the distance to this galaxy, in Mpc
How does you answer compare to that of the authors of the paper from which this data was taken?
  Q:  Was your distance smaller or larger than the authors' value?


  Q:  What could explain that difference?
Let's go back and compare these two useful varieties of variable stars. Look again at their locations in the HR diagram:
Background image of HR diagram courtesy of
www.anzwers.org
The location of the stars in this diagram gives us strong hints about the differences between them. I'll summarize the important points for you.
| RR Lyr | classical Cepheids | |
|---|---|---|
| luminosity | less luminous: Mv ~ +0.6 | more luminous: Mv ~ -3 to -5 |
| mass | less massive: about 0.6 solar | more massive: 3 to 7 solar |
| age | old: approx 10 billion years | young: 50 to 600 million years |
| population | Pop II | Pop I |
| habitat | mostly halo (spirals and ellpticals) | disk (spirals) |
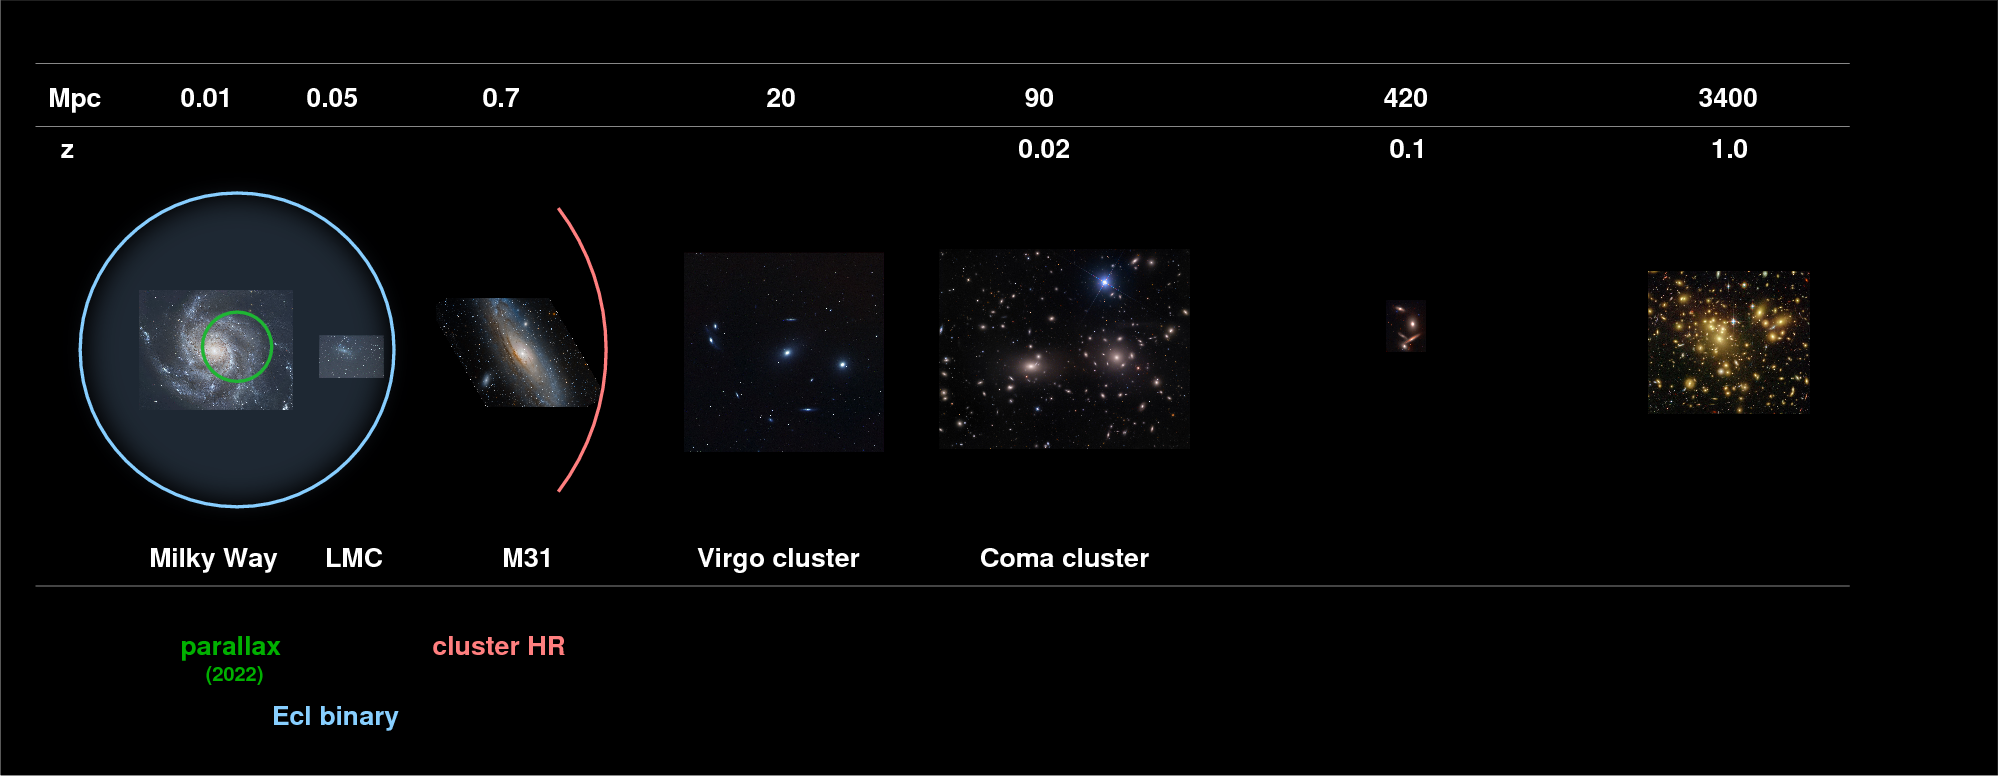
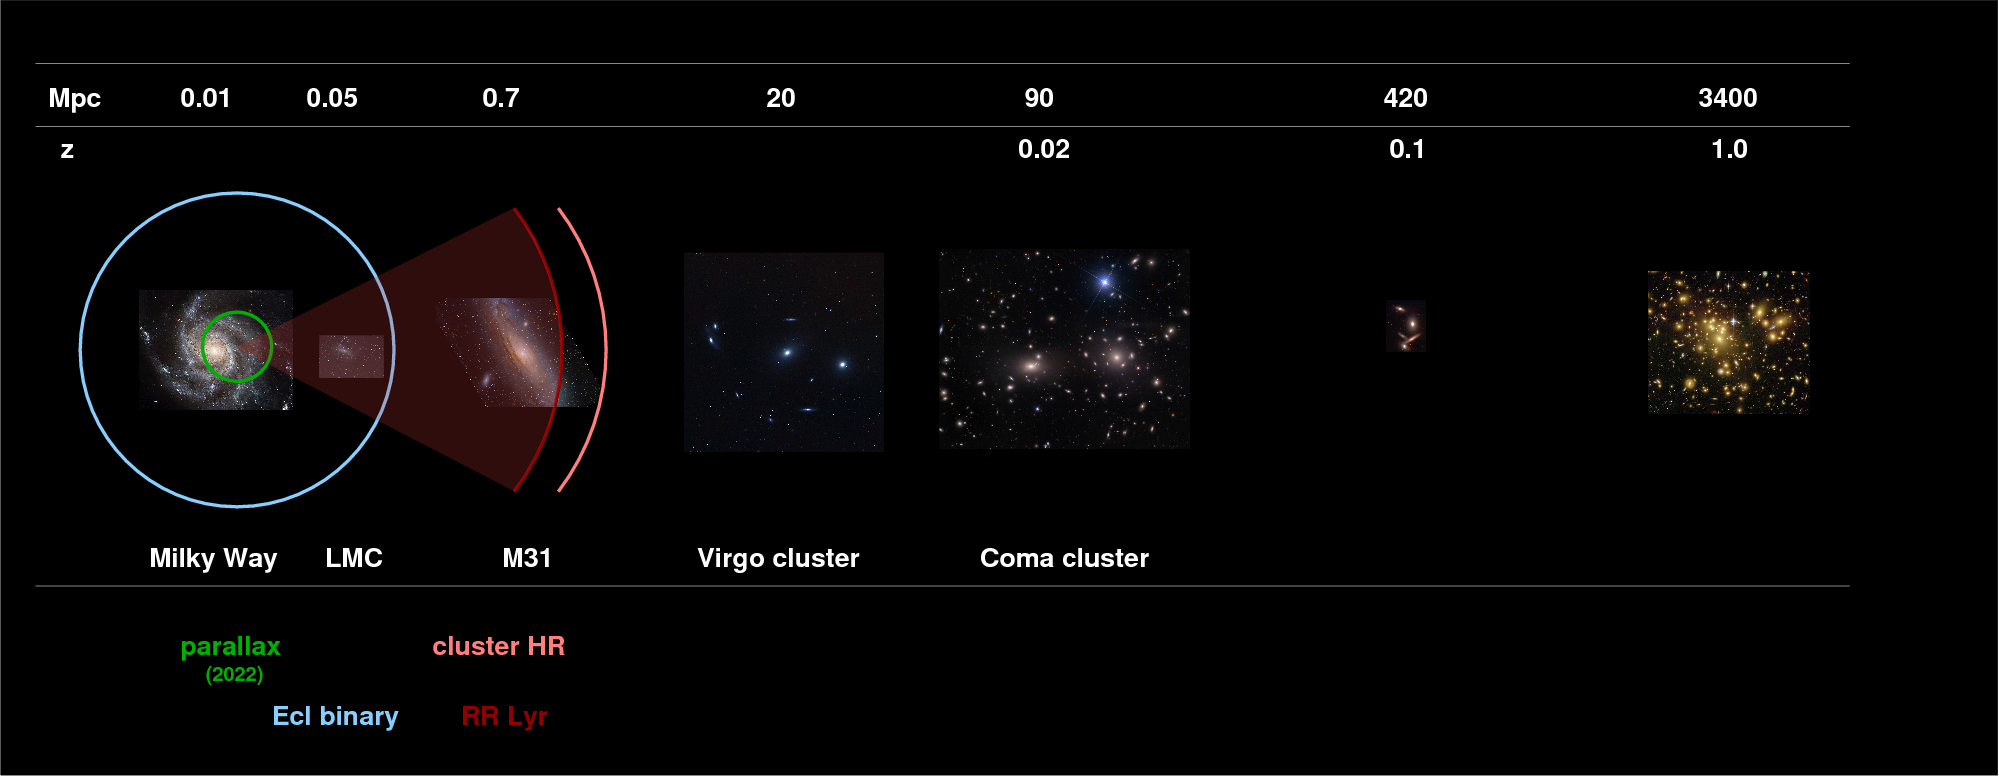
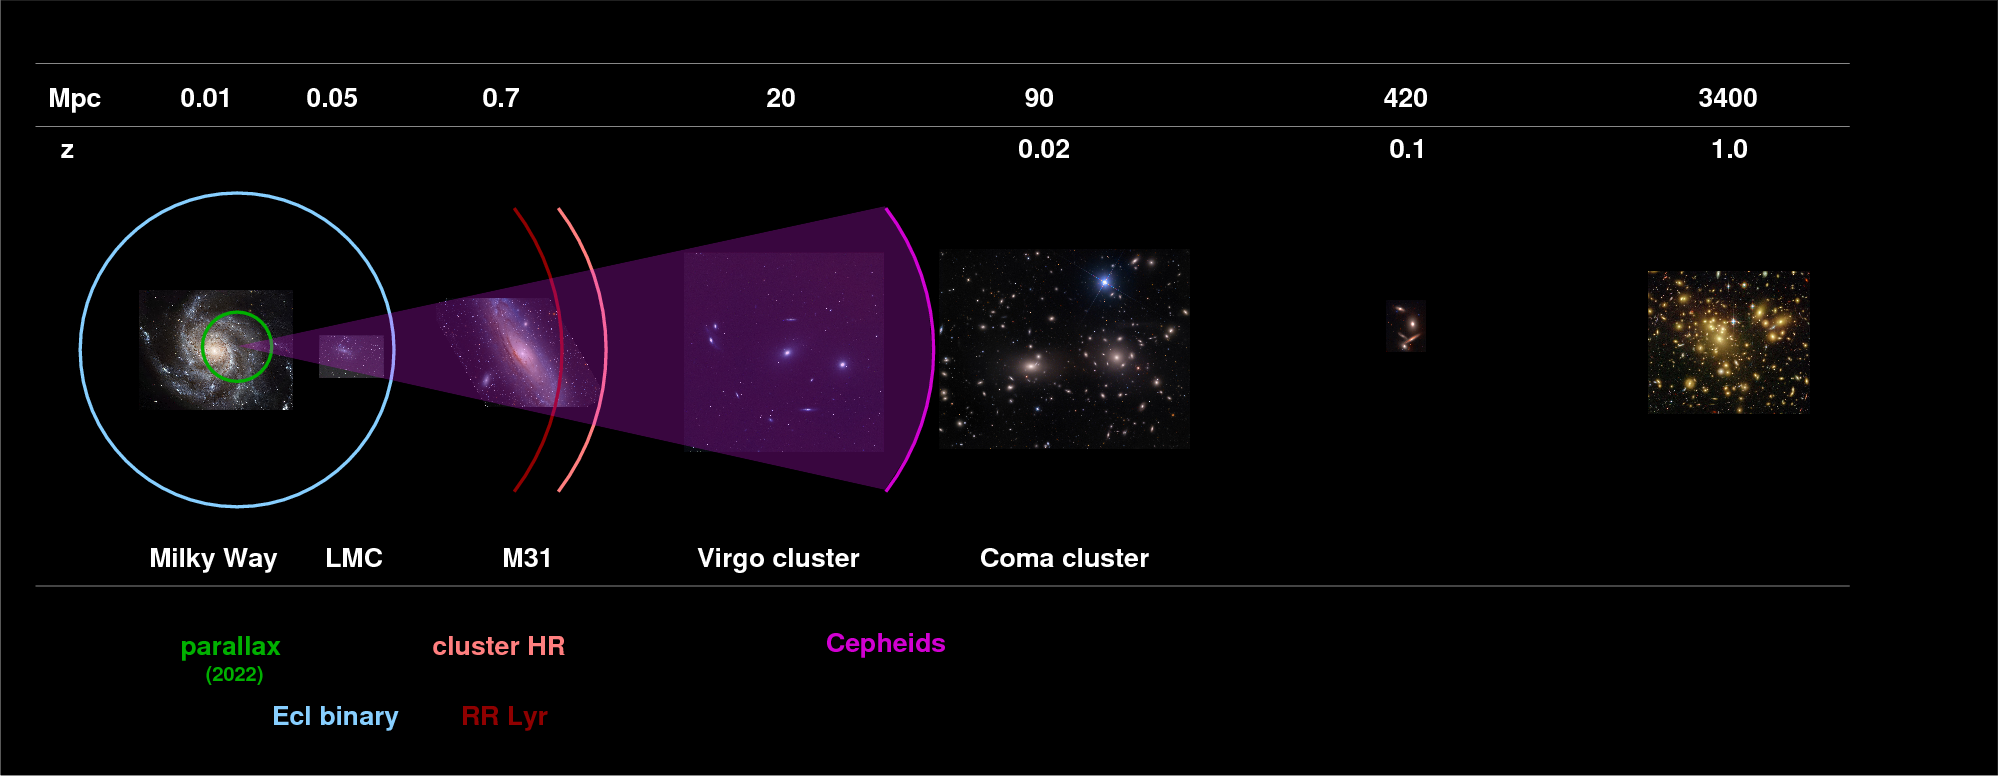
| useful range | Local Group (approx 1 Mpc) | Virgo and Coma? clusters (approx 30-100? Mpc) |
RR Lyrae stars are great for distance measurements within our Milky Way Galaxy, and to our nearest neighbors. Because they belong to the older, halo population, one can find them in just about all galaxies; moreover, one can look far away from bright star-forming regions and their associated clouds of gas and dust, making it relatively easy to measurement their brightness. But their relatively low luminosities mean that we can't measure them accurately very far beyond the Milky Way.
Cepheids, on the other hand, CAN be seen at great distances, at least as far as the Virgo Cluster and perhaps as far as Coma though the existing work seems incomplete. Using them in external galaxies requires quite a bit of hard work and some estimation, if one wants to make the proper metallicity corrections, since it's not possible to measure directly the composition of Cepheids in galaxies beyond the Local Group at the the current time. There are also issues involving the crowding of other stars into a photometric aperture when one measures Cepheids in other galaxies. Still, they provide a good way to add a rung to the distance ladder, well beyond our Local Group.
The Large Magellanic Cloud serves as an important step in the ladder, because it is close enough for us to use a number of different methods to determine its distance, yet far enough away that objects in it are (almost) at a single common distance. Astronomers have studied the RR Lyr and Cepheid variables in the LMC in great detail. In many cases, we have ASSUMED a distance to the LMC, and used that assumption to determine the absolute magnitudes of both RR Lyr and Cepheid stars. For example,
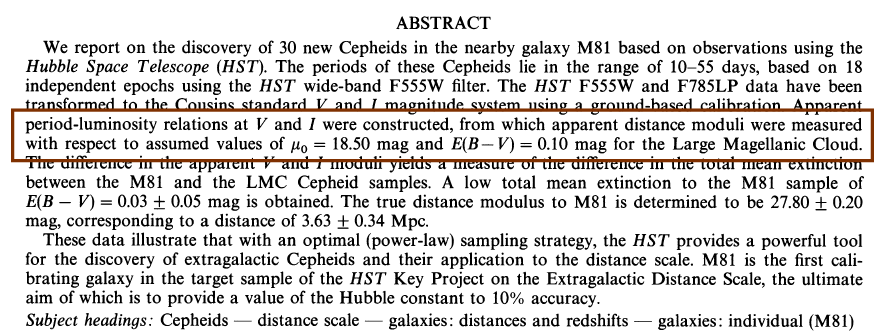
Abstract taken from
Freedman et al., ApJ 427, 628 (1994)
But -- but -- but -- when Gaia finishes its survey, we will finally have solid, direct trigonometric distances to many RR Lyr and Cepheids. That means we will
This is an exciting moment for cosmologists: the second rung of the distance ladder is about to be re-built, stronger than before. Preliminary results recently published in
suggest the current uncertainties in the distance to this stepping-stone into the larger universe. Note the good agreement with the distance derived via eclipsing binaries by Pietrzynski et al., Nature 495, 76 (2013), which is shown by the vertical line.
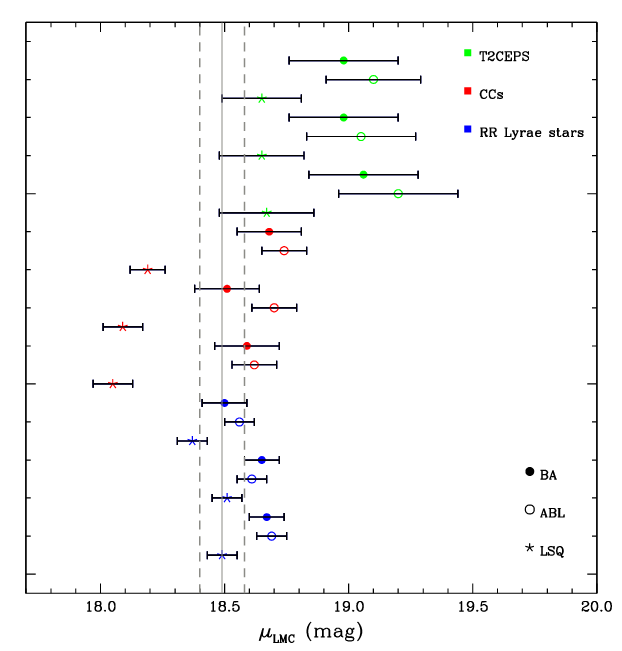
Figure 25 taken from
Gaia Collaboration, arXiv:1705.00688 (2017),
Copyright © Michael Richmond.
This work is licensed under a Creative Commons License.