 Copyright © Michael Richmond.
This work is licensed under a Creative Commons License.
Copyright © Michael Richmond.
This work is licensed under a Creative Commons License.
Contents
As you may recall from an earlier lecture in this series, one technique astronomers can use involves making a color-magnitude diagram of stars in some cluster. All the stars in a cluster should have been born at about the same time, and from the same material, so they ought to evolve in a predictable manner.
Watch a single star evolve on HR diagram
Watch many stars in a cluster evolve
The color of stars which are just leaving the main sequence can be matched to models of stellar evolution, telling us the absolute magnitude of those stars. Then, we can compare the absolute magnitude and the apparent magnitude to derive the distance, using
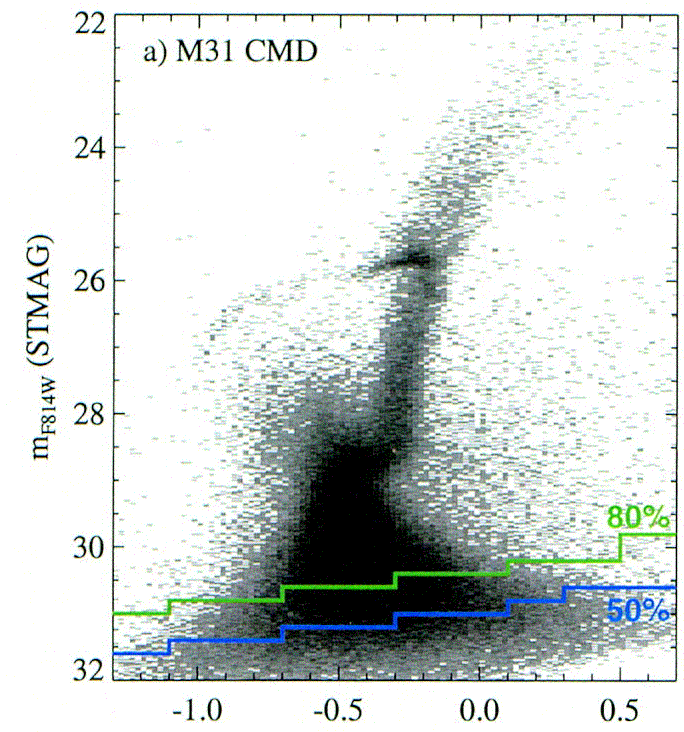
We can distinguish individual stars in SOME nearby galaxies well enough to make a color-magnitude diagram reaching down to the turnoff point. For example, if we use the Hubble Space Telescope to take long exposures of the Andromeda Galaxy,
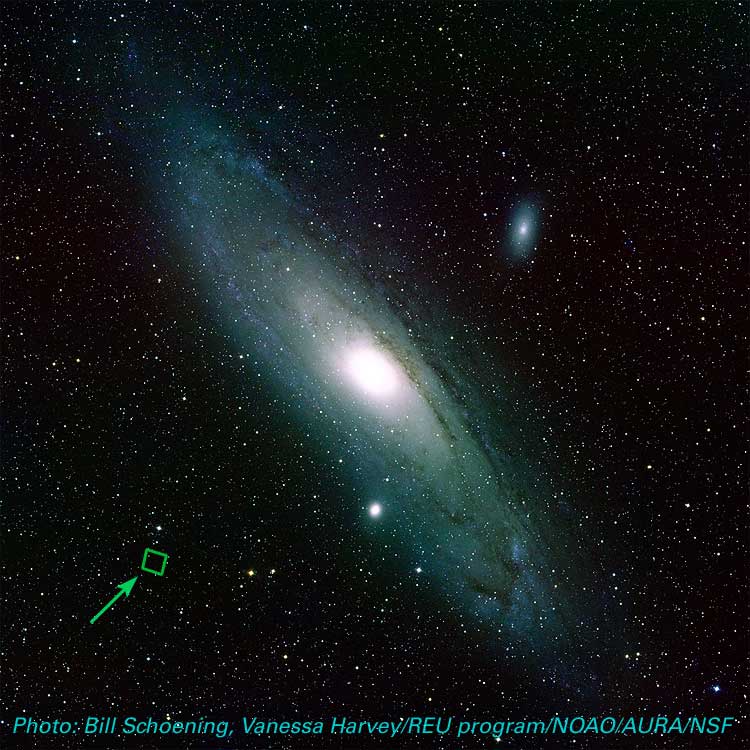
and zoom in on one tiny little region

we can make a color-magnitude diagram of the stars in the halo of the Andromeda Galaxy.
And here is a color-magnitude diagram of stars from a series of models:
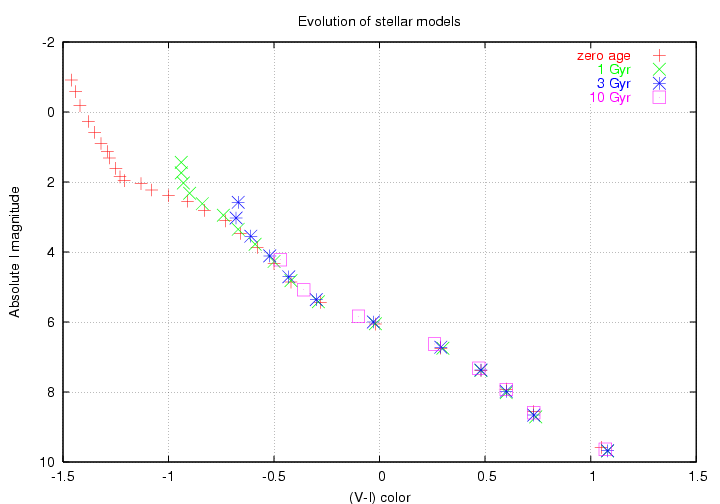
Use the main-sequence turn-off point from the observed cluster to figure out
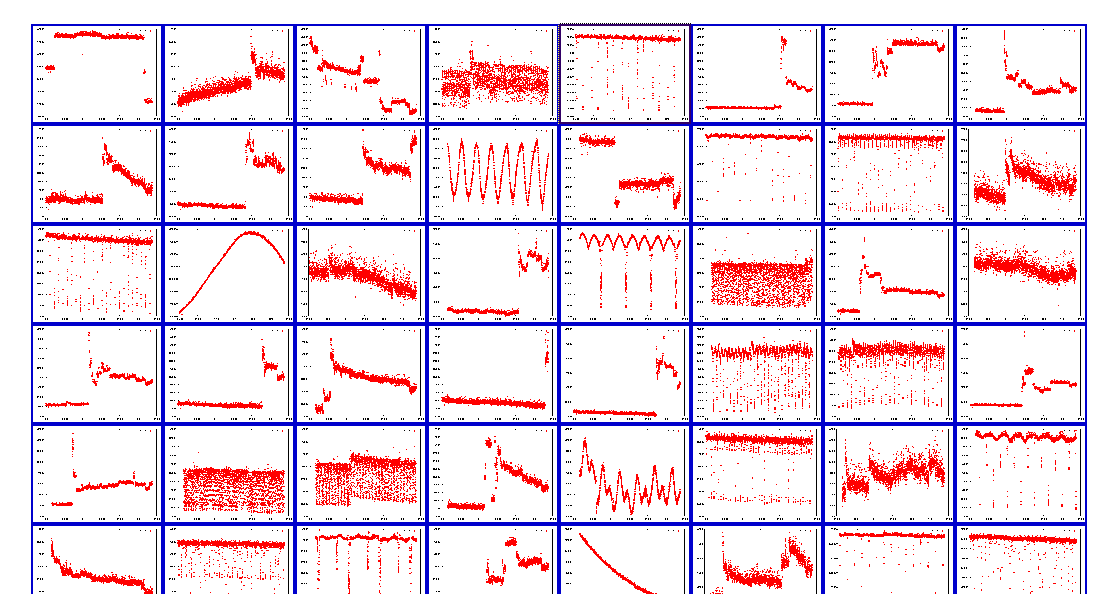
There are many stars which vary in brightness over timescales of hours, days, weeks, or even months. Below is a small sample of variable stars observed by the COROT satellite ; the data became public in the last few weeks, and Thomas Womack put together a web page with thumbnails of some of the most obviously variable stars.
There are many reasons why the brightness of a star might change over time:
Let's take a closer look at stars in that final category: pulsating variables. Many of these stars have a similar type of light curve: one which rises quickly in brightness, then fades more slowly.

Taken from
Bonanos et al., 2004AJ....127..861B

Taken from Musella et al., 2006MmSAI..77..291M
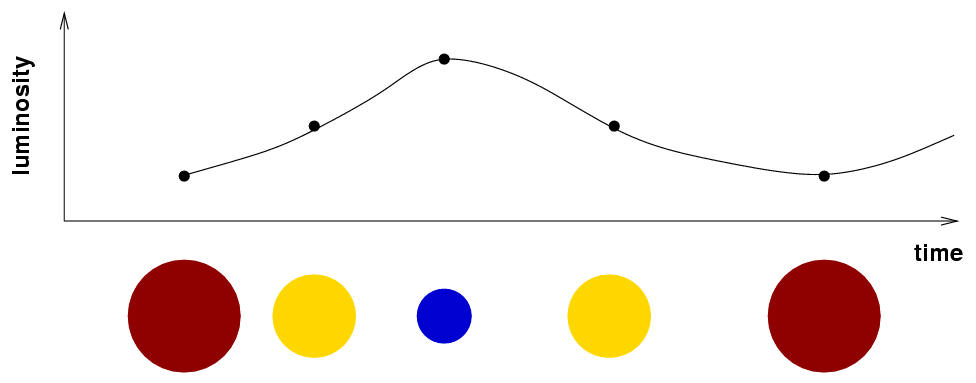
It turns out that these stars change their size, color and luminosity in a periodic manner. The diagram below shows a rough approximation of the relationships.
Why do the stars grow and shrink? Hmmm. The answer might make more sense if we first consider a more familiar situation -- a pot of water with a lid, full of water, sitting on a hot stove.
What happens as the water starts to boil?(Click the picture to find out)
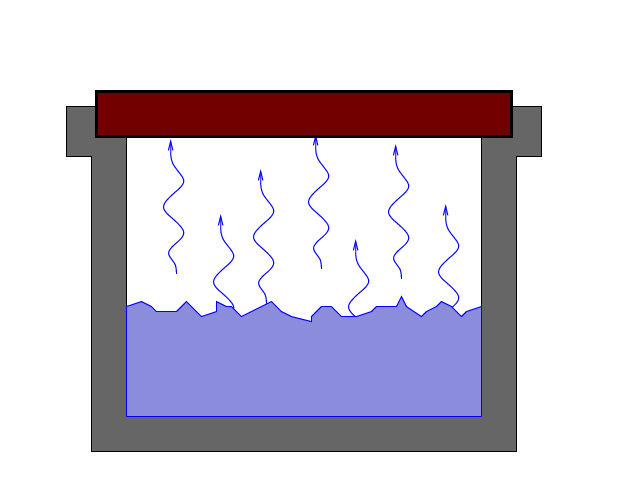
As water turns into steam, it presses against the walls of its container. The pressure pushes the lid upwards, against the force of gravity. But when the lid rises high enough to expose a gap through which the steam can escape, the pressure inside the pot drops suddenly. As a result, the lid falls back into place, and the cycle begins anew.
In a way, the same cycle happens inside certain types of stars. Stars don't have REAL lids, of course ... but under certain circumstances, they can contain a sort of lid. It all boils down (hah!) to the interaction of light with hydrogen atoms.
Ordinary hydrogen consists of a negative electron attached to a positive proton. The result is a neutral atom.
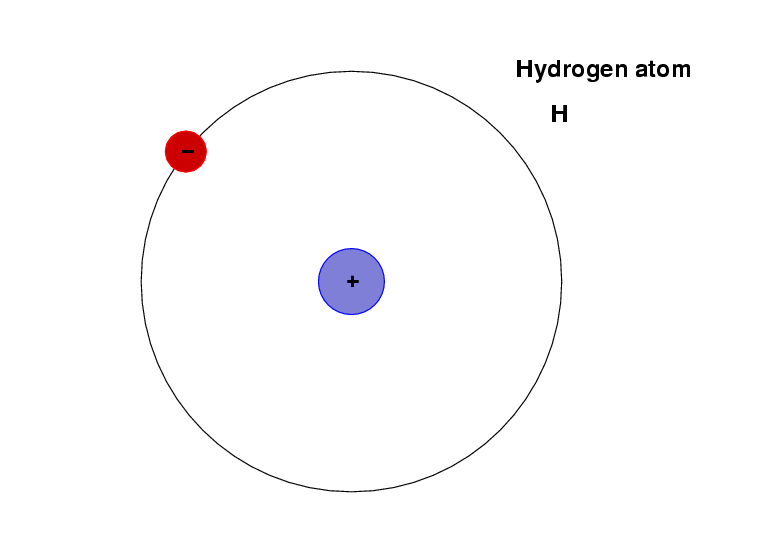
If a photon of ordinary visible light impinges on this atom, it will very probably pass right through it.

Deep inside some stars, the conditions --- temperature, pressure, chemical composition, electron density --- allow a variety of hydrogen to form: the negative hydrogen ion.
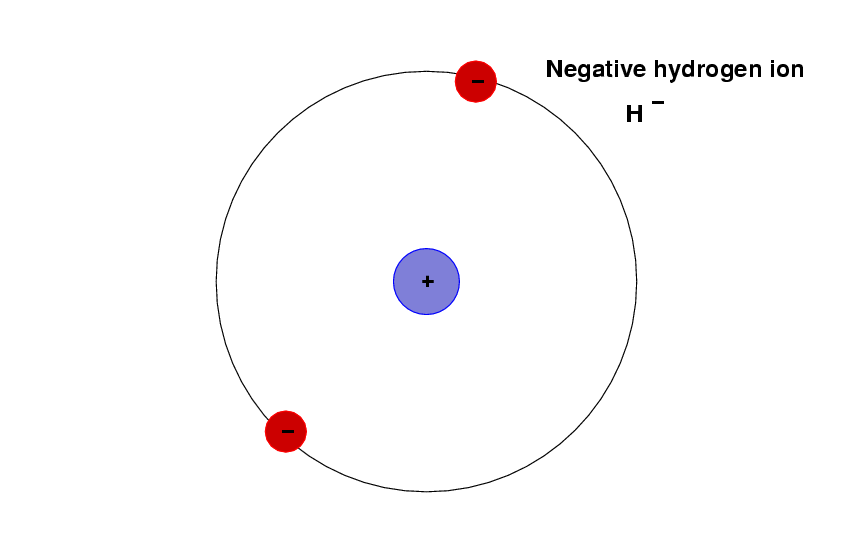
It turns out that the second electron in this ion makes the ion much more likely to interact with passing photons.
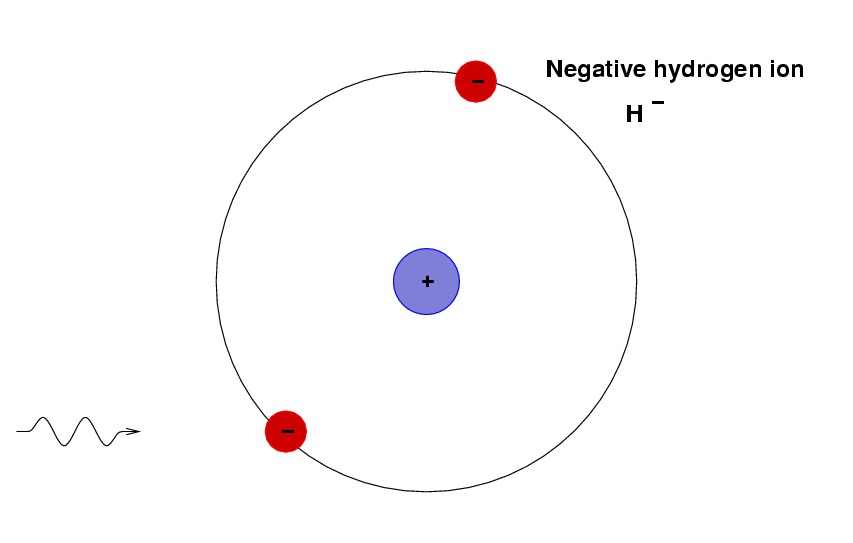
So, let's consider a star which has a layer somewhere in its interior which is rich in negative hydrogen ions (or negative helium ions, which behave in a similar manner).
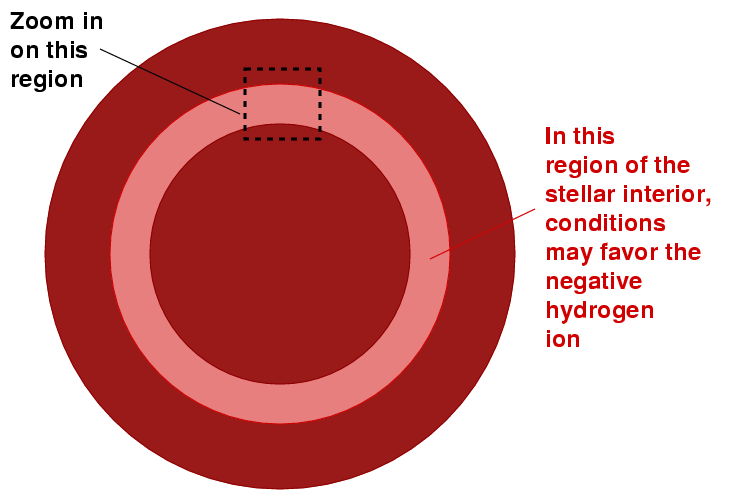
If we zoom in on that region, we see that photons can't pass through it easily. On their way out from the center of the star into space, many of the photons are absorbed by ions. The collisions push the ions in this layer outwards, away from the hot center of the star.
(Click the image to see what happens)
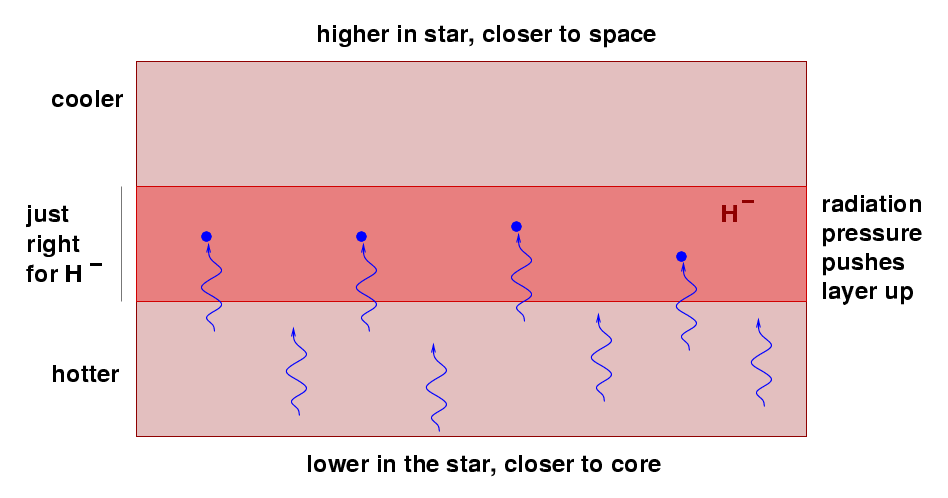
As a result of this instability, the outer layers of the star expand and cool, then contract and heat up, and the star shrinks and grows in brightness.
Enough with the theory of stellar interiors. How does this help us to measure distances?
One type of stars, called RR Lyrae stars, form a very homogenous group. They all have roughly the same mass, the same (average) size, the same (average) temperature, and so the same (average) luminosity. This luminosity turns out to be high enough to make them visible in some of the nearest neighbors of the Milky Way.
RR Lyrae stars: (average) absolute mag Mv = +0.6
These stars are easy to recognize: their periods are just a bit longer than half a day.
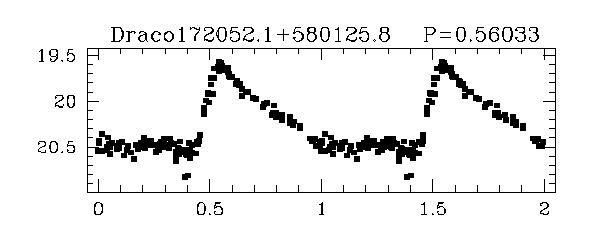
For example, here are the light curves of four stars from a small galaxy called "the Draco Dwarf Spheroidal Galaxy", a member of our Local Group.
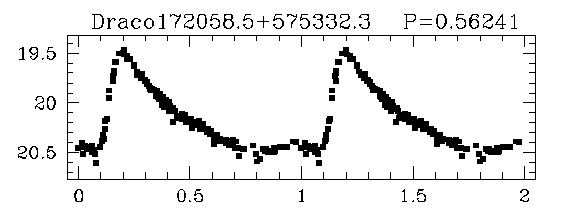
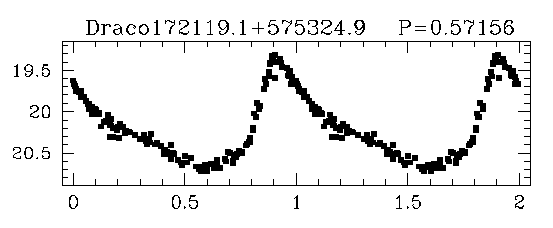
Q: How far from us is the Draco dwarf spheroidal galaxy?
Another class of stars, called Cepheid variable stars, takes a bit more work to use as a distance indicator. Cepheids are NOT identical to each other: they span a wide range of masses and luminosities. However, as an astronomer named Henrietta Leavitt discovered long ago, there's a connection between the period of a Cepheid variable star and its luminosity.
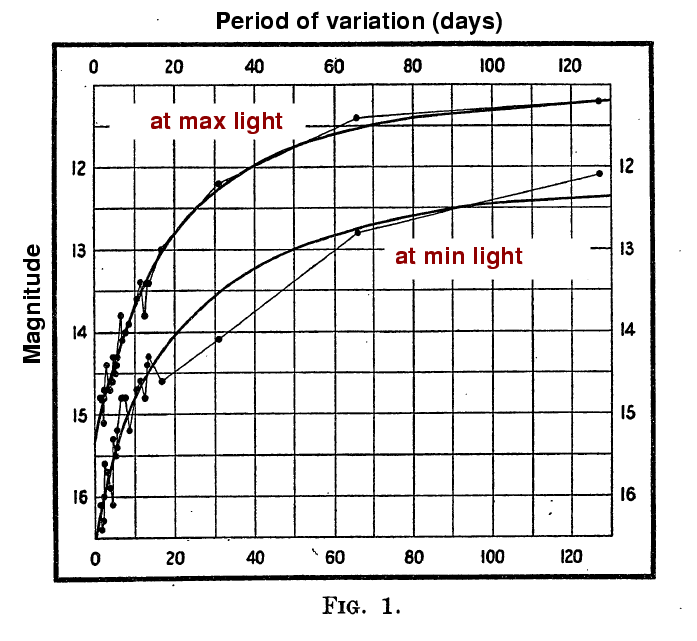
This figure taken from
Leavitt and Pickering's original paper, published in 1912
This period-luminosity relationship becomes even simpler if we take the base-10 logarithm of the luminosity.
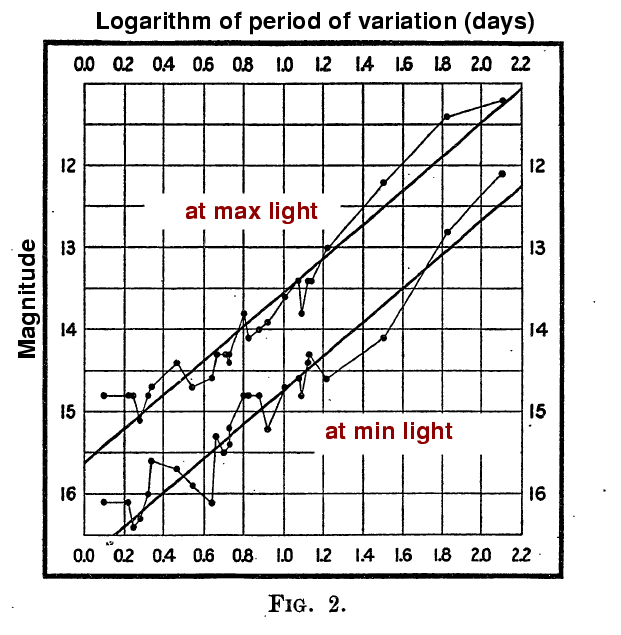
This figure taken from
Leavitt and Pickering's original paper, published in 1912
We can use these (or more recent) measurements to define an equation which yields the absolute magnitude for a Cepheid of any period:
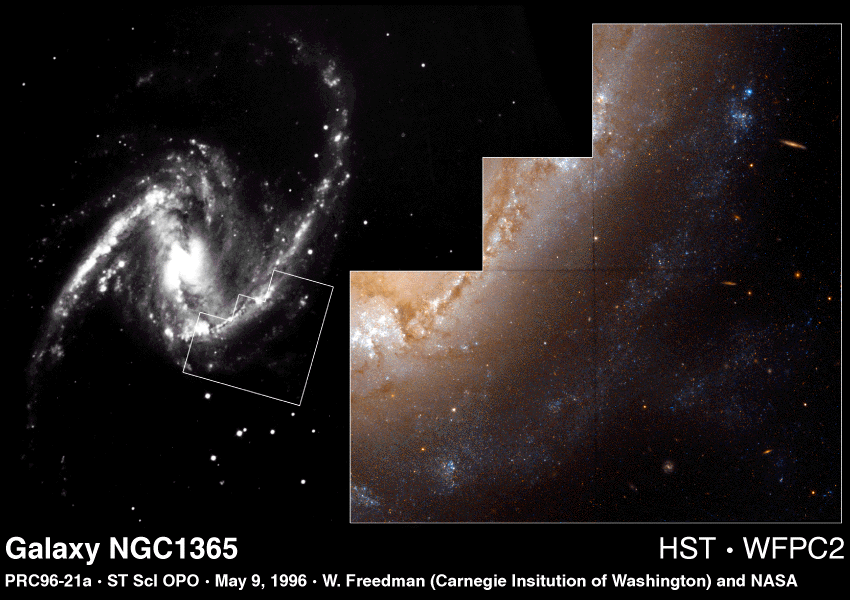
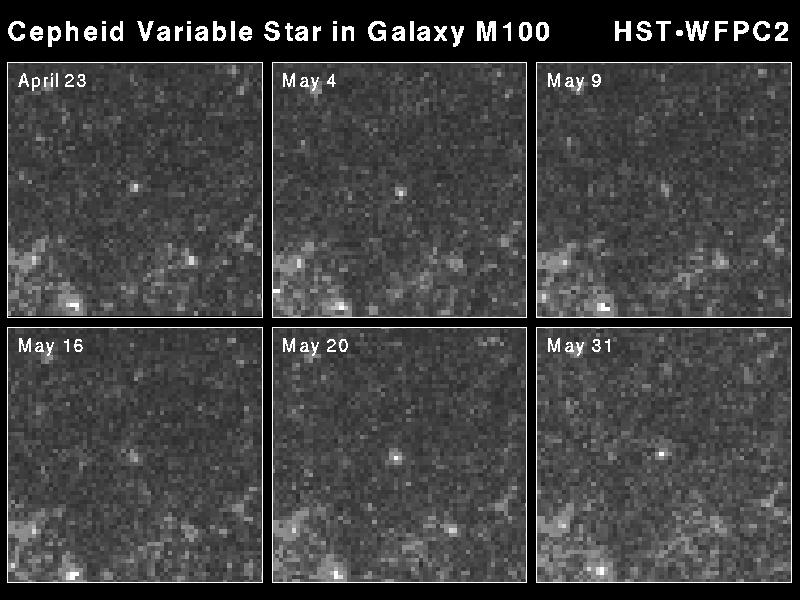
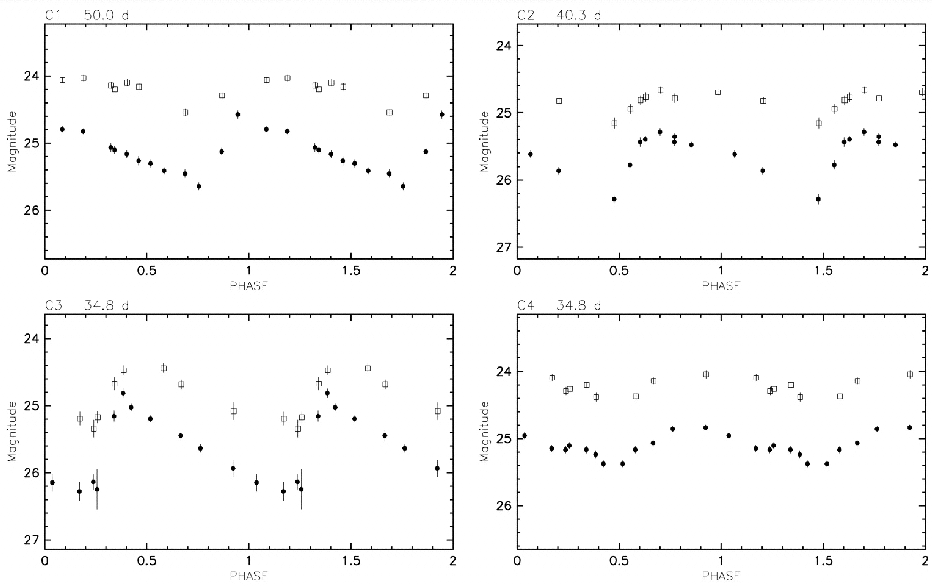
So, let's try to estimate the distance to a nice, nearby spiral galaxy.

Copyright © Michael Richmond.
This work is licensed under a Creative Commons License.