Copyright © Michael Richmond.
This work is licensed under a Creative Commons License.
Copyright © Michael Richmond.
This work is licensed under a Creative Commons License.
So, once we acquire the spectrum of an object, what can we do with it? Quite a lot, as you will soon see. There are several varieties of spectral analysis:
We'll look at the shape of the continuum today, and focus on the others later this week.
What is the continuum? It's the basic shape of a spectrum over a wide range of wavelengths. Consider this real spectrum of a star:
There are many narrow absorption lines, which (as we shall see tomorrow) can tell us quite a lot about the chemical composition of the stellar atmosphere. However, if we ignore the lines and focus on the overall shape of the spectrum, we find the continuum:
You all know that if you heat a metal object in the coals of a fire, so that its temperature rises to hundreds of degrees Celsius (or Fahrenheit), it will start to glow.

Image courtesy of
How Stuff Works
In the late nineteenth century, physicists noticed that the spectrum emitted by hot objects did not depend on the chemical makeup or the shape of the object; all that mattered was temperature. Max Planck derived a formula for the spectrum of this blackbody radiation.
You don't need to memorize this formula, but you do need to know several features of blackbody radiation. First, the peak of the spectrum depends on the temperature of the object:
If you can identify the wavelength at which an object emits the most energy per unit wavelength (the peak of the spectrum), then you can estimate its temperature very easily:
               2,900,000  nm * K       0.29   cm * K
     Temp  =  -------------------  =  ----------------
               peak wavelength         peak wavelength
Notice that the constant in this formula has different values, depending on the unit you choose to use for wavelength. We will most frequently use nanometers (nm), so the first form is often appropriate.
Now, strictly speaking, this formula applies to certain theoretically ideal bodies: "blackbodies". Can we use it for stars? Let's compare the spectrum of a typical star to these ideal blackbody curves:
Okay! It looks like stars are close enough to blackbodies that we can use this simple rule. In fact, let's try it right now.
  Q:  What is the temperature of the star in the
      figure above?
The answer
Another feature of blackbody spectra is that the overall shape is always the same. This is easier to see if we expand the range of wavelengths far beyond the visible. Suppose we look from the X-ray to the radio, all at once:
Ooops. That's, um, not very helpful. The problem is that the amount of radiation emitted over this wide range of wavelengths changes by factors of more than a million; it just isn't all visible at once on a single plot ...
.... unless, that is, we switch from using a linear representation along each axis to a logarithmic representation. On a log-log plot, we can see everything, all at once:
All three spectra have the same general shape:
In this graph, I have given each spectrum its proper relative scale in the y-direction. You can see that the hottest object emits more radiation (per unit area) at its peak than the cooler ones. In fact, if two bodies are the same size and shape, differing only in temperature, than the hotter one will emit much more energy. Quantitatively, the luminosity L, or power, or energy radiated per second, is
where A is the surface area of the object, σ is the Stefan-Boltzmann constant, and T is the temperature in Kelvin.
  Q:  Joe feels a little cold, so he turns up
      the thermostat on the Sun: its temperature
      rises from T1 = 5600 K to T2 = 6600 K.

      By what factor does the power of the Sun rise?

          a.  about a factor of  10 percent
          b.  about a factor of  20 percent
          c.  about a factor of  40 percent
          d.  about a factor of 100 percent
The answer
Humans have developed eyes which are sensitive to light in a relatively narrow range of wavelengths, from about 400 nm to about 800 nm. We call this the "visible" or "optical" range. It is no coincidence that ordinary stars -- like the Sun -- emit most of their light in this portion of the spectrum.
However, even bodies which are much cooler than the Sun, or much hotter than the Sun, follow the same physical principles. We can use blackbody spectra to approximate the radiation emitted by a very wide range of astrophysical objects.
The object LkHa 234 is surrounded by a dense cloud of gas and dust. Astronomers with radio telescopes have measured the spectrum of this cloud. Can you estimate its temperature?
X-ray astronomers study objects which are very, very hot. Some of them have spectra which are, well, sort of like those of blackbodies. Below is the spectrum of a binary star called Cygnus X-3. Can you determine the temperature of the hot gas in this system?
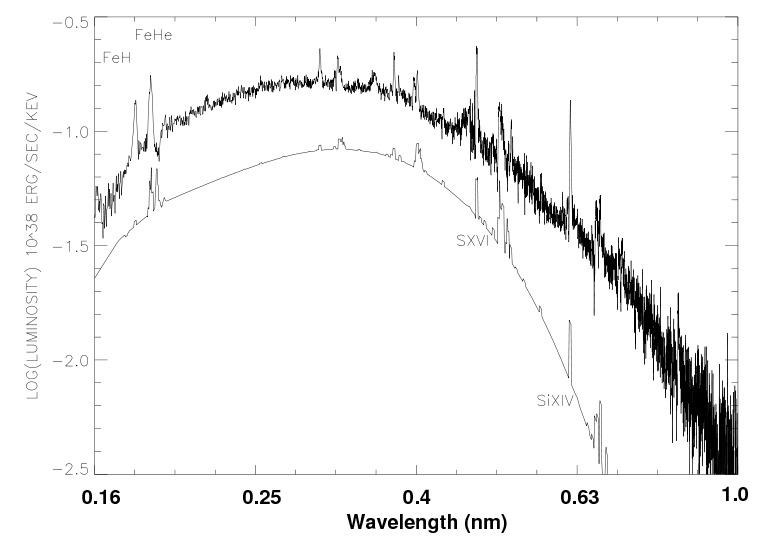
Figure taken from
Vilhu et al., A&A 501, 679 (2009)
Here's a figure from a paper describing the star SS Cygni during one of its outbursts.
The solid black line is the real spectrum; you can see that it's much more complicated than a simple, smooth continuum. Nonetheless, you can at least get a general idea for the temperature of the hot gas around this star by fitting a rough blackbody curve to it -- as is shown by the upper thin blue line.
  Q:  What is the approximate temperature
      of SS Cyg, based on this spectrum?
      Note that wavelengths are given in Angstroms;
      convert to nm using

                1 nm  =  10 Angstroms
This may all seem very simple ... and it is. But as simple as it is, we can still learn quite a bit by looking at the continuous spectrum of a star.
For example, consider the star HD 107146. If we look in the optical, it seems pretty ordinary:
Since its spectrum peaks at about 500-600 nm, this star has a temperature of about 5000 Kelvin; no big deal. Ho hum.
Let's look at a wider range of wavelengths:
Hmmm. The spectrum still has a peak in the visible, at about 500-600 nm. On this linear plot, we can't see anything else of note.
But if we make a log-log plot of the wide spectrum, look what happens:
Q: What's going on here?
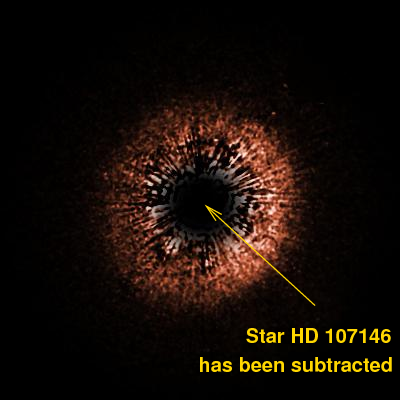
The answer is that this star is surrounded by a very large disk of gas and dust; you can see some of it in this HST image. The star HD 107146 has been subtracted from the center of the picture in order to show faint details in the outer regions.
This disk appears in images taken with radio telescopes, too.
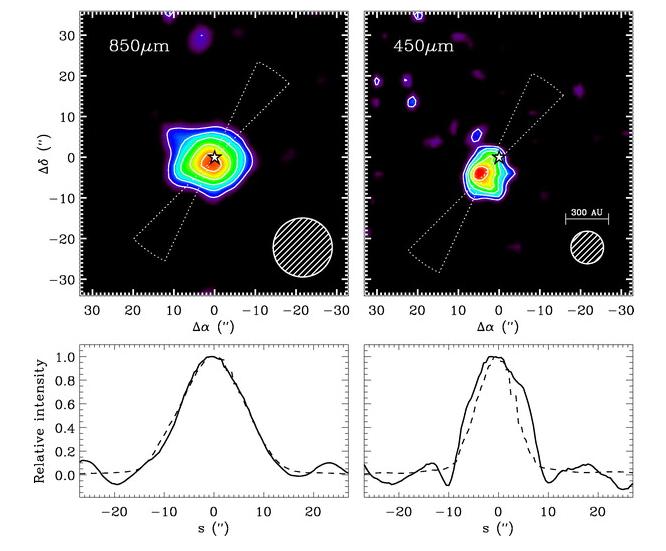
Image taken from
Williams et al., ApJ 604, 414 (2004)
If we fit a blackbody spectrum of temperature T = 5000 K to the spectrum, we see an excess of radiation at long wavelengths.
  Q:  Suppose the extra radiation is due to a
      disk of gas and dust circling the star.
      What temperature would that disk have?
Copyright © Michael Richmond.
This work is licensed under a Creative Commons License.