 Copyright © Michael Richmond.
This work is licensed under a Creative Commons License.
Copyright © Michael Richmond.
This work is licensed under a Creative Commons License.
Last time, we discussed the fate of stars with initial masses at least 5 or 8 times larger than the Sun's mass. At the end of their lives, they build up an inert core of iron-group elements. Since these nuclei do not produce energy when fused together, the core is eventually unable to support itself against gravity, and collapses. Today, we raise the question, "what happens to the core after it has collapsed?"
There are two main possibilities: it forms a stable and very small object called a neutron star, or it never stops collapsing and forms a black hole. We'll focus on the first possibility today, and deal with black holes in the next class.
As you may recall, the degeneracy pressure due to electrons can stabilize the helium or carbon/oxygen core of a star -- as long as that core contains less than about 1.4 solar masses. That pressure occurs because electrons are members of a class of sub-atomic particles called "fermions", which resist having the same quantum properties as other particles.
It turns out that neutrons are ALSO fermions, and so they, too, exhibit a degeneracy pressure when forced into very close proximity to other neutrons. During the collapse of the iron core of a massive star, electron degeneracy pressure is insufficient to halt the compression ... but, in many cases, neutron degeneracy pressure can stop it. The result is, basically, a ball of neutrons, which is why these objects are known as neutron stars.
But just how big is this ball? Are there any limits to the amount of material that this degeneracy pressure can support?
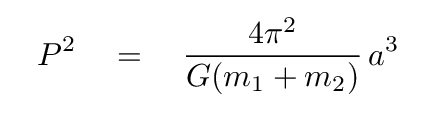
The question of "how MASSIVE are neutron stars?" can be answered reasonably well. Astronomers have found a number of binary star systems in which one or both of the members are neutron stars. We can use Kepler's Third Law to convert the easily measured period, and not-so-easily measured size, of these orbits into the masses of the components.
Kepler's Third Law relates the period of two gravitationally bound objects to the size of their orbit -- and their total mass.
Here,
Let's apply Kepler's Third Law to a very familiar system.
  Q:   The Earth orbits the Sun with a semi-major axis of a = 1.496 x 10¹¹ m.
           The period is (of course) 1 year.  Convert the period into seconds,
           and use Kepler's Third Law to determine the combined mass of the
           Earth and the Sun.
This same technique has revealed the mass of a number of neutron stars.

Figure 1 taken from
Kiziltan et al., ApJ, 778, 66 (2013)
Most of them have masses in the range of 1.0 - 1.5 solar masses, but some reach as high as 2 solar masses. Even though the uncertainties are rather large, it is clear that neutron degeneracy pressure can support objects with masses above the Chandrasekhar limit.
Some more recent measurements suggest that the upper limit to neutron star masses may stretch as high as 2.5 solar masses, or perhaps even higher. Because we cannot create material with these properties in laboratories on Earth, the physics of neutronium are uncertain. We understand neutron stars much less well than white dwarfs.

A portion of figure 3 taken from
Shao et al., Phys. Rev. D. 102, 3006 (2020)
What about the RADII of neutron stars? These are much more difficult to measure than the masses. In a very few cases, neutron stars which are accreting material from nearby companion stars show features in their emission of X-rays which can give clues to their size. The figure below shows a range of masses and radii which are consistent with the measurements of eight neutron-star systems.

Figure 1 taken from
Steiner, Lattimore and Brown, ApJ 765, L5 (2013)
  Q:   The radius of the Sun is R = 6.96 x 10⁸ m, and the
             mass of the Sun is M = 1.99 x 1030 kg.

       Based on the figure above, a typical neutron star of mass 1.5 solar
             masses has a radius of 12 km.   Using these values, compute
             the density of a neutron star.


  Q:   One teaspoon contains a volume of 5 x 10⁻⁶ cubic meters.
             One elephant has a mass of 5,000 kg.  How many elephants
             must be squished into one teaspoon to match the density of
             a neutron star?
It's clear that neutron stars are made of stuff with crazy properties.
As you might imagine, a core-collapse supernova is a very energetic event. A newly born neutron star is heated to VERY high temperatures by the collapse of its own body -- which leads to the loss of a great deal of gravitational potential energy. On top of that (literally) is all the kinetic energy of gas from the layers just outside the core; that material falls down onto the surface of the neutron star and slams into it at very high speeds.
The result is a very HOT object. How hot? In a few cases, we can estimate the temperature of young neutron stars from their thermal emission.

Panel from Figure 3 taken from
Grigorian, Voskresensky and Blaschke, arXiv 1702.01342 (2017)
   Q:  In what region of the electromagnetic spectrum does the thermal
            emission from the Crab Nebula reach its peak?
The X-ray region; in particular, for the Crab Nebula, its blackbody emission peaks at about 1.5 nm = 15 Angstroms. Young neutron stars are among the very few solid objects which can emit appreciable amounts of blackbody radiation at such short wavelengths.
Now, they also emit blackbody radiation at longer wavelengths. Because neutron stars are so small, however, their optical luminosity is pretty small. In fact, astronomers have detected optical radiation from only a handful of neutron stars. One of them is the neutron star at the center of the Crab Nebula.
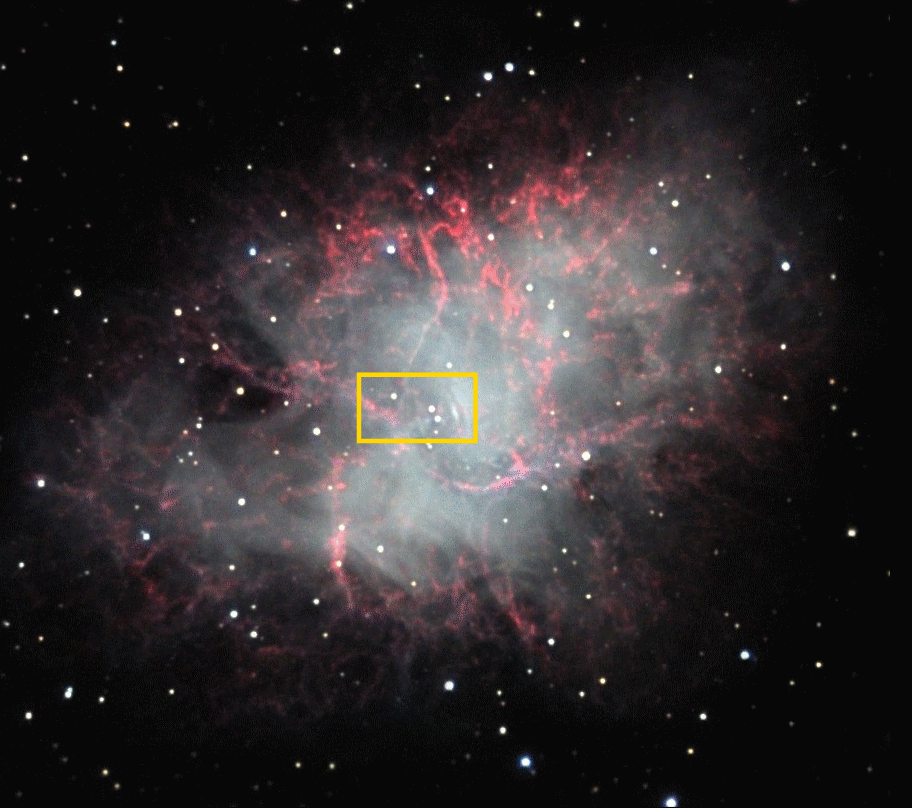
Image image taken by
Adam Block with the Kitt Peak Visitor Center's 0.4 m telescope.
Courtesy of
Adam Block,
NOAO and
NSF.
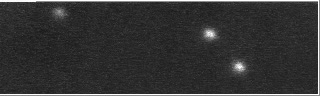
The neutron star is one of the three stars in the gold box near the center of the expanding gas cloud. If one looks at this region with a high-speed camera, capable of taking sub-second exposures, one will see something peculiar:
These flashes of light arrive at regular intervals of about 30 per second.
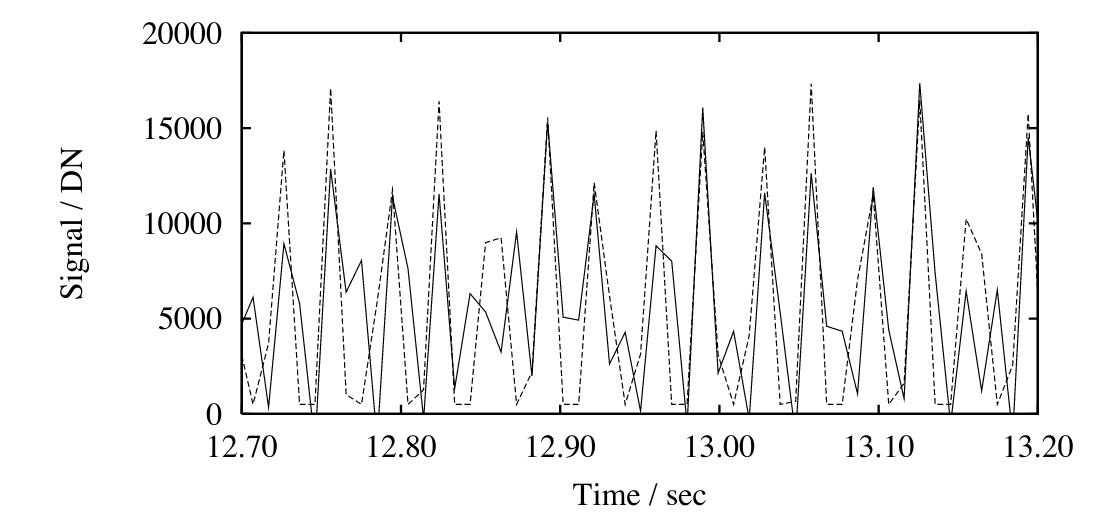
Light curve courtesy of
Nicholas Law's dissertation.
Why should a neutron star emit pulses of radiation at regular intervals?
It turns out that the Crab Nebula's neutron star is not alone. Many of the neutron stars we have detected also emit electromagnetic radiation in periodic flashes. In fact, the very first observational evidence for neutron stars was the anomalous radio emission from a mysterious object. Back in 1967, a graduate student named Jocelyn Bell was examining the long strips of paper which recorded the radio waves detected by a telescope near Cambridge, England. She noticed a bit of scruff at one particular location in the sky.
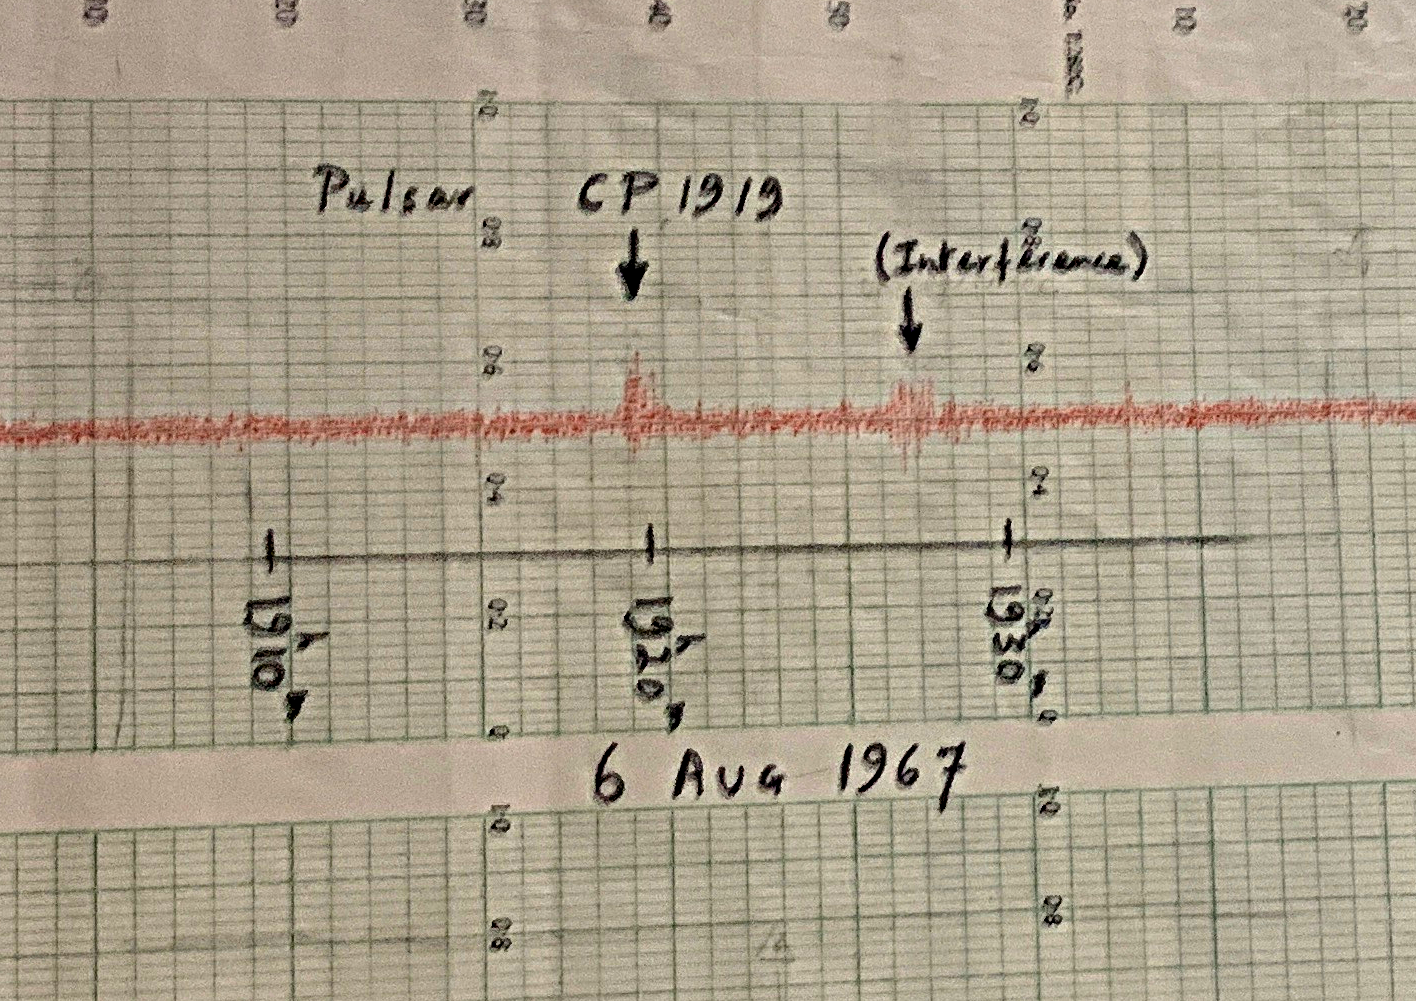
Image courtesy of
Billthom and Wikimedia
Subsequent observations revealed that the source was present at the same location each night, and that the radio waves came in very brief pulses, at a rate of about 30 Hertz.
You can listen to some radio recordings of pulsars (transformed into audio for the benefit of those who lack innate radio receivers) at the link below. Note the wide range of pulse frequencies.
We believe that the pulses of radio (and optical, and X-ray) radiation are caused by two factors:
Click on the picture below to see how this mis-alignment of rotational and magnetic axes can cause us to observe pulses of radiation.
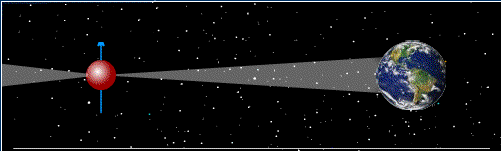
Click on the image to start a Shockwave Flash applet
demonstrating a pulsar in action.
The exact mechanism by which radio (and optical, and X-ray) emission is produced remains a bit of a mystery. Everyone agrees that it has something to do with the very, very strong magnetic fields surrounding neutron stars; electrons caught in these magnetic fields are accelerated as the fields whirl around in sync with the rotation of the neutron star. But scientists haven't yet converged on all the details. As proof, try searching for the phrase "pulsar mechanism" in "Abstract Text" in the Astrophysics Data System. I just did, asking for papers published between Jan, 2019, and Oct, 2020, and received a list of 283 papers. Sheesh.
One item upon which all agree is that the emission of energy across the electromagnetic spectrum via the pulsar mechanism, whatever it is, must extract energy from the rotation of the neutron star. As the pulsar ages, it must slow down, and its period must increase. Look at the example in the figure below.

Figure 1 taken from
Cordes, Downs, and Krause-Polstorff, ApJ 330, 847 (1988)
  Q:  What is the frequency on the date marked "1000"?
              What is the period at this time?

  Q:  What is the frequency on the dark marked "5000"?
              What is the period at this time?

  Q:  What is the change in period over these 4000 days?
If one can measure the change in the rate at which a pulsar rotates over some period of time, one can compute the so-called spindown time of the pulsar: a rough estimate of the time it will take for the object to stop spinning (or, at least, to slow down by a significant amount).
In the case of PSR 0833-45, the time interval of 4000 days corresponds to 3.456 x 10⁸ seconds. We can then compute the spindown time for this object in the following manner:
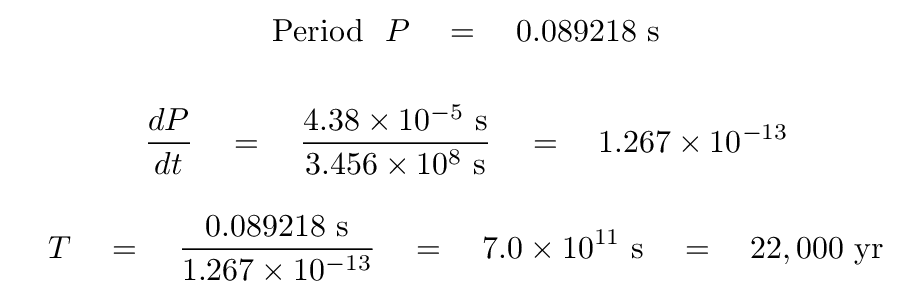
To a rough approximation, one can estimate the age of a pulsar as half the spindown time. Thus, a rough estimate of the age of PSR 0833-45 would be around 11,000 years.
There are a number of other fundamental properties which can be derived using measurements of the periods of pulsars; see Chapter 6 of "Essential Radio Astronomy" from NRAO for more information.
In 2016, the LIGO project announced its first direct detection of gravitational waves. Excellent news, and a triumph of physics and engineering. But that was not the first time that scientists had found strong evidence for the existence of gravitational waves. Pulsars were at the heart of the earlier effort.
In 1975, Joe Taylor (a professor at UMass) and Russell Hulse (his graduate student) published a paper describing a most peculiar radio pulsar.
Abstract of
Hulse and Taylor, ApJ 195, 51 (1975)
Observations made with the giant Arecibo radio telescope showed that the pulses from this particular object did not arrive at exactly regular intervals; instead, they were sometimes ahead of schedule, and then at other times behind schedule. The differences from a strictly periodic behavior showed a pattern:
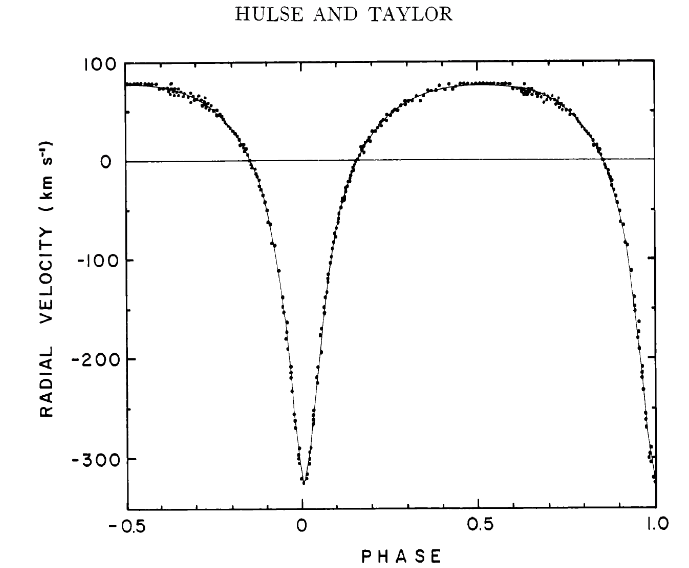
Figure 1 taken from
Hulse and Taylor, ApJ 195, 51 (1975)
Hulse and Taylor deduced that this pulsar, PSR 1913+16, was part of a binary system. As it moved around the center of mass of this system, its pulses sometimes arrived a little earlier than expected (when it was on the near side of the orbit), and sometimes later than expected (when it was on the far side of its orbit). Interesting, for sure, and useful in an obvious way: it allowed us to determine the mass of the neutron star.
But Hulse and Taylor also realized that this system was interesting in a not-so-obvious way: it might allow us to test the theory of general relativity! Einstein's theory of general relativity (GR) postulated that if a sufficiently massive object was accelerated with a sufficiently large amplitude, it would emit gravitational radiation. This binary neutron-star system just might do the trick -- in large part because the measurements of the arrival times of the radio pulses could be made to VERY high precision.
So, over the next few years, Taylor and his collaborators continued to monitor PSR 1913+16 closely. The prediction from GR was that gravitational waves would energy away from the binary system, causing its orbit to shrink slightly. In 1982, they released an analysis of seven years worth of data, showing that the orbit WAS shrinking, and by exactly the amount predicted by GR.
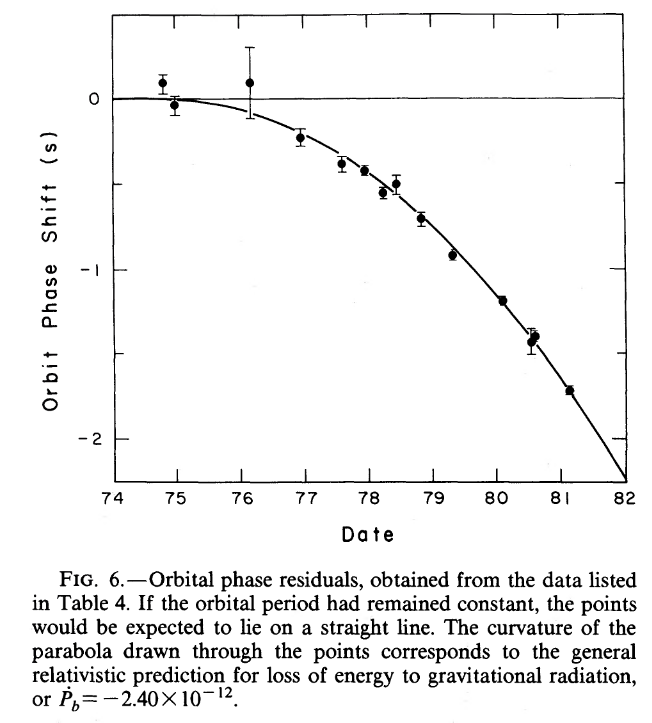
Figure 6 taken from
Taylor and Weisberg, ApJ 253, 908 (1982)
The evolution of the binary's orbit has continued to follow the prediction of GR ever since -- for the next twenty-two years or so.
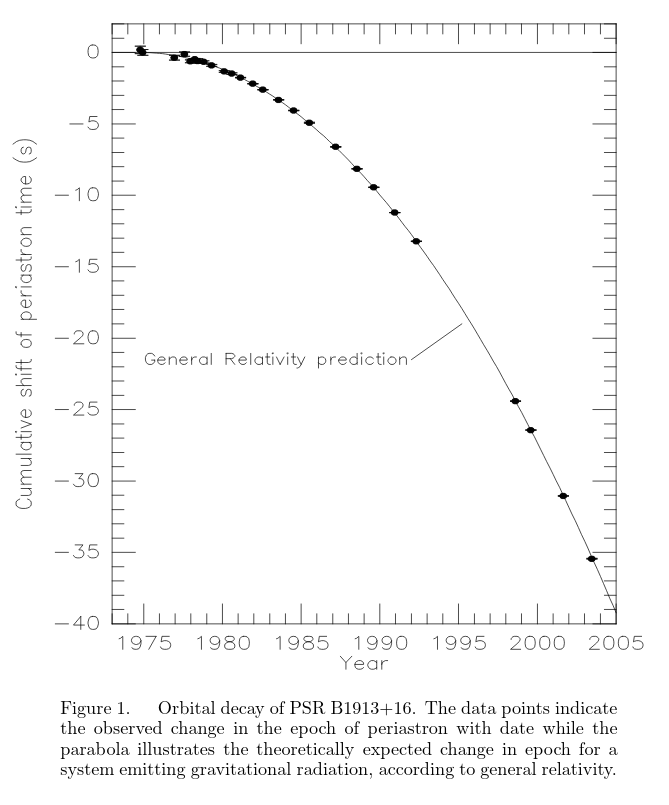
Figure 1 taken from
Weisberg and Taylor, in "Binary Radio Pulsars,"
ASP Conf. Ser. 328 (2005)
For their discovery of this binary pulsar system, and for using it to test Einstein's theory of general relativity, Hulse and Taylor were awarded the Nobel Prize for Physics in 1993.

Image courtesy of
nobelprize.org
In the days before the Internet and Google Maps, people used a variety of methods to indicate their location on a map. A signpost, for example, not only told one the direction to certain other locations, but also allowed one -- with a bit of geometry -- to fix the post's location on map.
Q: Where was this fictional signpost located?

Image courtesy of
The National Museum of American History
Because radio waves can penetrate clouds of gas and dust, one can detect pulsars from all parts of the Milky Way Galaxy. In addition, each pulsar has its own unique frequency. For these reasons, a number of scientists and writers have figured that pulsars would make good galactic signposts.
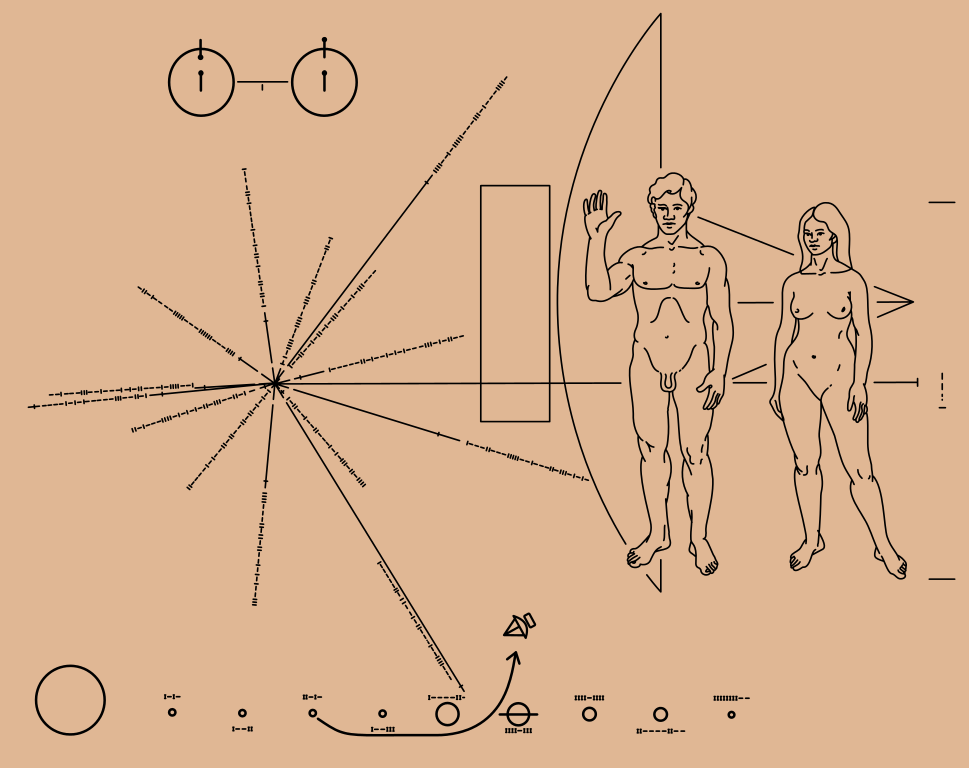
In 1972, the Pioneer 10 and 11 spacecraft were being prepared for their missions to Jupiter and Saturn. After their encounters with the gas giants, each ship would be flung outward into space at very high speed, away from the Sun. They would travel out into interstellar space, escaping from the Solar System and wandering off into the depths of the Milky Way. Since there was a chance -- however remote -- that the craft might be discovered someday by alien creatures as they drifted through space, NASA decided to attach a plaque to each ship, giving such salvagers information about the Pioneers and the humans who made them. The figure below is a (slightly modified) version of the plaque. Note the diagram at left, below the picture of a hydrogen atom (that's one atom making a spin-flip transition, not a molecule).
A slightly modified version of the
plaque placed on the Voyager spacecraft,
courtesy of
Wikipedia
Click on the image for the original version.
The diagram shows lines radiating away from a point -- the location of the Sun -- each one labelled with a binary number. The lines represent 14 different pulsars, and the numbers the period of each one. Each period is written in terms of the period of the 21-cm spin-flip transition of neutral hydrogen.

Closeup of the pulsar map portion of the Voyager plaque,
courtesy of
Wikipedia
  Q:  What is the number represented by the sequence of vertical (1)
           and horizontal (0) dashes for the line marked with "A"?
           Start reading at the inner end.


  Q:  The wavelength of the 21-cm hydrogen transition is 21.106 cm.
           Can you figure out the PERIOD of that transition?


  Q:   What is the period of the pulsar indicated by the line
           marked with "A", in seconds?
By identifying all 14 pulsars, and then figuring out the location at which they would appear at the direction and distance indicated in the diagram, one can determine the location of the Earth. To make things easier, the long horizontal line extending from the Earth's location to the right, behind the pictures of the man and woman, all the way to the right-hand edge of the plaque, indicates the direction of the center of the Milky Way.
Copyright © Michael Richmond.
This work is licensed under a Creative Commons License.