Take a look at this photograph of open star cluster M103.
Which are the three brightest stars? Clearly, these stars should have the smallest magnitudes, right? And here are the Bt magnitudes in the Tycho-2 catalog.
star   Bt mag
---------------
  A     7.6
  B     8.6
  C     9.3
  D    12.6
But watch what happens when we take a picture of the same cluster of stars with a different sort of photographic emulsion.
Click on the picture above.
Which are the three brightest now? So which should have the smallest magnitude values?
Okay, something's fishy here: how can one set of stars be brightest in one picture, but a different set of stars be brightest in another? Perhaps looking at this sequence of images will give the answer.
Stars come in a wide variety of colors. It's not glaringly obvious when you look at them up the in sky, for several reasons:
Nonetheless, if you look carefully, you will see slight differences in colors. In the constellation Orion, for example,
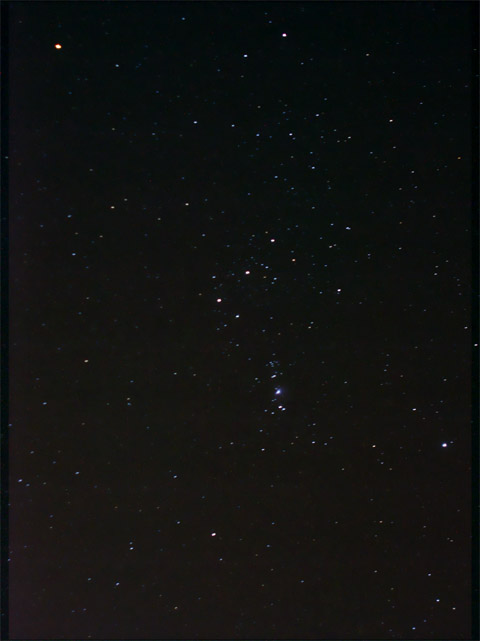
Image courtesy of Denys Sakva
Betelgeuse, at the upper left, is clearly redder than most of the stars.
You can enhance the colors in a photograph (or an eyepiece) by defocusing so that the light is spread out over a larger area.
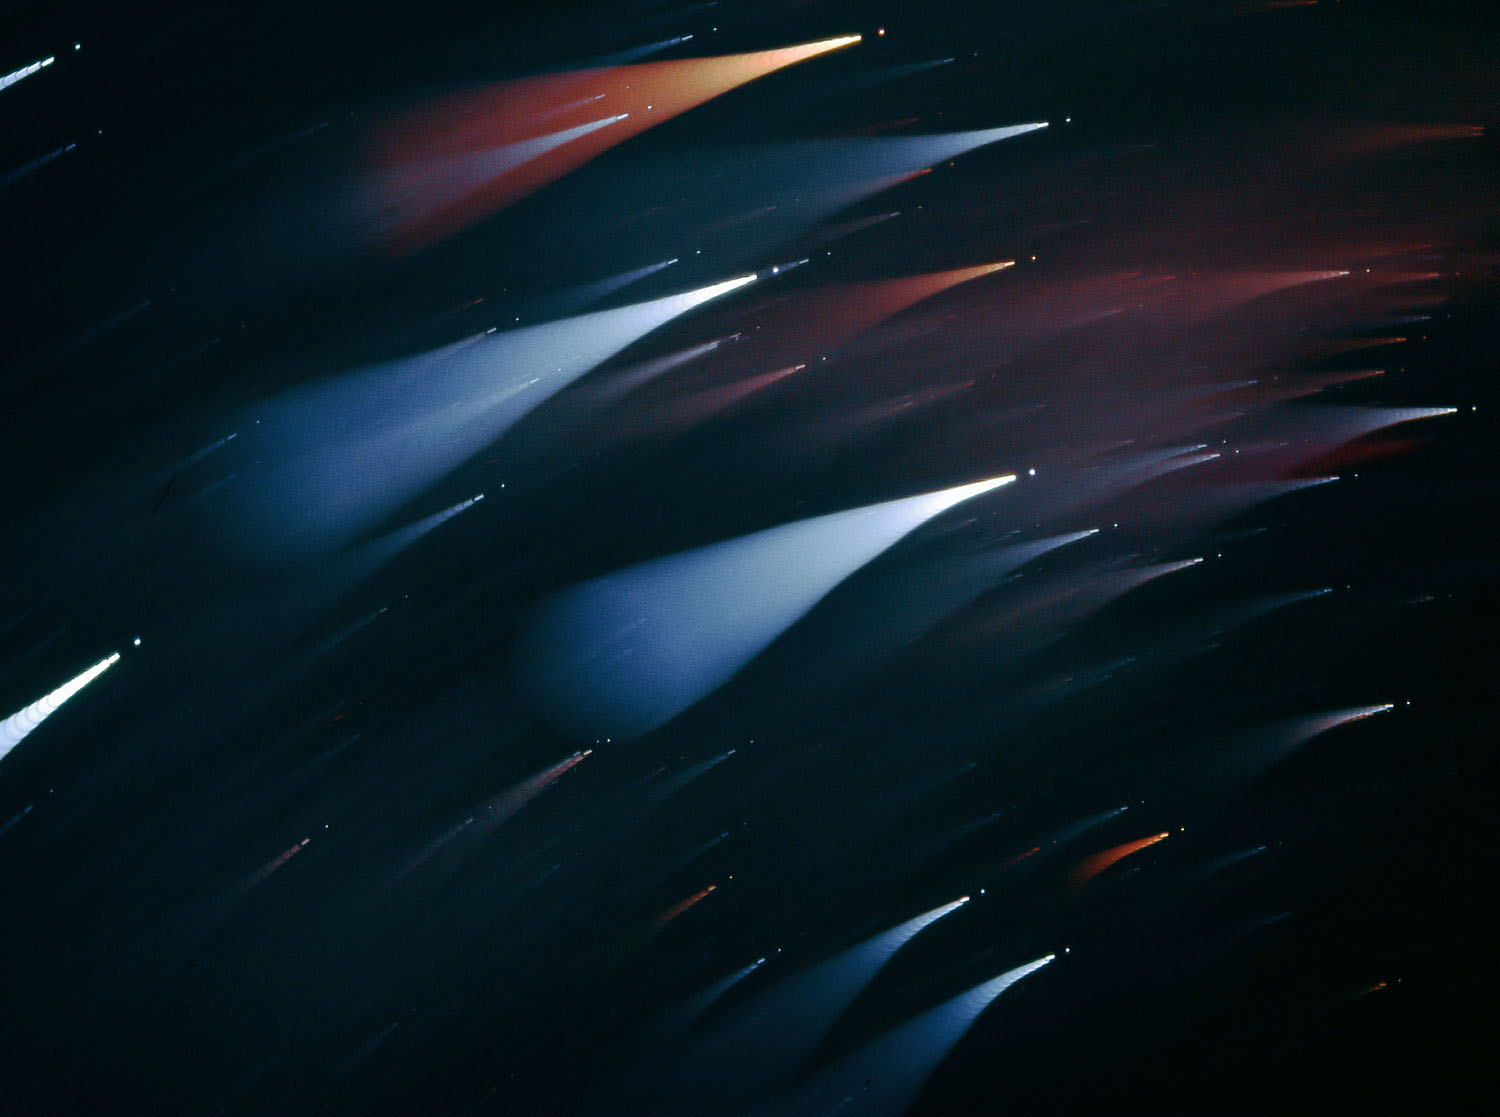
Image from
Astronomy Picture of the Day 2004 July 8 , copyright
Stefan Seip .
  Q:  What causes some stars to look blue and others red?
      In other words, what is the cause of stellar color?
The answer is temperature.
Let's take just a moment to discuss the way astronomers describe temperature. Here on Earth, under ordinary circumstances, people use temperature scales which tend to give "convenient" values for most objects: small positive numbers, like "12" or "45" or "98".
                   Fahrenheit       Celsius
-----------------------------------------------
 temp = 0         salty water      pure water
                   freezes          freezes


 temp = 100       human body       pure water
                 temperature        boils
------------------------------------------------
Astronomers study objects which cover a much, much wider range of temperatures. Very cool clouds of gas and dust may have temperatures which are inconveniently low in this ordinary scales: -420 Fahrenheit or -250 Celsius. Ordinary stars like the Sun have temperatures in the thousands of degrees, and very hot stars may reach many tens of thousands. It is confusing to deal with both negative and positive numbers, so astronomers choose to adopt the Kelvin temperature scale: it starts at the coldest possible temperature, then moves upwards in steps which are the same size as Celsius degrees.
                   Fahrenheit       Celsius        Kelvin
-----------------------------------------------------------
coldest possible     -459            -273            0
temperature

pure water
freezes                32               0          273

pure water
boils                 212             100          373

------------------------------------------------------------
It's easy to convert from Celsius to Kelvin: just add 273. Converting from Fahrenheit to Kelvin is a bit harder, but if you use Celsius as an intermediate step, it isn't so hard.
Note that scientists often omit the word "degrees" when describing a temperature in Kelvin. Pure water freezes at "0 degrees Celsius," but at "273 Kelvin". Someone who wants to sound old-fashioned might even write "273 Kelvins".
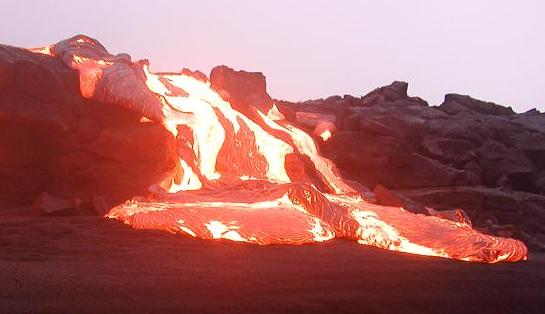
You probably already know that hot objects glow with a color that depends on their temperature. Relatively cool lava -- only 1000 Kelvin -- appears a dull red:
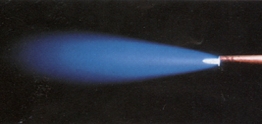
while an oxyacetylene blowtorch at 3200 Kelvin emits bluish-white light:
What's happening is that the temperature of an object affects the spectrum of light that it emits. A "spectrum" is simply a description of the amount of light broken up by wavelength. We can display the spectrum of an object as a picture, like this:

Image copyright Maurice Gavin
We can also show spectra in graphical format, with wavelength along the horizontal axis and intensity of light along the vertical axis.
Image and spectrum copyright Maurice Gavin
It turns out that there is a clear pattern to the spectrum of light emitted by an object.
The formal definition of magnitudes describes only differences between two stars; it does not contain a zero point. Clearly, it is necessary at some point to set a zero point, so that stars can be described individually
Sirius has magnitude -1.46
rather than only in relation to others
Sirius is 0.30 magnitudes brighter than Canopus
But how to choose that zero point?
One of the complicating factors is that the apparent brightness of a star depends on the equipment being used to measure it. "Sure," you might say, "when I look through a big telescope, a star will appear much brighter than when I look through a small telescope." True enough. But the relative brightness of two stars right next to each other may change, depending on how one views them:
Why?
The answer is that the temperatures of stars span a wide range, from less than 2000 Kelvin to more than 50,000 Kelvin. Most stars emit radiation like a classical blackbody, with a spectrum which depends mostly on their temperature:
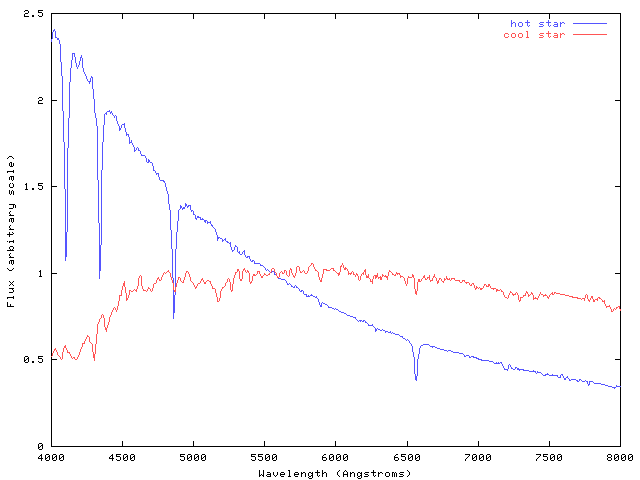
Now, if one were to attach a blue filter to one's telescope, one would measure only the blue light emitted by stars. In that case, the hot star would appear brighter than the cool one:
On the other hand, if one were to attach a red filter to one's telescope, the cool star would appear brighter than the hot one:
So, the ratio of apparent brightness -- and, hence, the magnitude difference -- between two stars depends on the bandpass through which one observes them. A "bandpass" is the overall sensitivity of an instrument as a function of wavelength: it includes the effects of filters, plus characteristics of the detector, and telescope mirrors.
Astronomers have settled on a number of different photometric systems, each one based on a particular passband (i.e. a particular combination of filter and detector and telescope). One should always remember to specify the system when quoting the magnitude of a star.
Most astronomers working in the optical use the UBVRI photometric systems. These are five different passbands which stretch from the blue end of the visible spectrum to beyond the red end. They were set up many years ago by several astronomers:
The systems are defined by particular combinations of glass filters and photomultiplier tubes, since there were created back in the days before CCDs existed. Since photomultipliers and CCDs have very different spectral sensitivities (photomultipliers are more efficient in the blue, CCDs in the red), it is difficult to make the effective passband of a CCD-based instrument match that of a photomultiplier-based instrument. In 1990, Michael Bessell came up with a recipe for making filters out of common colored glasses which would reproduce pretty closely the official Johnson-Cousins UBVRI passbands.
The UBVRI passbands are called broadband because they span wide swaths of wavelengths. The spectral resolution of the passbands is small:
                               central wavelength
  spectral resolution     =  ----------------------   =  approx 5
                               width of passband
For some applications, astronomers use filters which transmit a much smaller range of wavelengths; a common filter used to measure light emitted by hydrogen atoms is centered at 6563 Angstroms and roughly 20 Angstroms wide:
                               6563 Angstroms
  spectral resolution     =  ----------------------   =  approx 330
                                20 Angstroms
A narrowband filter like this requires much longer exposure times to build up the same signal as a broadband filter. Since telescope time is so precious, astronomers tend to use broadband systems. That's one reason for the popularity of the UBVRI system.
When writing the magnitude of a star, astronomers use an abbreviation to denote the photometric system of the measurement:
    V = 1.03    means   "magnitude of this star in the V system is 1.03"
    B = 0.46    means   "magnitude of this star in the B system is 0.46"
There is also a convention to use lower-case letters for raw measurements and upper-case letters for fully reduced values:
    b = 1.18    means   "a measurement made through a B filter"
    B = 1.22    means   "the same measurement after a full reduction"
So, once one has settled on the equipment one will use -- which sets the photometric system -- one still faces the question of the magnitude zero-point. The choice is arbitrary. Astronomers have chosen to use the bright star Vega as their starting point.
In the UBVRI systems, the star Vega is defined to have a magnitude of zero.(*)
* Actually, this is not quite true: the zero point is defined strictly by the mean measurements of a set of bright stars (which may include Vega), rather than by Vega alone. However, since Vega always ends up with a magnitude within a few percent of zero, the simple rule "Vega's magnitude is zero" suffices for almost all purposes.That is,
     Vega's magnitude in U-band:     U = 0.0
     Vega's magnitude in B-band:     B = 0.0
     Vega's magnitude in V-band:     R = 0.0
     Vega's magnitude in R-band:     V = 0.0
     Vega's magnitude in I-band:     I = 0.0
When ordinary people use the word "color" to describe a star, then mean "what is the tint perceived by the eye?" One star might have a color of "pale orange", another "bluish-white".
But astronomers use the word "color" in very different way. To them, "color" is a measure of the magnitude difference of a star in two passbands .... relative to the magnitude difference of Vega in the same passbands. Let me illustrate with an example or two.
Consider the stars Vega (a hot star), Antares (a very cool star), and Meissa (a very hot star in the constellation Orion). We can measure their magnitudes in the B and V passbands.
                 B             V           (B-V)
-----------------------------------------------------------
   Vega         0.00          0.00         0.00

   Antares      2.96          1.09        +1.87

   Meissia      3.20          3.39        -0.19
An astronomer would say, "Antares has a color index of (B-V) = 1.87", or less formally "Antares has a color of 1.87", or, even less formally, "Antares is red." Any color index less than about 0.5 (indicating a temperature similar to Vega's roughly 10,000 K) means a star is "blue"; any color index greater than about 1.5 (indicating a temperature much less than Vega's) means a star is "red".
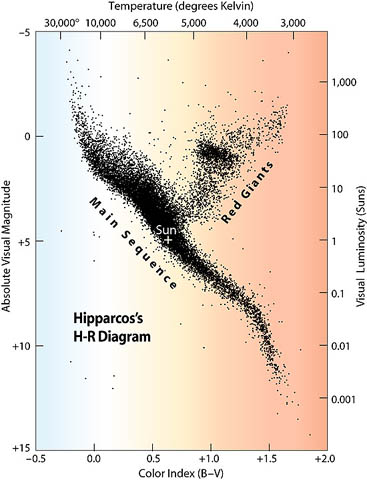
Because so many measurements have been made in the B and V systems over the years, astronomers often use the (B-V) color index as "the" measure of the color of a star. In fact, one can also refer to the color index formed by (U-B), or (V-I), or any other pair of passbands. But (B-V) is the most commonly used index. For example, the Hertzsprung Russell diagram, which shows the relationship between the luminosity of a star and its temperature, is usually plotted with color index (B-V) as an indicator of temperature:
Because most ordinary stars emit radiation like a blackbody, there is a simple relationship between their color index and their temperature. Sekiguchi and Fukugita, AJ 120, 1072 (2000) show
This suggests a very quick and easy way to determine the temperature of a star: simply take images through two different passbands (B and V, for example), and then apply an empirical formula to turn the color index into a temperature. With a wide-field camera, one can measure hundreds or even thousands of stellar colors in a single pair of images ...
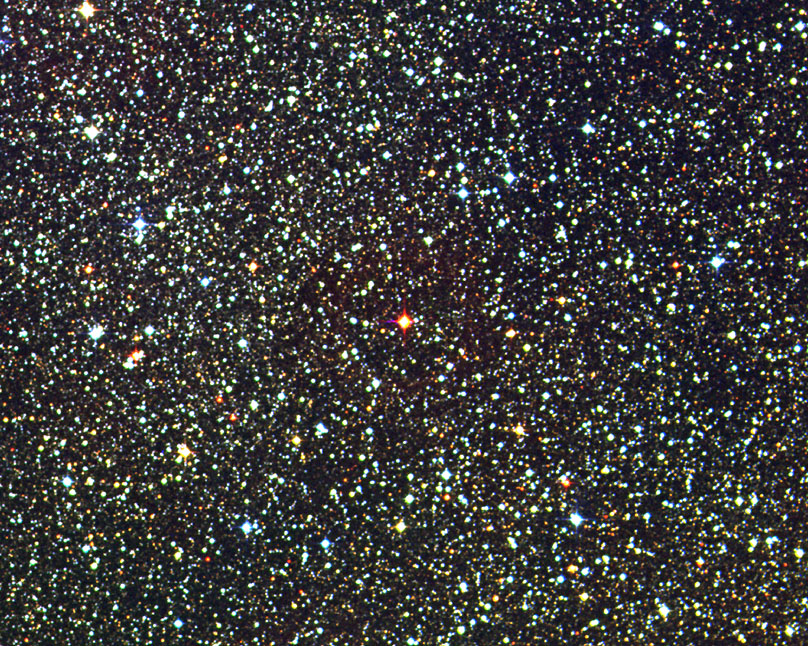
This
APOD for Dec 4, 2005 comes from
David Malin,
UK Schmidt Telescope,
DSS,
AAO --
...
and so one can calculate the temperatures of
thousands of stars after just a few minutes work
at the observatory.
This is much, much faster
than taking the spectrum of each star
individually (though, to be fair, the temperature
determined from a spectrum is more accurate than
one from color index alone).
Exercises
For more information