 Copyright © Michael Richmond.
This work is licensed under a Creative Commons License.
Copyright © Michael Richmond.
This work is licensed under a Creative Commons License.
People have long known that the stars are far, far away; in the nineteeth century, astronomers finally measured the distances to a few nearby stars with reasonable accuracy. The results were so large -- thousand of trillions of miles -- that most people figured we'd never be able to visit them or learn much about them. After all, we can't go to a star, grab a sample, and bring it back to earth; all we can do is look at light from the star. In fact, at least one prominent philosopher and scientist went on the record as saying that we'd never be able to figure out their compositions.
Of all objects, the planets are those which appear to us under the least varied aspect. We see how we may determine their forms, their distances, their bulk, and their motions, but we can never known anything of their chemical or mineralogical structure; and, much less, that of organized beings living on their surface ...
(Comte refers to the planets in the quotation above; he believes that we can learn even less about the stars)
But, it turns out, light from the star encodes a wealth of information about the physical state of its outer atmosphere. Light is produced in the inner regions of a star and works its way out to the "surface" -- which is really a part of the gaseous atmosphere called the photosphere. Photons produced in the photosphere have a good chance to escape outwards into space and, eventually, reach us. As photons fly through the outermost layers of the stellar atmosphere, however, they may be absorbed by atoms or ions in those outer layers. The absorption lines produced by these outermost layers of the star tell us a lot about the chemical compositition, temperature, and other features of the star.
Today, we'll look at the processes by which emission and absorption lines are created. We'll also do a little bit of analysis, but leave most of it for a later day...
Low-density clouds of gas floating in space will emit emission lines if they are excited by energy from nearby stars. Planetary nebulae, for example, are the remnants of stars which have gently pushed their outer envelopes outwards into space. Some of them are very pretty:

See
Astronomy Picture of the Day for Oct 31, 1999
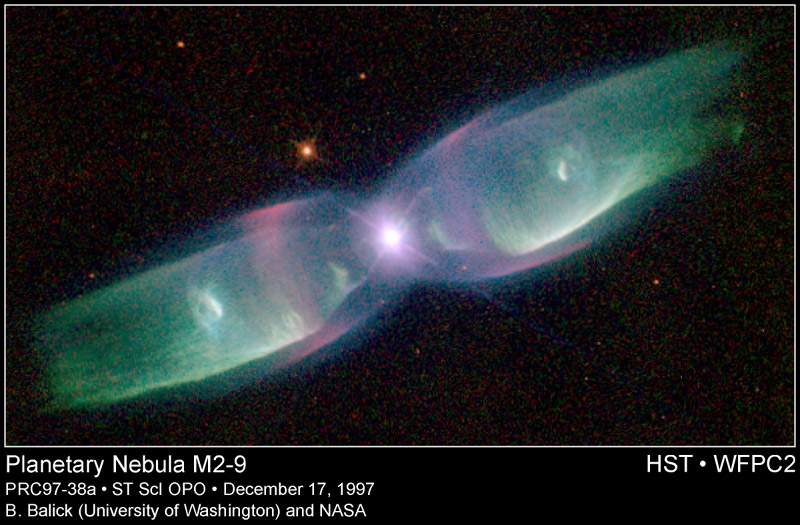
See
Astronomy Picture of the Day for March 21, 1999
The hot central stars which remain irradiate these wispy shells of gas with high-energy ultraviolet photons, which excite the atoms in the gas and cause it to glow. The spectrum of a planetary nebula reveals almost nothing but very strong, narrow emission lines:
Remember that 10 Angstroms = 1 nm, so 4000 Angstroms = 400 nm = blue light ...
What exactly did I mean by the phrase excite the atoms in the gas? And what does that have to do with these narrow emission lines? Let's take a look at the individual atoms in the gas around a planetary nebula....
Individual atoms consist of a nucleus of positive charge surrounded by one or more negative particles called electrons. To a rough approximation, the electrons circle the nucleus, somewhat as planets circle the Sun.
  Q:  What is the force which keeps planets in
      orbit around the Sun?

  Q:  What is the force which keeps electrons in
      "orbit" around the nucleus?
Unlike the orbits of planets and asteroids around the Sun, which may be any size, the orbits of electrons in atoms turn out to obey a rather peculiar set of rules.
So, for example, one particular atom might have orbits with energy levels like this:
In this case, the energy difference between the second and first orbit is Δ E = 6 - 1 = 5 units. We'll discuss details of the units in a moment. Now, if a photon of 5 units of energy happens to run into this atom, it might be absorbed by the atom, exciting the electron from the first orbit to the second orbit.
Before ...
... and after.
Notice that the photon has disappeared.
Once you have excited an atom, all you have to do is wait a bit; eventually, the atom will jump back down to a lower energy state, emitting a photon itself.

The energy of this emitted photon is exactly equal to the difference in atomic energy levels between the initial and final states. In this example, the emitted photon would have 5 units of energy.
Because each type of atom has its own unique set of energy levels, each type of atom will emit light with a different set of energies. And, given the relationship between the energy E of a photon and its wavelength λ (or frequency ν)
that means that each type of atom will produce a set of emission lines at its own unique wavelengths.
Oh, by the way, in case you aren't familiar with these symbols,
here are their definitions. We'll see a more convenient
form of the equation above in just a few minutes ....
      Planck constant   h  =  6.636 x 10^(-34)   Joule-sec

      speed of light    c  =  2.998 x 10^(8)     meter/sec
For example, consider hydrogen, the simplest (and most common) element in the universe. It consists of a single proton in its nucleus, around which a single electron orbits.
The energy levels of a hydrogen atom follow a regular pattern. The energy of level n is given by a simple formula:
Sometimes it helps to make a picture of the energy levels.
We put the "ground state" level, n=1, at the bottom of the diagram. At the top, we put the level at which the atom will be ionized: if it gains this much energy, the electron flies off into space, never to return.
We can depict an atomic transition graphically by drawing a little ball on the diagram to represent the energy of the atom. If the atom drops from a high level to a lower one, it will emit a photon. The energy of the photon is equal to the difference between the initial and final energy levels.
  Q:  What is the energy of the photon emitted
      when a hydrogen atoms drops from n=2
      to n=1?
As mentioned earlier, the energy of a photon determines its wavelength. You can convert from one to the other via a formula
where h is Planck's constant and c is the speed of light. The combination h times c has the convenient value of 1240 eV*nm, so
  Q:  What is the wavelength of the photon emitted
      when a hydrogen atoms drops from n=2
      to n=1?


      Could you see that photon with your eye?

  Q:  What is the wavelength of the photon emitted
      when a hydrogen atoms drops from n=3
      to n=2?


      Could you see this photon?
Transisions in which a hydrogen atoms drops down in energy to the second level are called Balmer transitions, after the scientist who first measured their properties very carefully. Since they occur in the visible portion of the spectrum, and they involve the most common element in the universe, they are one of an astronomer's most powerful tools. If you look again at the spectrum of the planetary nebula, you'll see several Balmer lines:
Remember that 10 Angstroms = 1 nm, so 4000 Angstroms = 400 nm = blue light ...
Other atoms have spectra which are more complex than that of hydrogen; there are no simple formulae describing their energy levels. Fortunately, many scientists have spent years measuring the wavelengths of light emitted and absorbed by almost every variety of atom (and ion, and molecule) you can imagine. You can look up the wavelengths for any particular material in one of several big compilations of spectral lines.
A high-resolution spectrum of the Sun shows many, many, MANY dark absorption lines:
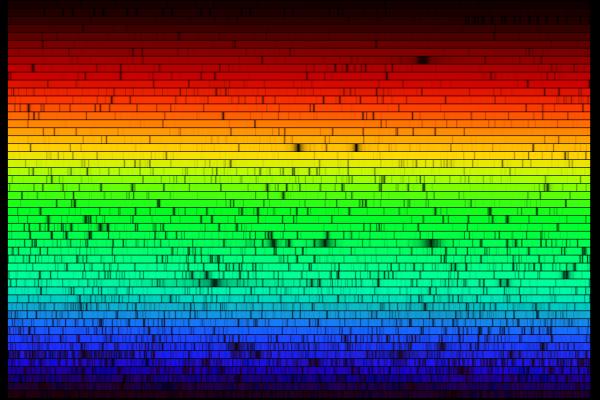
Absorption lines are based on the same physical principle as emission lines: they involve an atom jumping from one particular energy level to another. In this case, however, the jumps must be upwards, from a low level to a higher one.
For example, if a photon of wavelength 121 nm happens to fly past a hydrogen atom in its ground state,
the hydrogen atom will absorb the photon and hop up to the n=2 level.
That means that if we look at a source of continuous radiation

through a cloud of hydrogen gas, we will see a dark absorption line at 121 nm.

We see absorption lines in the spectra of ordinary stars like the Sun because the tenuous outer layers of the stellar atmosphere -- called the photosphere -- absorb some of the continuous light coming from the hot, dense interior.
Emission and absorption lines can tell us a great deal about a distant celestial source, but they only occur under certain conditions.
Emission lines from an element will appear if
Absorption lines from an element will appear if
Below are a set of spectra of three different real stars and one theoretical, simulated star. All three stars have similar temperatures in their photospheres, so the differences in the absorption lines of any one particular element do indicate differences in the abundance of that element.
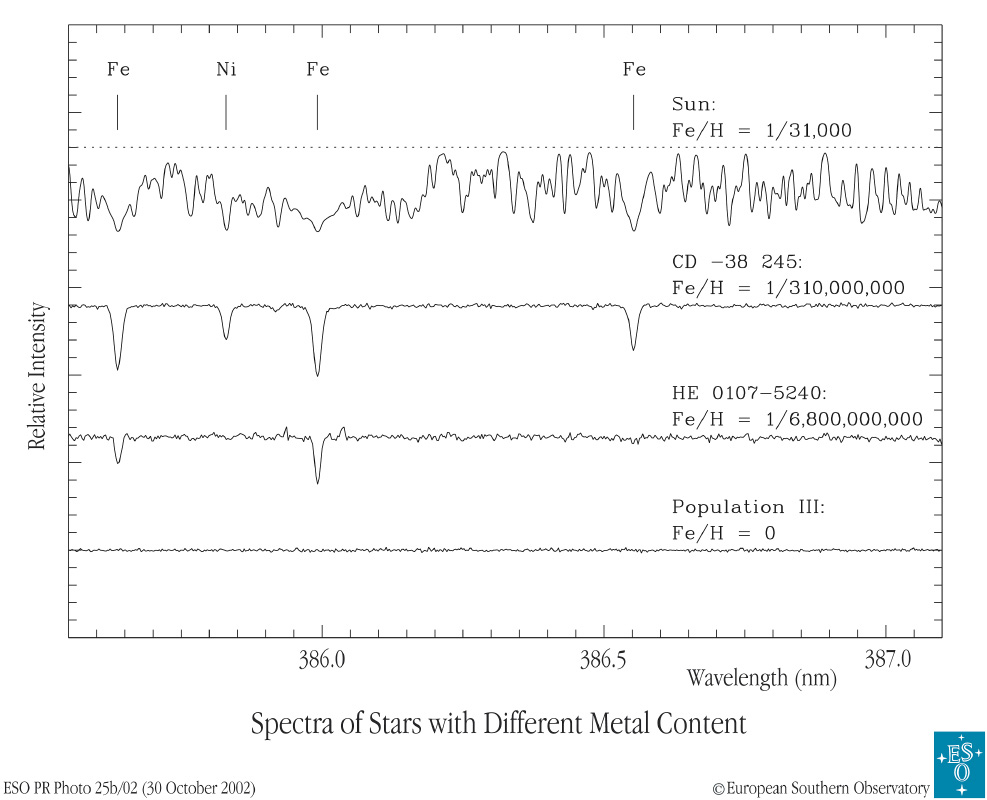
Image courtesy of
the European Southern Observatory
On the other hand, if you're not careful, spectral analysis might lead you astray. Let's compare the spectra of our own Sun with that of the bright star Vega.
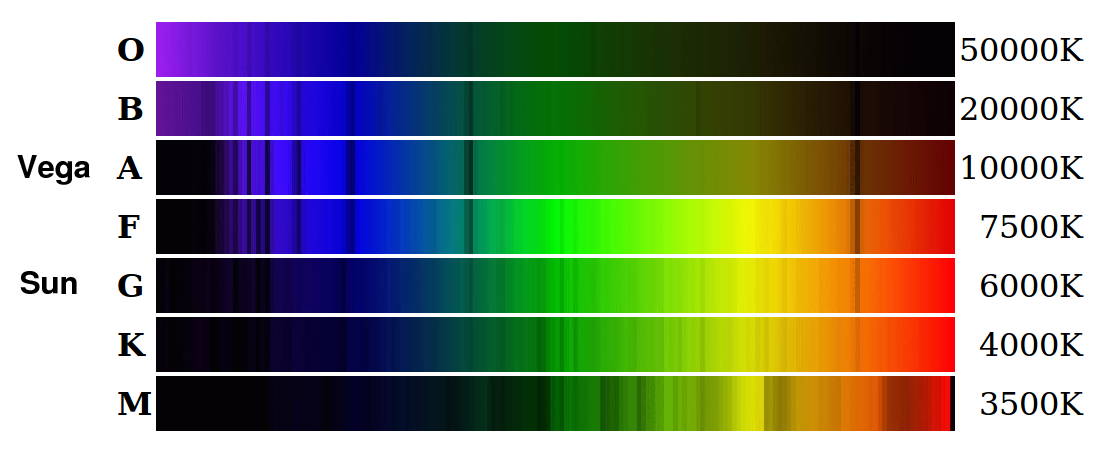
Image courtesy of
Michael Lemke and Simon Jeffrey
Here are the spectra shown as a graph, rather than as a picture. You can see the Balmer absorption lines of hydrogen in the spectrum of Vega very clearly.
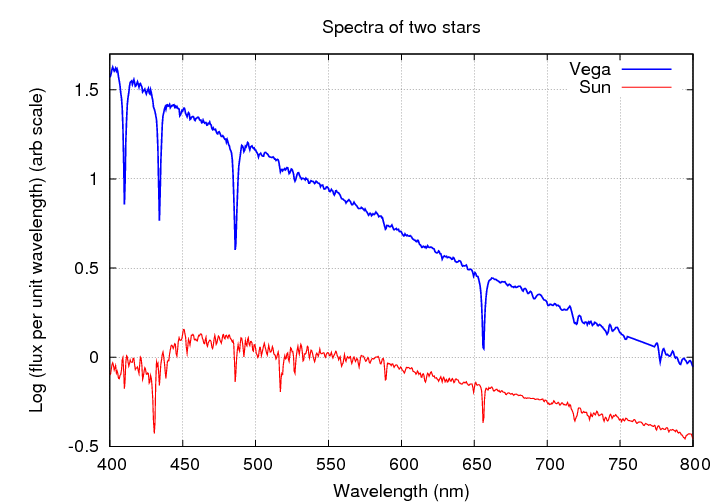
  Q:  What element makes up most of the star Vega?


  Q:  What element makes up most of the Sun?


  Q:  Why don't the absorption lines of hydrogen
      dominate the spectrum of the Sun, too?
The answer isn't obvious. In the early 1900s, astronomers didn't understand it, and they thought that IRON was one of the most common elements in the Sun's atmosphere, while hydrogen was a minor constituent. The person who solved this puzzle and figured out the true composition of the stars was a young woman named Cecilia Payne.

            n          energy (eV)
          -------------------------
            1           -5.14
            2           -3.04
            3           -1.96
            4           -1.52
          -------------------------
One of the strongest lines in the spectrum above is due to a transition in sodium atoms. Which one is it? What is the wavelength, and what are the levels involved?
For more information
Copyright © Michael Richmond.
This work is licensed under a Creative Commons License.