Remember, y-axis shows counts divided by 2
On Jan 9/10, 2019, RIT student Ashley Frank acquired a set of dome flat images in order to check the linearity of HDI. The procedure was:
Ashley performed her own analysis of the data, checking to see if the mean counts were linearly related to the exposure times. You can read her analysis:
I converted the images from the native HDI FITS format to a simple FITS image format; in the process, all pixel values were divided by 2.
I computed a single mean value in the overscan region of each image and subtracted that from all pixels. I then computed statistics in 4 boxes in a 2x2 grid pattern; each box was 25-by-25 pixels.
You can find a text file with the data values here:
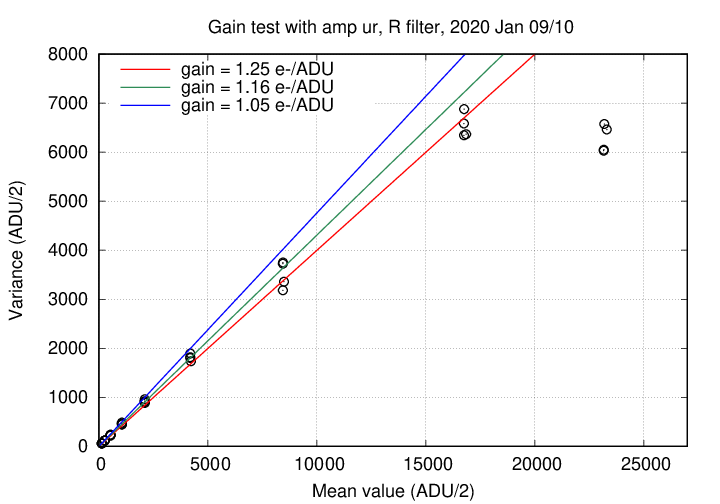
I computed the mean value in each box, and the variance. The inverse gain (electrons per ADU) is given by the following graphs of variance vs. mean:
Remember, y-axis shows counts divided by 2
A linear fit to the data with mean counts less than 6000 ADU/2 yields an inverse gain of 1.16 electrons per ADU. This value is slightly smaller than those measured for HDI in previous years. It is possible that the repairs made during the fall of 2019 caused these small changes.
These tests suggest a small change in the response HDI when levels increase above 30,000 counts (= 15,000 counts/2). That result is consistent with linearity tests performed in 2015:
One can use the same images to check the linearity of the chip. You can find a text file with exposure times and mean levels here:
We are implicitly assuming that the shutter acts perfectly over exposure times in the range 3 - 540 seconds. At the short end, that might not be true, as tests of the shutter in Feb, 2016 suggest that the shutters might be uniform only over exposures of more than 5 seconds.
Below are graphs showing deviations from a linear fit to the mean value over the ENTIRE frame as a function of exposure time. The fit was made using data with
First, on a linear scale with exposure time; then, on a logarithmic scale.
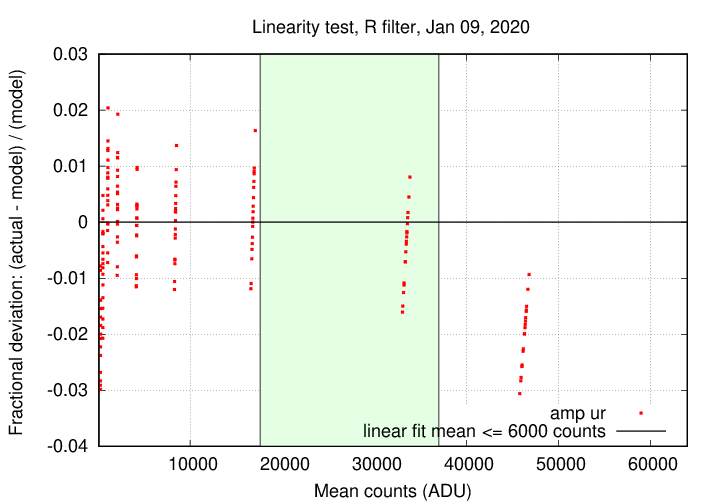
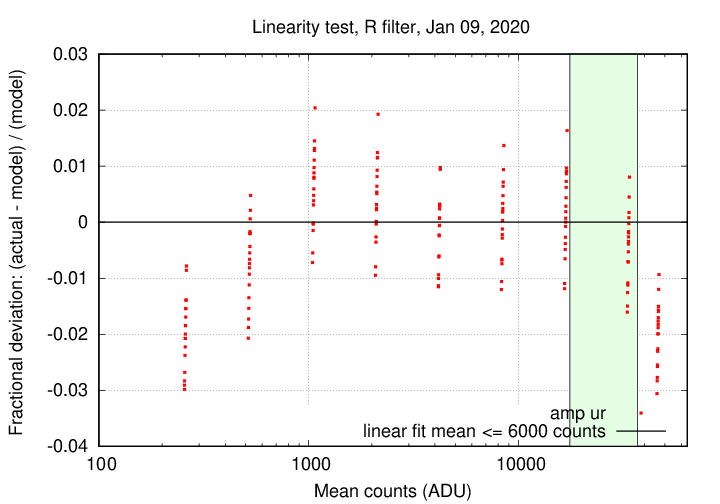
We see that the response falls slightly below a linear model when the mean levels are above 30,000 ADU. There is also a deviation at small count levels.
Below is the same data, plotted as a function of exposure time.
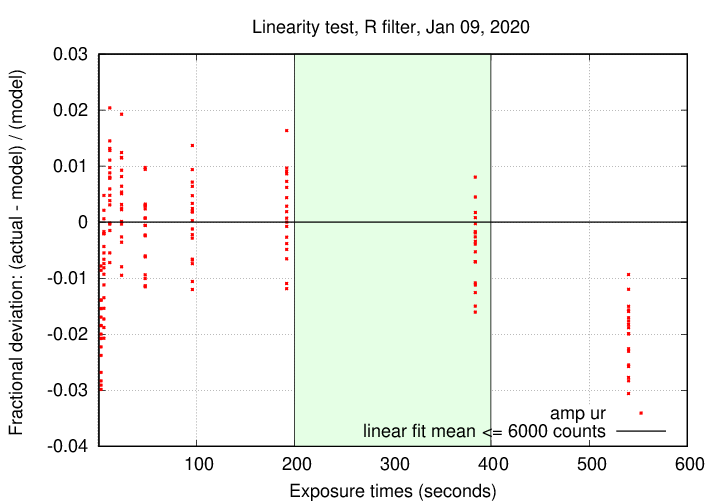
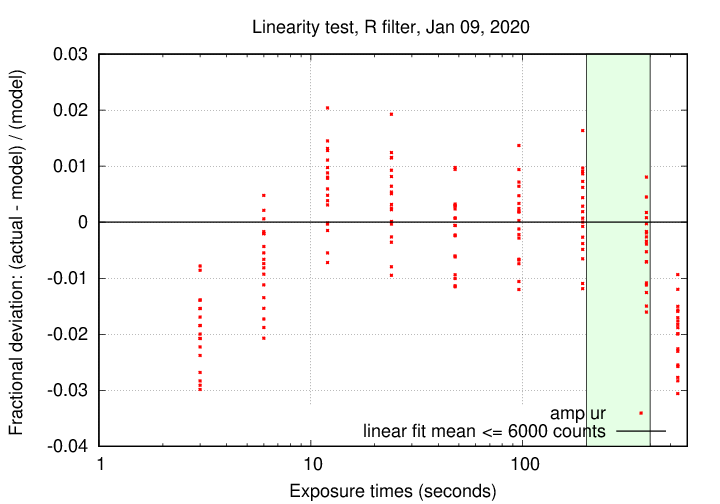
I ascribe the deviation at short exposure times = small levels as a shutter effect.