Executive summary: don't use exposure times shorter than 8 seconds if you want the best precision.
Contents:
On the night of UT 2016 Feb 16, Flynn Haase kindly took a series of flatfield images with varying exposure times to test the behavior of the shutter mechanism. Remember that the shutter is part of the WIYN 0.9-m shutter-plus-filter-wheel instrument; it is not part of HDI itself.
The images can be found on the HDI datastore on night 20160216. The images are:
c7434t0014_1.fits EXPTIME = 20.000 / [sec] Exposure time
c7434t0015_1.fits EXPTIME = 20.000 / [sec] Exposure time
c7434t0016_1.fits EXPTIME = 15.000 / [sec] Exposure time
c7434t0017_1.fits EXPTIME = 15.000 / [sec] Exposure time
c7434t0018_1.fits EXPTIME = 12.000 / [sec] Exposure time
c7434t0019_1.fits EXPTIME = 12.000 / [sec] Exposure time
c7434t0020_1.fits EXPTIME = 10.000 / [sec] Exposure time
c7434t0021_1.fits EXPTIME = 10.000 / [sec] Exposure time
c7434t0022_1.fits EXPTIME = 8.000 / [sec] Exposure time
c7434t0023_1.fits EXPTIME = 8.000 / [sec] Exposure time
c7434t0024_1.fits EXPTIME = 6.000 / [sec] Exposure time
c7434t0025_1.fits EXPTIME = 6.000 / [sec] Exposure time
c7434t0026_1.fits EXPTIME = 5.000 / [sec] Exposure time
c7434t0027_1.fits EXPTIME = 5.000 / [sec] Exposure time
c7434t0028_1.fits EXPTIME = 4.000 / [sec] Exposure time
c7434t0029_1.fits EXPTIME = 4.000 / [sec] Exposure time
c7434t0030_1.fits EXPTIME = 3.000 / [sec] Exposure time
c7434t0031_1.fits EXPTIME = 3.000 / [sec] Exposure time
c7434t0032_1.fits EXPTIME = 2.000 / [sec] Exposure time
c7434t0033_1.fits EXPTIME = 2.000 / [sec] Exposure time
c7434t0034_1.fits EXPTIME = 1.000 / [sec] Exposure time
c7434t0035_1.fits EXPTIME = 1.000 / [sec] Exposure time
c7434t0036_1.fits EXPTIME = 1.000 / [sec] Exposure time
c7434t0037_1.fits EXPTIME = 1.000 / [sec] Exposure time
c7434t0038_1.fits EXPTIME = 2.000 / [sec] Exposure time
c7434t0039_1.fits EXPTIME = 2.000 / [sec] Exposure time
c7434t0040_1.fits EXPTIME = 3.000 / [sec] Exposure time
c7434t0041_1.fits EXPTIME = 3.000 / [sec] Exposure time
c7434t0042_1.fits EXPTIME = 4.000 / [sec] Exposure time
c7434t0043_1.fits EXPTIME = 4.000 / [sec] Exposure time
c7434t0044_1.fits EXPTIME = 5.000 / [sec] Exposure time
c7434t0045_1.fits EXPTIME = 5.000 / [sec] Exposure time
c7434t0046_1.fits EXPTIME = 6.000 / [sec] Exposure time
c7434t0047_1.fits EXPTIME = 6.000 / [sec] Exposure time
c7434t0048_1.fits EXPTIME = 8.000 / [sec] Exposure time
c7434t0049_1.fits EXPTIME = 8.000 / [sec] Exposure time
c7434t0050_1.fits EXPTIME = 10.000 / [sec] Exposure time
c7434t0051_1.fits EXPTIME = 10.000 / [sec] Exposure time
c7434t0052_1.fits EXPTIME = 12.000 / [sec] Exposure time
c7434t0053_1.fits EXPTIME = 12.000 / [sec] Exposure time
c7434t0054_1.fits EXPTIME = 15.000 / [sec] Exposure time
c7434t0055_1.fits EXPTIME = 15.000 / [sec] Exposure time
c7434t0056_1.fits EXPTIME = 20.000 / [sec] Exposure time
c7434t0057_1.fits EXPTIME = 20.000 / [sec] Exposure time
As you can see, there are two images taken at each exposure time. The time is decreased from 20 seconds to 1 second, then increased again back to 20 seconds.
All images and subimages below are reproduced in the standard orientation: North up, East left.
I measured the mean value in the overscan region of the chip and subtracted that mean value from all pixels. No other processing was done to the raw images, except as noted below.
If the shutter (and chip) behaves perfectly, then there should be a linear relationship between the requested exposure time and the mean light level in the image. Let's check that now.
I created three small subsections within each image, each 100 x 100 pixels.
   box 1:    cr=666   cc=666     (southwest from center)

   box 2:    cr=1999  cc=1999    (center)

   box 3:    cr=3332  cc=3332    (northeast from center)
I computed the mean value within each box in each image. Thus, each image has 3 mean values. You can look at the data yourself:
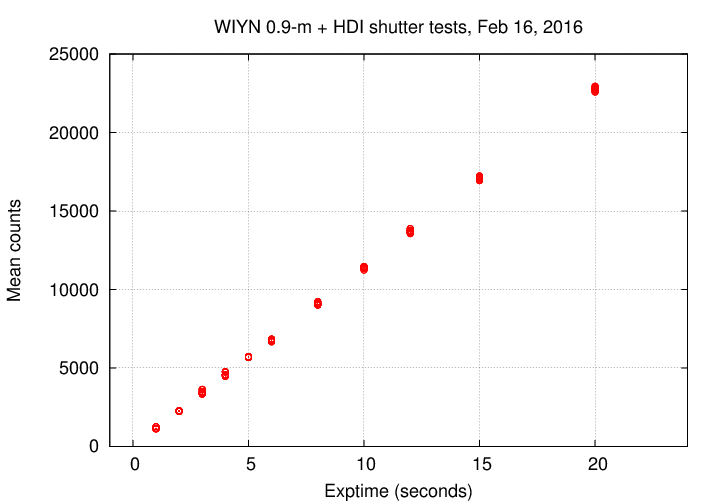
Here's a simple graph showing the mean intensity in each box as a function of exposure time.
Note that the pixel values in the longest exposures is only about 23,000 counts, which is below the region in which the response may become non-linear (as shown in Tech Note 8 ).
I then considered two sets of images which could be used to compute a linear fit between exposure time and mean intensity:
   "pure" set        images with exposure times  10 - 20  seconds

   "dirty" set       images with exposure times   5 - 20  seconds
For a perfect shutter mechanism, there ought to be no difference between these two datasets; but if the shutter fails to act perfectly at short exposure times, we would expect the "pure" set to provide a more linear relationship between exposure time and intensity.
For each set, I computed an unweighted linear fit to the measurements. There were 3 mean values per image, and 4 images at each exposure time, so a total of 12 measurements of intensity per exposure time.
#  set             fit                              syx      bconf        r
#
  pure     mean  =   37.86 + 1137.093*(exptime)    95.53    +/- 7.375   0.99976

  dirty    mean  =  -22.05 + 1140.776*(exptime)    82.84    +/- 3.667   0.99989
In the table above, "syx" is the scatter of the points within each set away from the fitted model, "bconf" is the 1-sigma confidence interval for the value of the slope, and "r" is the correlation coefficient.
What we really want to seek are deviations from a linear fit. So, in the graph below, I've computed the residuals of the FULL DATA SET (all exposures, from 1 second to 20 seconds) away from the linear models. The residuals are expressed as percentages of the predicted intensity.

We see that exposure times longer than 8 seconds show no increased residual from the fit, for either the "pure" or "dirty" model. On the other hand, exposure times less than 5 seconds have residuals with larger deviations from the model.
Conclusion 1: The actual exposure time starts to deviate significantly from the requested exposure time for requests less than 5 seconds.
There is another type of error which can be caused by an imperfect shutter. For very short exposure times, the shutter may move in such a way that it illuminates some portions of the detector for longer periods of time than other portions. For example, a shutter which has two rectangular sections which slide away from the middle when opening, then slide together when closing, will allow light to strike the middle of the detector for a longer period than the edges.
To check for this effect, I created "ratio images" in the following manner:
When I examined the resulting "ratio" images, I was unable to see any large-scale gradients due to the small-scale, pixel-to-pixel noise. Recall that the shortest exposures have mean pixel values of only about 1200 counts, so the Poisson noise will be relatively large.
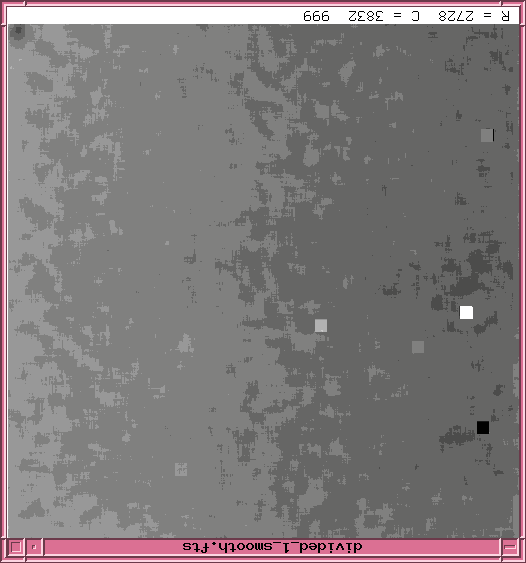
Therefore, I smoothed the images with a boxcar of size 100 x 100 pixels to reduce the small-scale noise and reveal large-scale structure. The mean value was still fixed at 1000 counts. I displayed the images with a linear grayscale colormap in which
   pure white   =   995 counts     (0.5% below mean)

   pure black   =  1005 counts     (0.5% above mean)
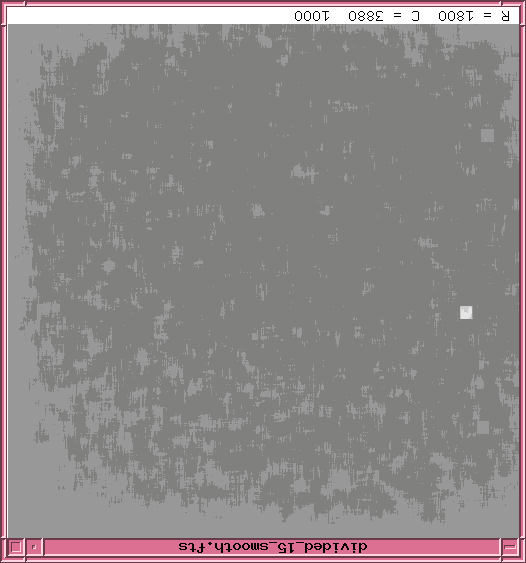
The images below show these "ratio" maps of smoothed intensity. Note that there is one bad pixel in the reference image, near the middle of the right-hand (West) edge of the chip, which causes an outlier in the map.
The 15-second ratio image shows a very slight pattern which looks similar to the raw flatfield pattern itself. There are only two colors in this map, aside from the outlier, representing smoothed values of 999 and 1000.
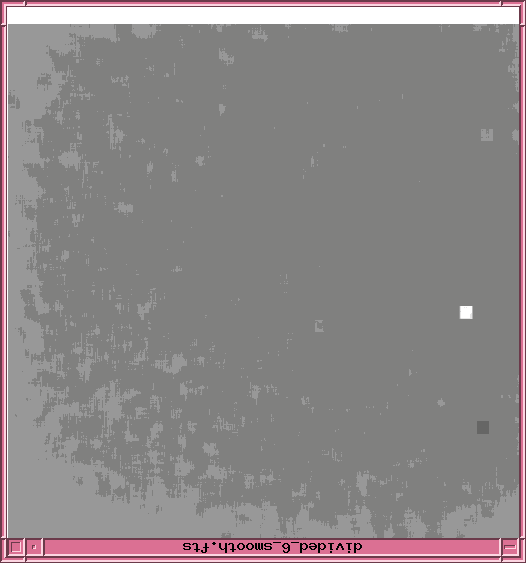
Following are the other "ratio" images in order: 12, 10, 8, 6, 5, 4, 3, 2, 1 seconds. Note that the final few images do start to show a horizontal gradient.
12 second ratio image is below.

10 second ratio image is below.

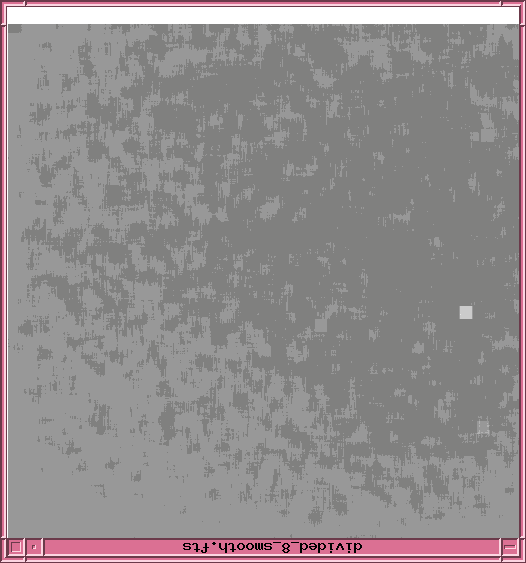
8 second ratio image is below.
6 second ratio image is below.
5 second ratio image is below.
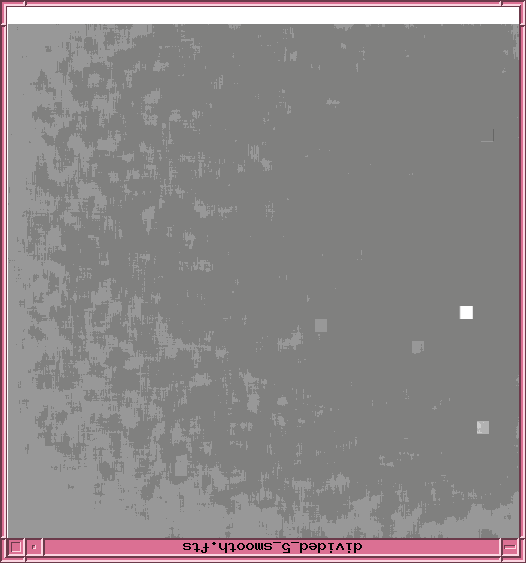
4 second ratio image is below.
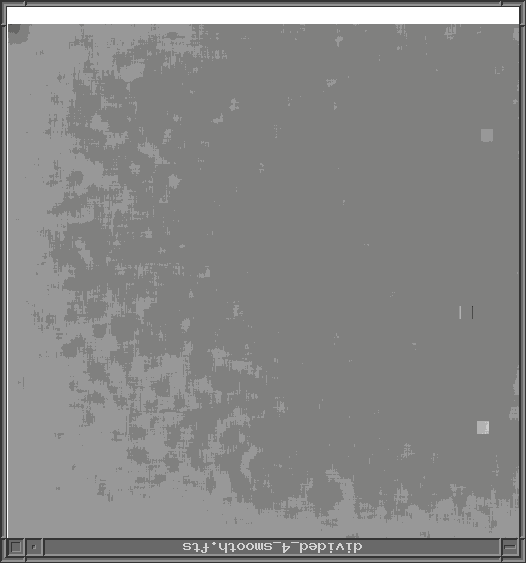
3 second ratio image is below.
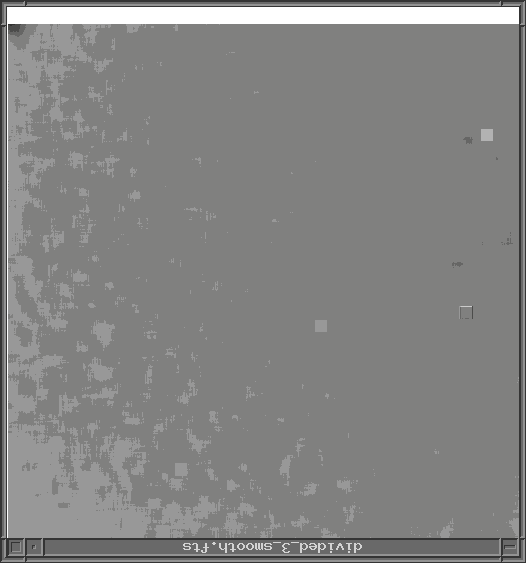
2 second ratio image is below.
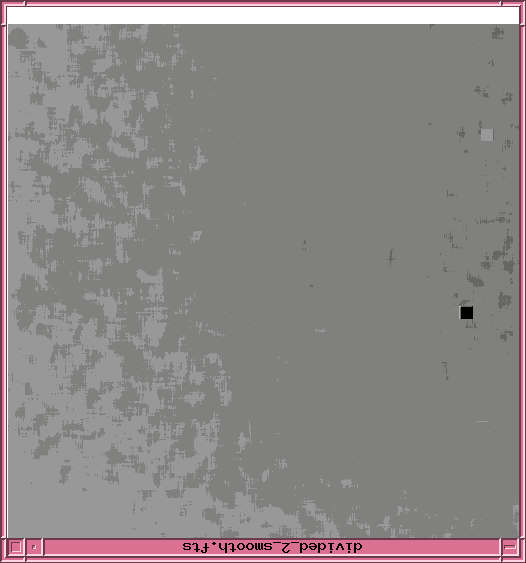
1 second ratio image is below.
Note that even in the 1-second ratio image, the gradient is very small: the colors in the map above range from 999 on the West (right) edge to 1002 on the East (left) edge. That means the gradient caused by shutter motions is at the level of 0.3%.
Conclusion 2: The shutter mechanism does not create any significant gradient across the the chip for exposure times less than 3 seconds.