I followed the methods described in earlier Tech Notes to process the data, starting with the raw "composite" FITS files, and ending with calibrated lists of stars. Using the machine pmdata, it takes very roughly 24 hours to process completely one night's data from 8 chips.
Once the data has been processed into the calibrated star lists and other files, it can be searched for transients within about 10 minutes; it takes another 10-20 minutes to check the resulting candidates by eye. I have written scripts to facilitate all these steps, including (as you will see in links below) creating tables with the properties and images of each candidate.
Please remember that the methods I am using explicitly will NOT detect single-frame events. In order to find such very brief flashes, one would have to write a new piece of software which would start with the calibrated starlists from each individual image and look through them. I have not done that yet.
In order to place limits on the rate of transient objects, one needs to know the combination of area and time covered by a search. I have chosen to use the units:
"control time" = (area in square degrees) * (time in seconds)
Thus, an area of 1 square degree, monitored continuously for one hour, would yield a "control time" of 3600 sq.deg.*sec.
A critical factor in these calculations is the limiting faintness, which describes the faintest object which could have been discovered. In the case of a brief transient, this is better described as a fluence, rather than as the typical flux limit. Fluence is simply the integral of flux over time; it can be expressed as energy received within a certain area, or as the number of photons detected within a certain area.
In the case of this Tomoe data, each image has an exposure time of 0.5 seconds, and my search parameters required that an object appear in at least 3 images. Thus, the minimum fluence an object must have can be calculated as follows:
In other words,
   Fluence limit F(min)  =   f * (exptime) * (min_det)

 where

                 -0.4*m      (          -6                   )
         f  =  10         *  ( 3.16 x 10      erg/cm.sq.-sec )
                             (                               )
The second term in the lower equation is the zeropoint of the V-band magnitude scale: the flux corresponding to a star of magnitude V=0.
How to determine the limiting magnitude of each image? I used a single value for all the images in a single chunk (360 images over 3 minutes), defining it using the magnitude at which stars were detected in 50% of the images; see Tech Note 4 for examples.
Now, it is easy to see very bright transients: they will appear even if there are light clouds. But faint transients will be detected only when conditions are very good. We can therefore expect quite different "control times" for different choices of minimum Fluence.
For ease of discussion, I chose 4 minimum Fluence values, corresponding to the Fluence provided by stars of various magnitudes during a 1-second exposure. It will be useful to use this term when comparing to other searches, which will typically quote a magnitude limit during one of their own much longer exposures.
Here are the total control times for these choices of limiting Fluence.
        Summed "control times",
           in units of (square degrees * seconds)

                  limiting mag in a 1-second exposure
  Night         V=13      V=14      V=15      V=16
  -----------------------------------------------------
 20160411      36,771    34,252    28,888    14,843

 20160414      28,216    25,715    20,015       128

   total       64,987    59,967    48,903    14,971
  -----------------------------------------------------
Note several things:
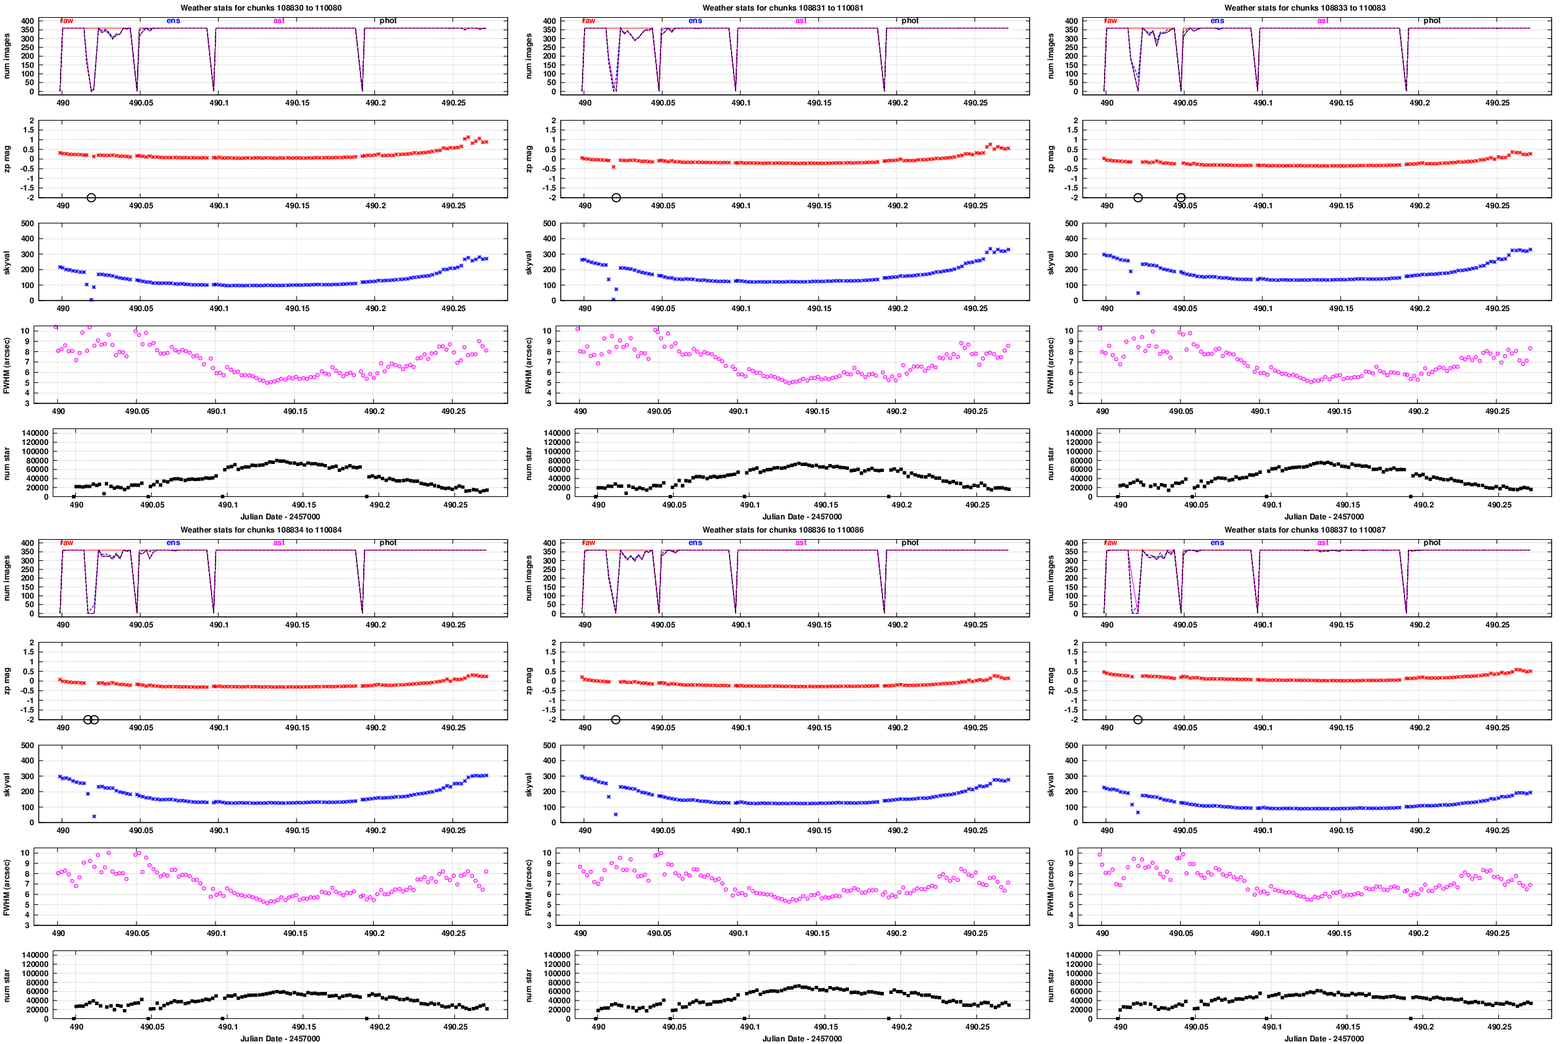
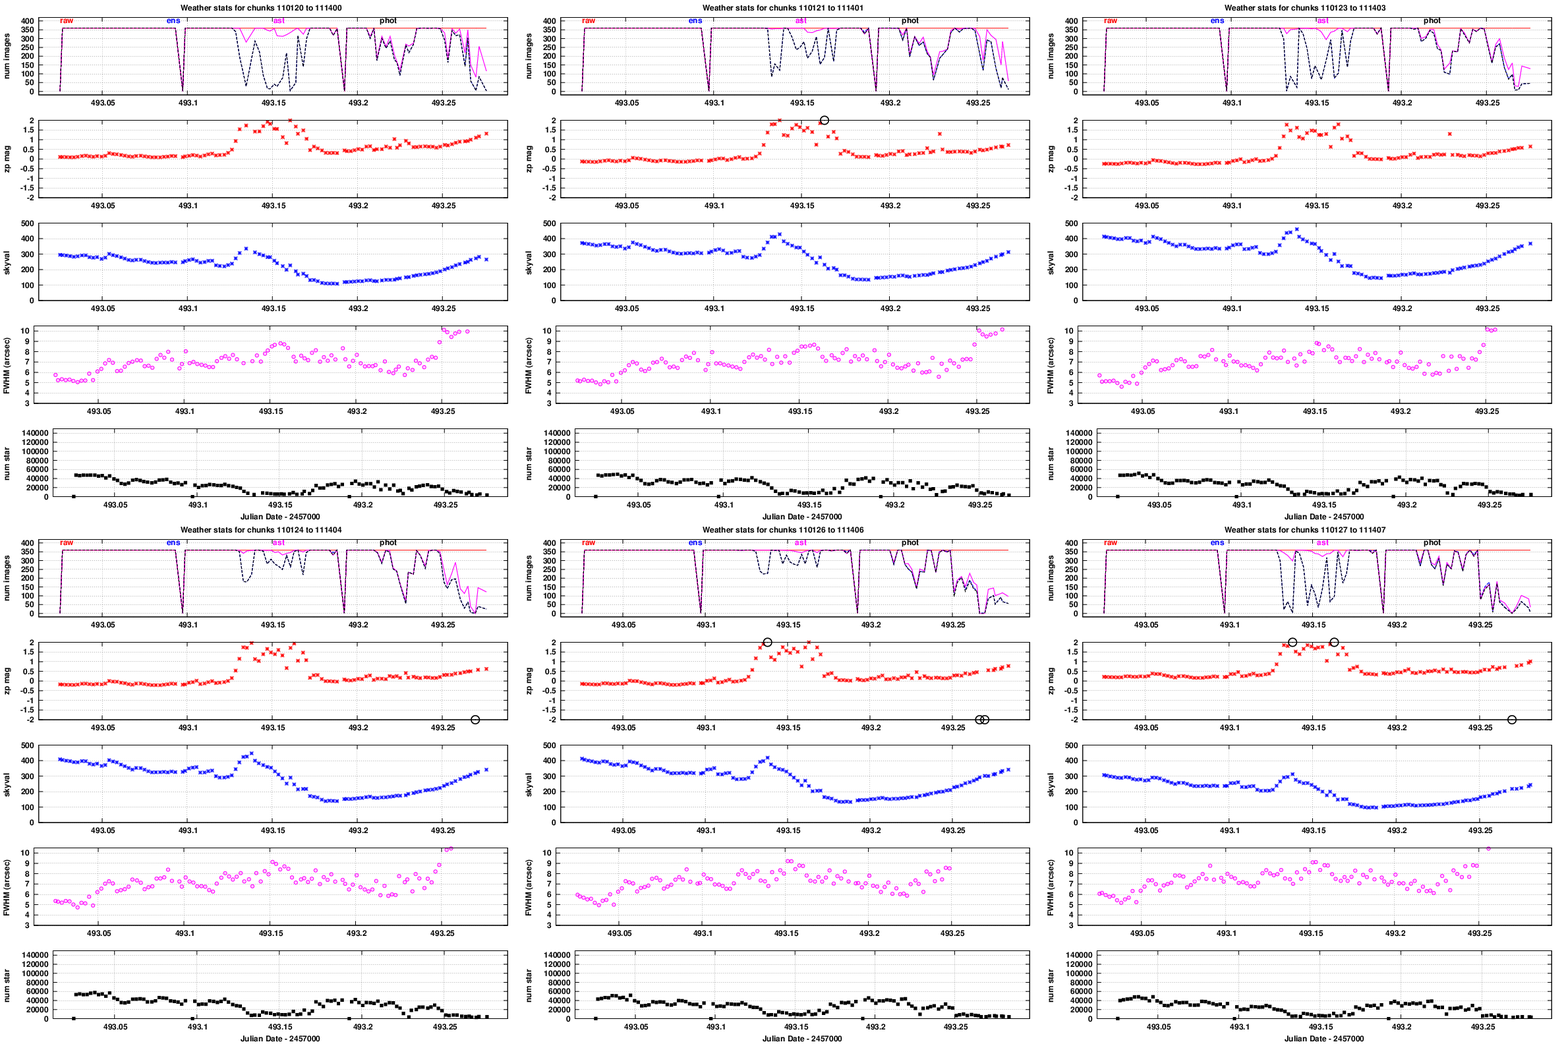
Below are animated GIFs showing the overall properties of each night. The figures cycle through the measurements from all 8 chips, and repeat endlessly.
The night of 20160411 was pretty good: the seeing wasn't very good at the start and end, but most of the night was nice.

The night of 20160414 was not as nice. Clouds were present in the middle of the night, so few stars were measured during that time.

You can find tables listing the candidates for each night, with numerical values of RA, Dec, mag, etc., and pictures of the objects, at the following links. Each candidate has little pictures of it showing the image before it was detected, all the images in which it was detected, and finally the image after it was detected. So, a transient found in 4 images will have 6 pictures: (1 before, 4 detections, 1 after).
Here are the parameters used to select these candidates:
Using these parameters, I found a total of 4 candidates during the night of 20160411, and 16 candidates during the night of 20160414. I inspected all the candidates by eye. Most of them were real, faint stars, present in Digitized Sky Survey images and big catalogs. A few were relatively bright stars which, in bad seeing, were occasionally detected at a large enough offset from their usual position that the software counted it as a "new star."
None of the objects were real transients.