One of the parameters controlling the output of the Tomoe pipeline is
The pipeline first looks at each image individually, and finds all objects which lie above a certain threshold in that image. Later, it compares the objects detected in different images, matching them up. Only objects which are detected in at least star_cut images are included the photometric ensemble analysis.
What do we expect?
It seems like a good idea to keep this value high -- that will produce only real stars, with no contamination. However, if one is looking for transient objects in the ensemble output
the pipeline does save all detections in output files, even those discarded from the ensemble analysis, so one can go back to look at them laterthen the value of star_cut affects the type of transients which can be found. For example, if star_cut = 10, than any transient which appears for only 3 or 5 frames will be discarded.
In my initial tests, I set star_cut = 10 as a very conservative value; that should produce no "junk" objects, only real stars. But I have decreased the value after running tests. Let's compare two possible values here:
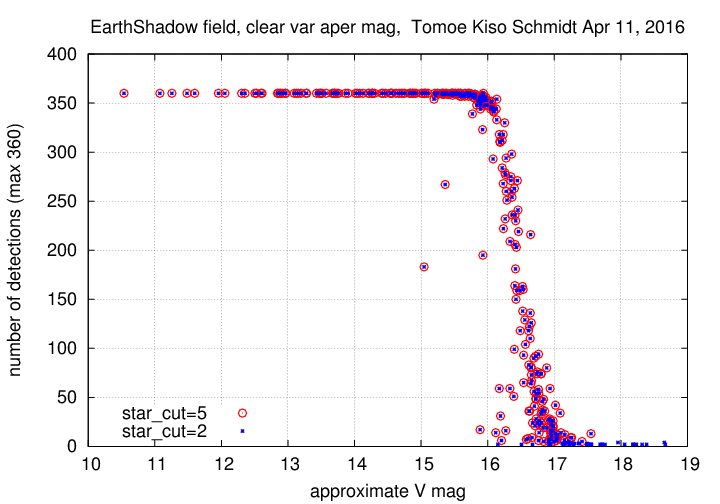
First, let's look at the results from just one chunk of data: chunk 109330, which was taken during good conditions.
This shows the expected pattern: bright stars are detected 360 times, and faint stars fewer times; the very faintest stars are rarely detected. In this graph, red circles mark the objects when star_cut = 5, and blue dots the objects when star_cut = 2. The differences appear ONLY FOR THE FAINTEST STARS.
Let's zoom in on the faintest stars:
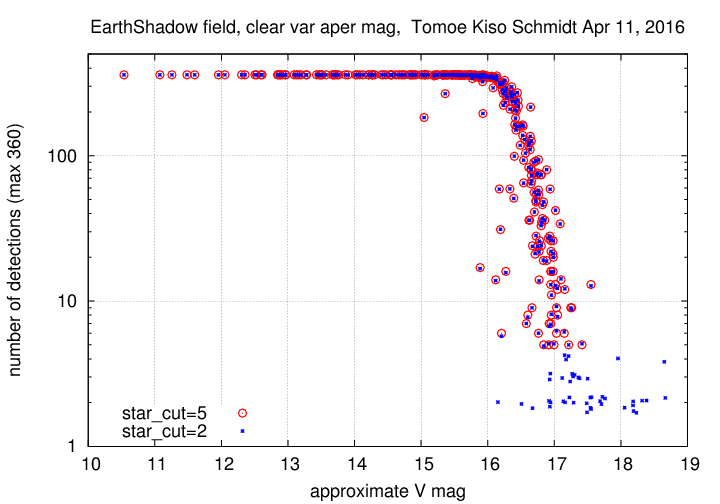
Now it is clear that using star_cut = 2 does send more very faint objects through the pipeline into the output. In this particular chunk of data, all these objects are very faint.
There are no bright objects detected only 3 or 5 or 10 times. That means that there are no bright transient objects that remain bright for
2 ≤ num_det ≤ 20 (or 50, or 100) images
That was easy!
If we lower the value of star_cut, then we include more stars in the ensemble analysis, and in all the stages of the pipeline after the ensemble (most of which involve calibrating the results astrometrically and photometrically).
Lowering the value will help us to find brief transients -- but will it take too much time?
To answer that question, I ran the pipeline on a large set of data: Tomoe chunks 0109000 - 0109390, taken during a 2.5-hour period on UT 2016 Apr 11 = JD 2,457,490. The computer used was my laptop, a late 2011 MacBookPro; there may have been small differences in the processes in the background during the two runs.
I ran the pipeline using two values star_cut. All the numbers below are average values for 38 chunks (2 of the 40 chunks had very little data).
                       star_cut = 5                star_cut = 2
----------------------------------------------------------------------------

time required for

  split 3D FITS            80 sec                      80 sec

  subtract bias           100                         100

  find stars               76                          76

          ...........  star_cut enters here  ......................

  run ensemble             25                          26

  calib_ensemble            3                           3

  do_calib_phot            42                          48


number of stars
in ensemble               186                         232


-----------------------------------------------------------------------------
As you can see, lowering the value of star_cut from 5 to 2 does not increase greatly the number of stars which are included in the ensemble, nor does it greatly increase the execution times of the pipeline. The most time-intensive sections of the pipeline, in fact, all occur BEFORE the ensemble analysis, and so aren't affected by this parameter at all.
The ensemble output provides one means to define the "limiting magnitude" of a chunk of Tomoe data. If we examine the number of detections as a function of magnitude, we see the usual pattern: bright stars are detected in every image, faint stars in few. If we use the brightest stars to define the "maximum number of detections" in chunk
this number may be fewer than 360, because some of the images may be empty or suffer from clouds, etc.
then we can watch as the number of detections decreases as the stars grow fainter. We can define the "limiting magnitude" as the magnitude at which the number of detections reaches HALF the maximum.
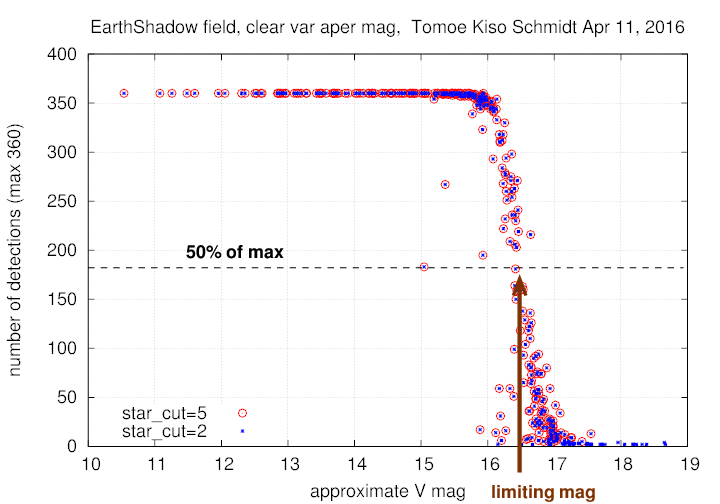
In the case of chunk 0109330, for example, the limiting magnitude is about V = 16.4.
Suppose we have some algorithm for finding transient sources in the pipeline output. What will happen if we change the star_cut value? Well, that depends on the exact nature of the algorithm, but let's take a look at one example.
The following is a "toy" algorithm for finding transient objects. It is NOT a good one. It simply finds stars which are detected in relatively few images in a chunk, but which are not very faint.
    For each star in ensemble

        if (detected in > 20 images)
                    FAIL

        if (ensemble "average" mag > limiting_mag)
                    FAIL

        SUCCESS
The results of this method are shown in the graph below. Red symbols correspond to a conservative value star_cut = 5, and blue symbols correspond to a low value star_cut = 2.
![]()
The top panel shows tha the limiting magnitude decreased as time passed -- so conditions were improving; the increase was about 1.5 magnitudes, which is pretty large. There is no significant difference between the determination made when star_cut changes, which is good.
The middle panel shows the number of stars in the ensemble, not just the candidates. Lowering the star_cut threshold causes more stars to be included, so the blue symbols show larger numbers of stars; some of them may not be real.
The bottom panel is the important one. It shows the number of candidate transient objects in each chunk. Two things to note are: