 Copyright © Michael Richmond.
This work is licensed under a Creative Commons License.
Copyright © Michael Richmond.
This work is licensed under a Creative Commons License.
You may recall from our earlier discussion
that the simple, circular orbit of gas in the disk of the Milky Way allows us to estimate the mass of all the stars and dust and dark matter INTERIOR to the measurement:

Let's repeat our earlier calculation, to refresh our memories of the mass of this inner region of the Milky Way.
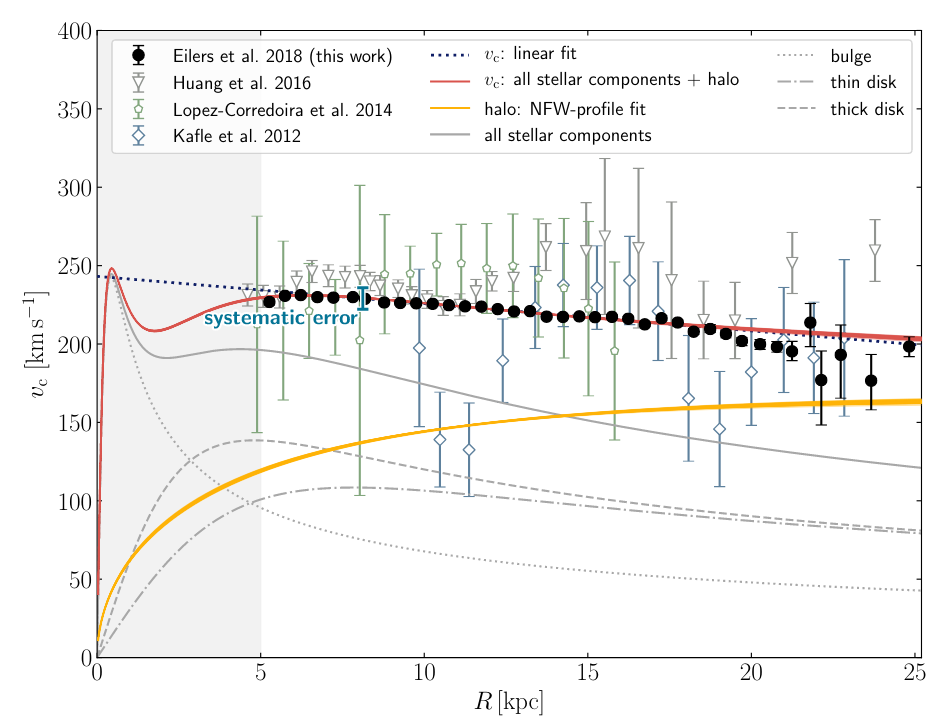
Figure 3 taken from
Eilers et al., ApJ 871, 120 (2019)
Q: What is the mass interior to R = 10 kpc?
As we saw a few lectures ago,
among the billions of stars in our Galaxy are a very few which are flying through space much faster than the rest. These high-velocity or runaway stars must have been accelerated to their enormous speeds by some violent mechanism, involving either a supernova explosion or a three-body encounter with a black hole.
Astronomers who study the motions of very large numbers of stars can determine the maximum possible speed a star can have at some location in the Galaxy before it, too, would escape entirely. In other words, with a large enough sample of stars, we can estimate the local escape velocity.
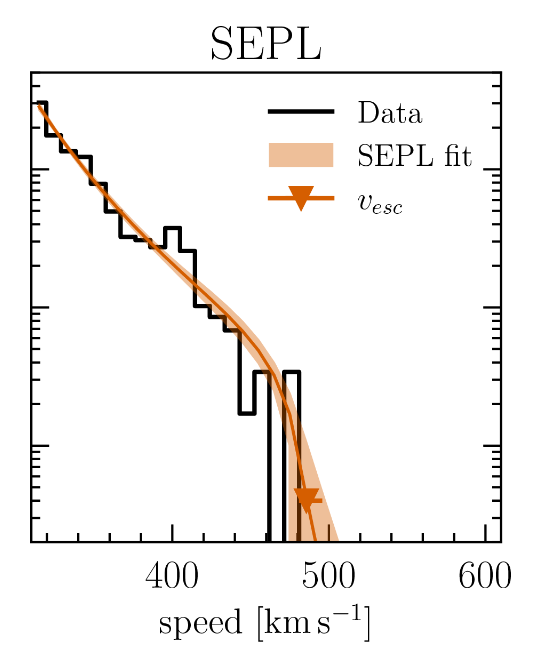
Figure showing the distribution of stellar velocities
in a radial bin from 8-9 kpc, taken from Figure 3 (right panel) of
Roche, C., et al., ApJ 972, 70 (2024)
If a star does have this escape velocity, then its total energy must be zero.

One such study,
finds that in the solar neighborhood, the local escape velocity is roughly
       R       =  8.3 kpc

       v(esc)  =  528 km/s


    Q:  What is the mass interior to this radius?
We can see globular clusters in all directions around our Galaxy, though they are harder to detect behind the disk and bulge.
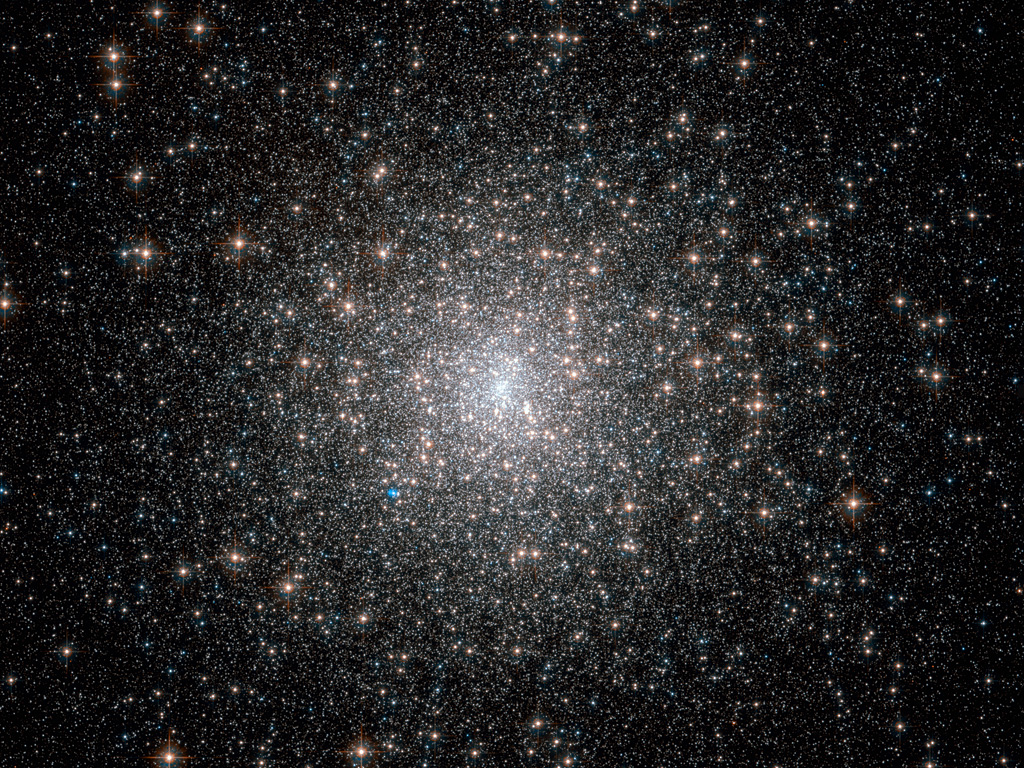
Image of M15 courtesy of
ESA/Hubble & NASA
Astronomers have spent many years carefully measuring the distances and velocities of these clusters. Unfortunately, unlike the gas in the disk, these object do NOT (generally) have simple circular orbits; most are highly elliptical, which makes computing the mass of the Milky Way more difficult.
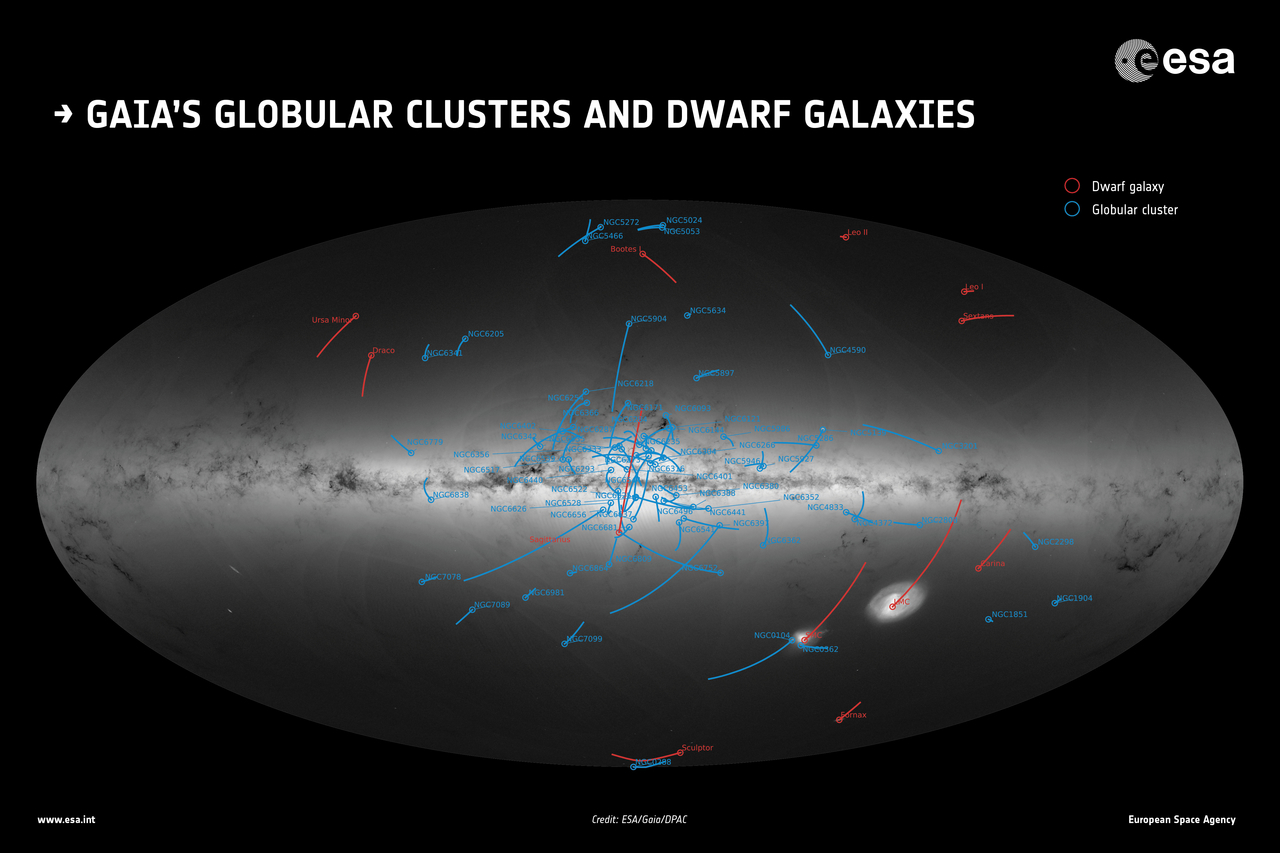
Image courtesy of
ESA/Gaia/DPAC
Still, a few of them have roughly circular-ish orbits -- good enough for our purposes. I've chosen from a few from the collection of Sun, G-C., et al., Research Astro. Astrophys., 23 (2023) , and listed their properties below. Let's try computing the mass interior to each one.
    Cluster         R (kpc)     velocity (km/s)
---------------------------------------------------------

    47 Tuc           7.5           186

    Pal 1           17             211

    AM 4            25             238

    Pal 3           98             158

---------------------------------------------------------
Sun et al. use their measurements of many globular clusters, together with a more sophisticated analysis of their orbital motions, to determine the mass of the Milky Way as a function of radial distance. They find it rises slowly .. how do their estimates agree with ours?
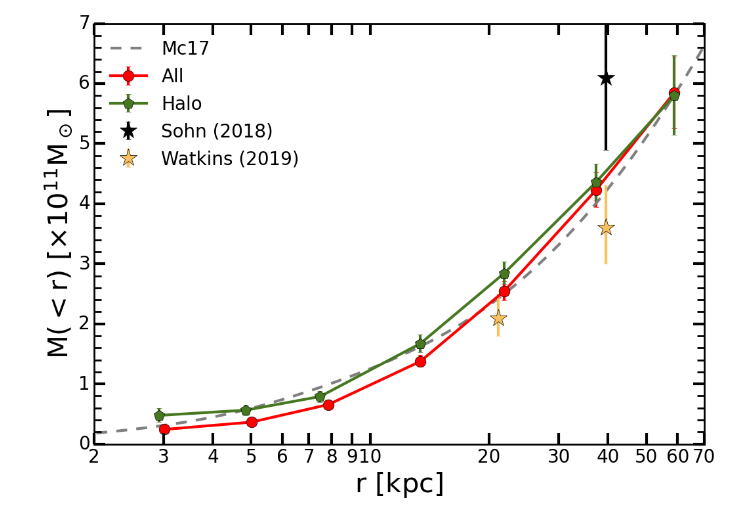
Figure 11 taken from
Sun, G-C., et al., Research Astro. Astrophys., 23 (2023)
Just as the Sun has a dozen or so large satellites and hundreds and thousands of small ones, the Milky Way Galaxy has satellite galaxies of its own. We'll discuss how they can be used to measure the mass of the Milky Way in a moment -- but first, let's take a closer look at a few.
In some cases, satellites are obvious. In the picture below, we can see two small companions of the Andromeda Galaxy.
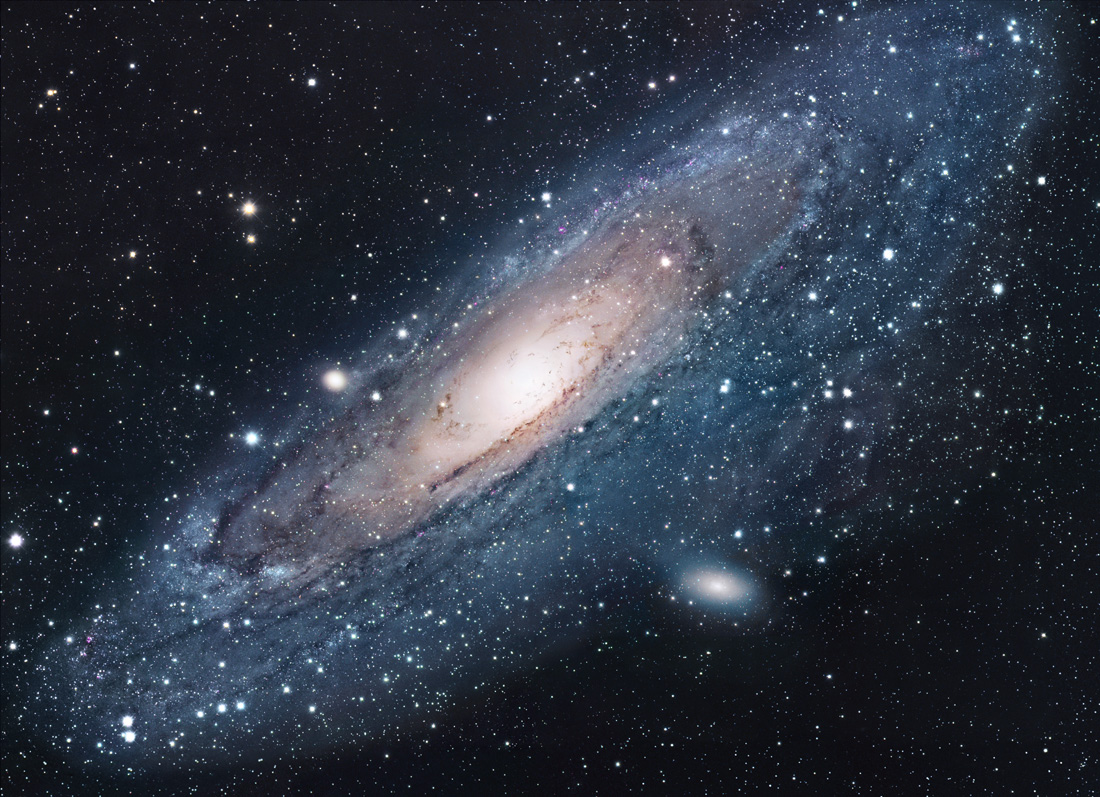
Image of M31 and its satellites courtesy of
Robert Gendler and
Astronomy Picture of the Day
But most of the Milky Way's satellites are a bit harder to see. Use the Aladin Lite website and give it a try.
  Q:  Can you find each of the following satellites of the Milky Way?

        a) Pegasus dwarf:  00:42:44.3   +41:16:07

        b) Sextans B:      10:00:00.0   +05:19:42

        c) Leo IV:         11:32:57.0   -00:32:00
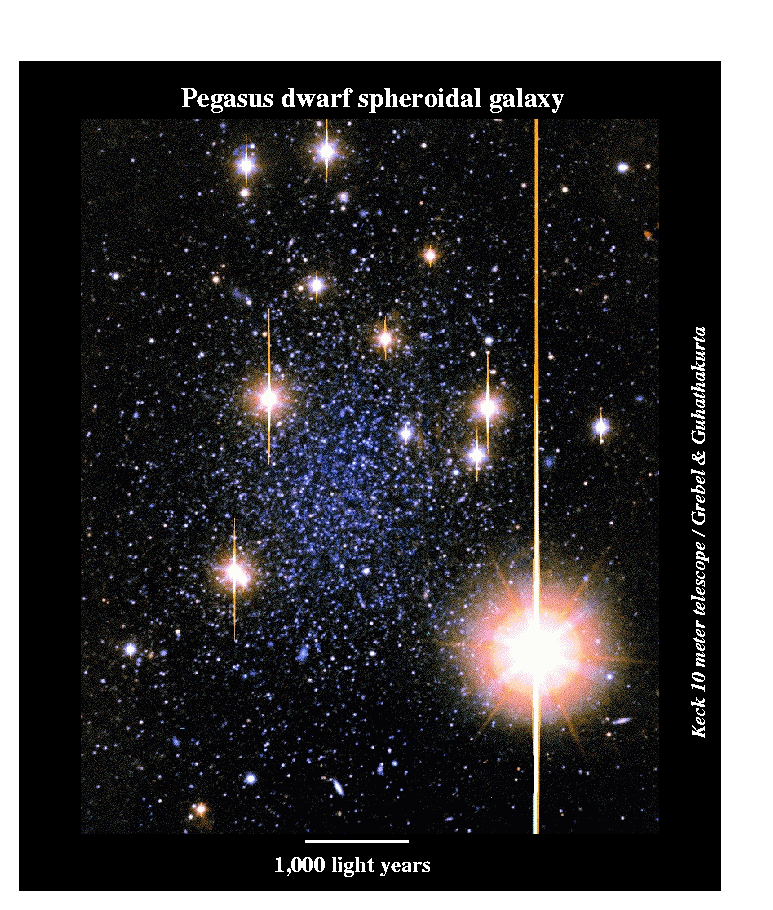
Image of Pegasus Dwarf courtesy of
E. Grebel and P. Guhathakurta and
Astronomy Picture of the Day
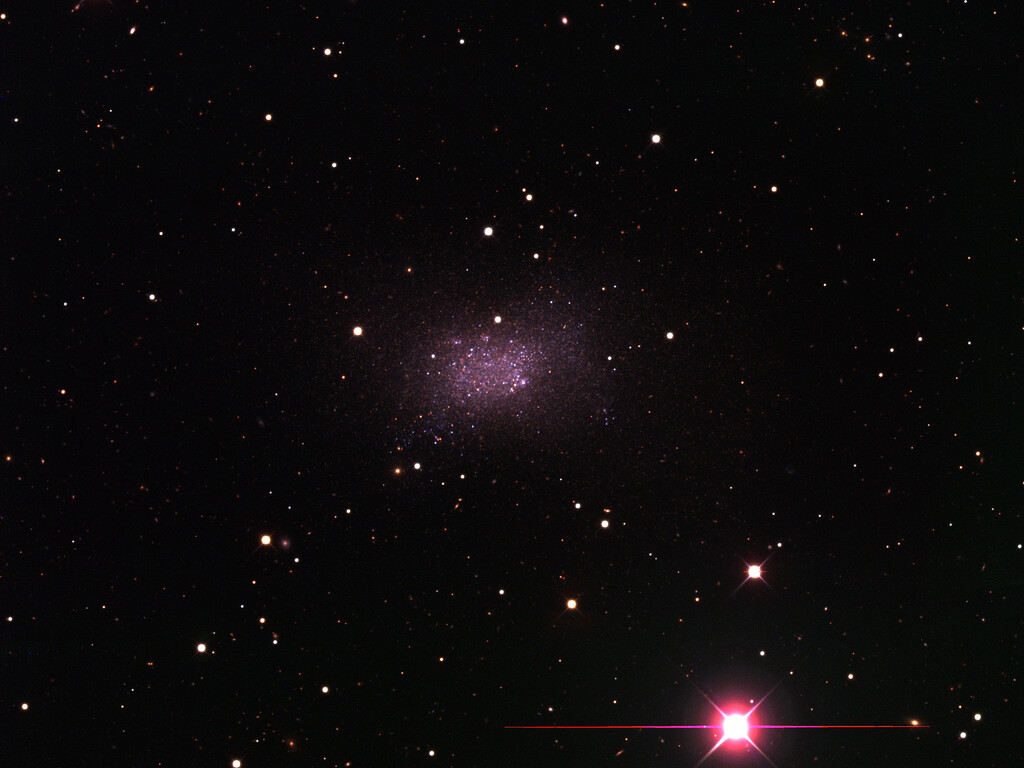
Image of Sextans B courtesy of
P. Massey/Lowell Observatory and K. Olsen/NOIRLab/NSF/AURA/
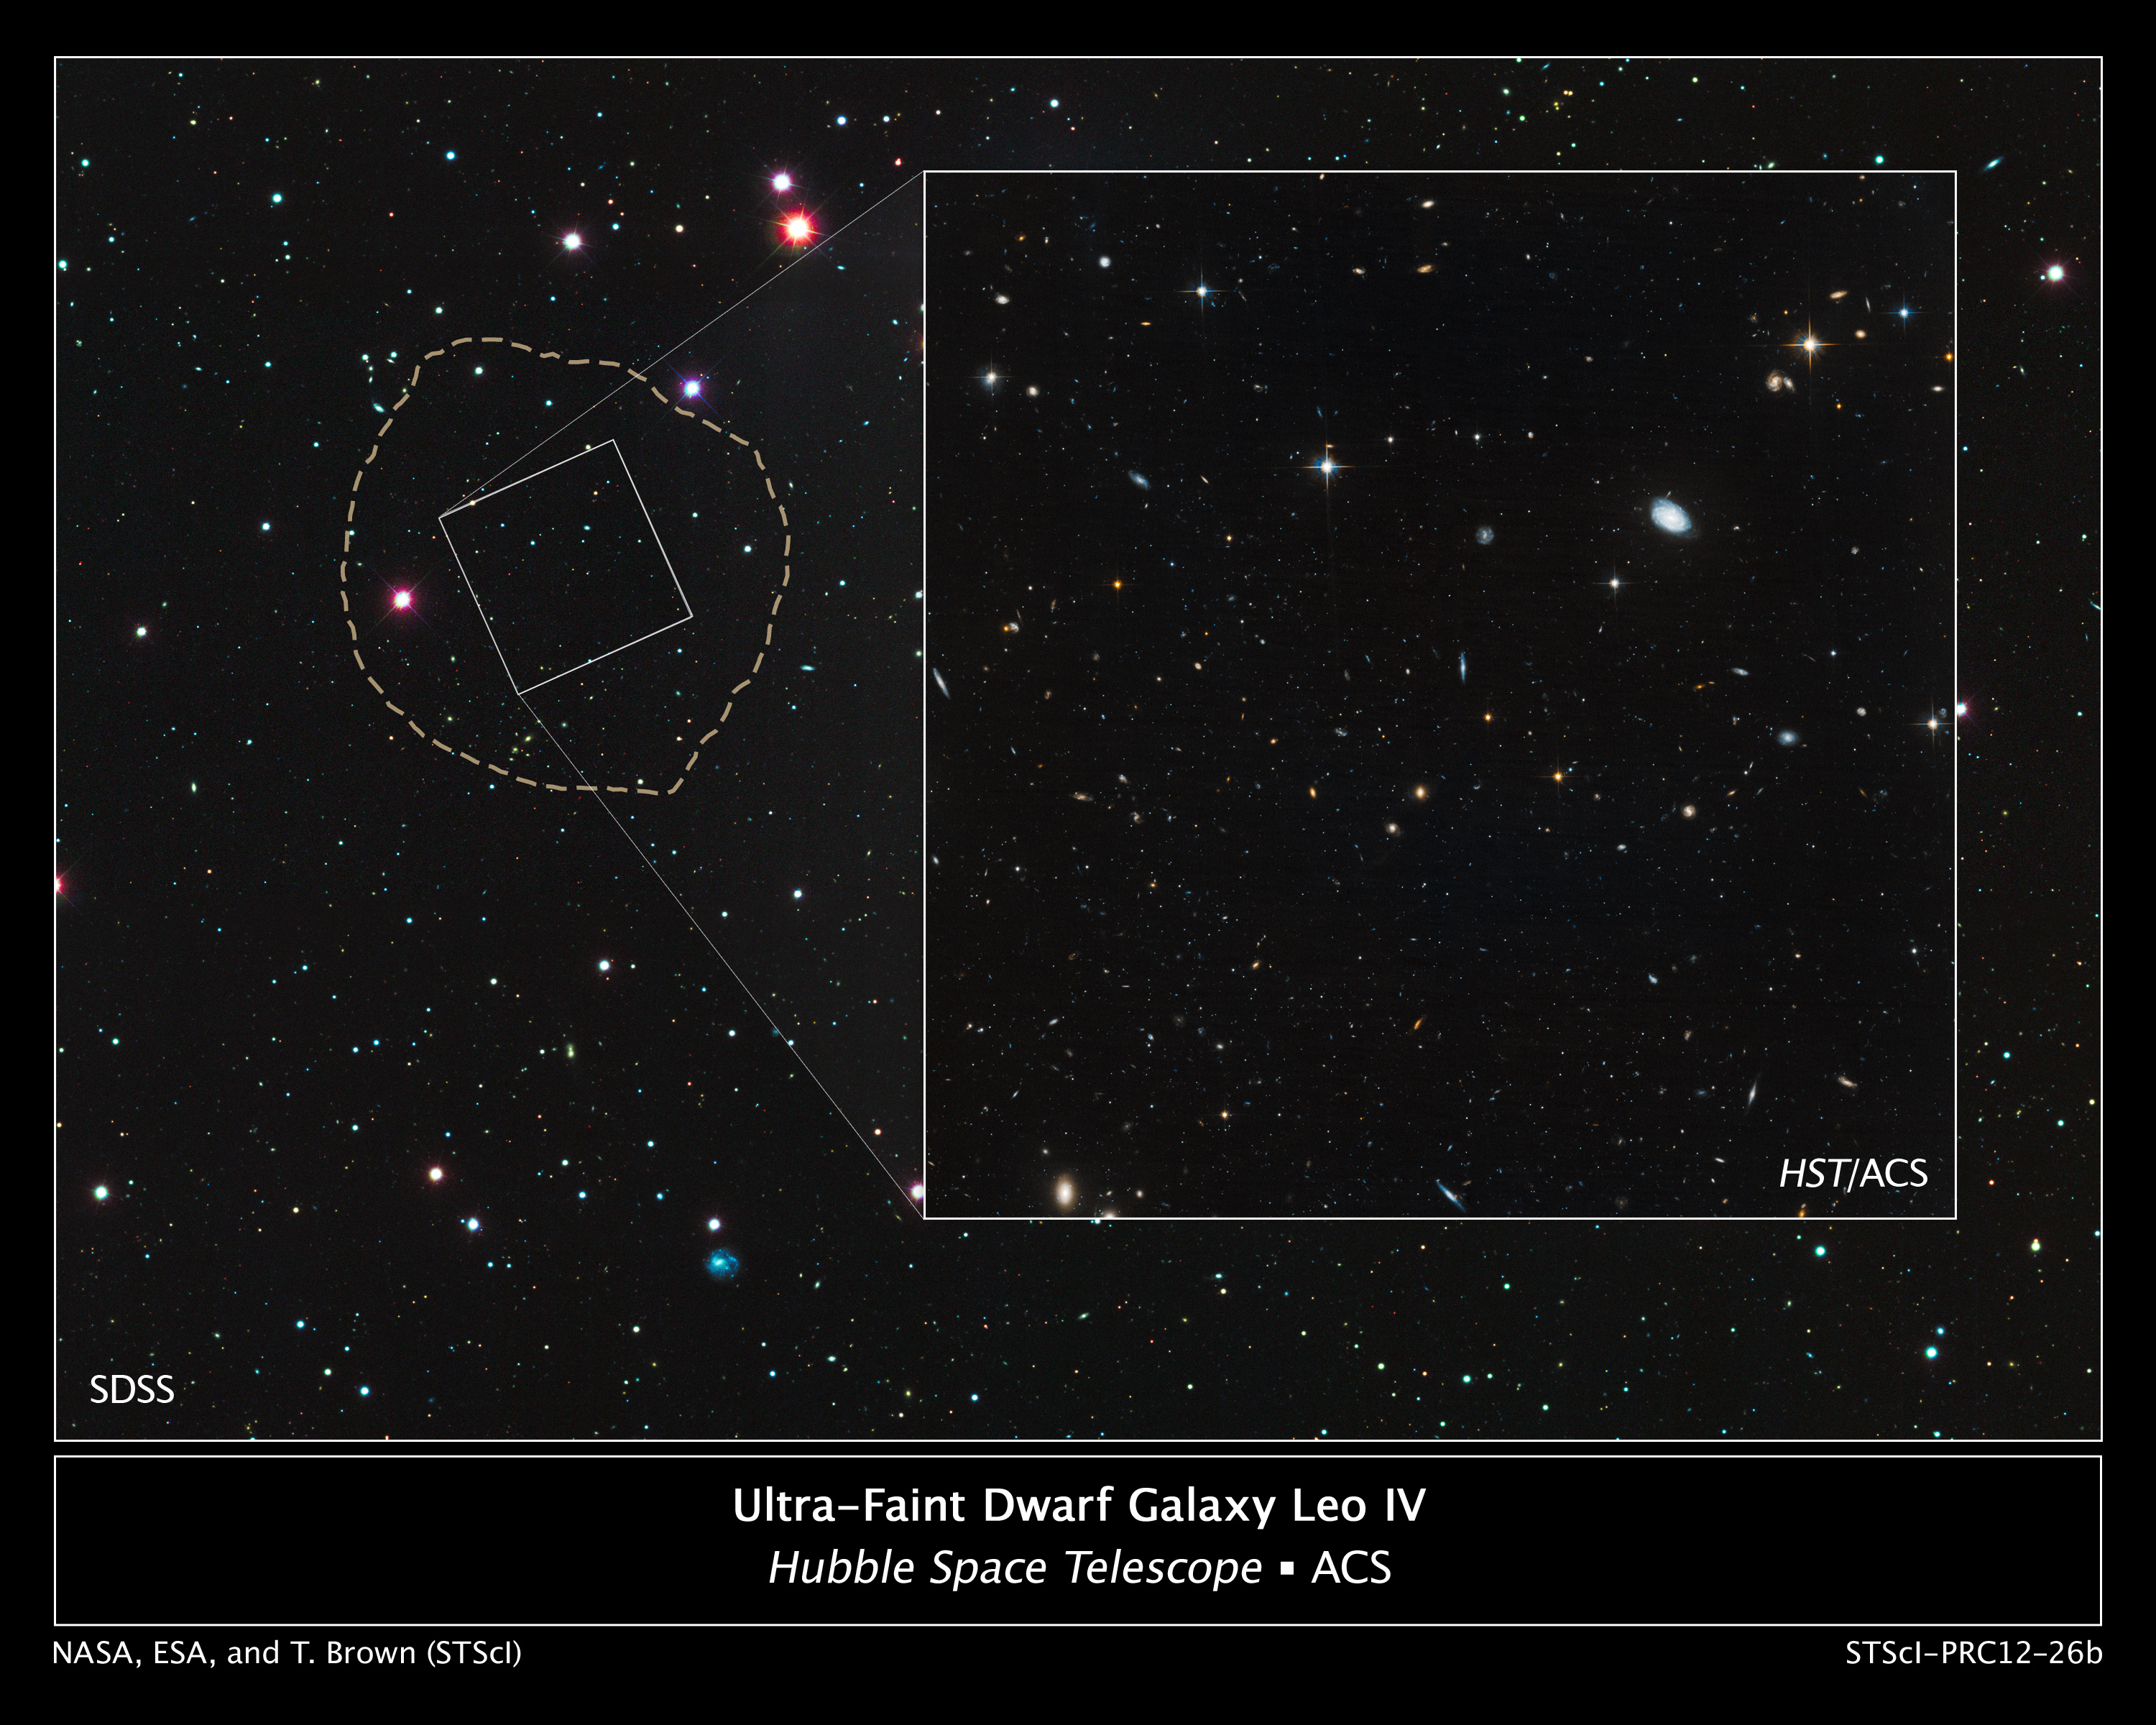
Image of Leo IV courtesy of
NASA, ESA, and T. Brown
Okay, so suppose that we can find a bunch of satellites which orbit the Milky Way. How exactly can we use these little siblings to determine the mass of our Galaxy? There are a number of approaches, all of which involve measuring the positions and velocities of each satellite.
One method is known as the Spherical Jeans Equation. Do you remember the Jeans Mass? We used this technique to estimate a critical size of an interstellar cloud of gas -- the size at which the cloud becomes unstable to collapse. The basic idea was to start with the criterion for a cloud of self-gravitating particles to maintain itself in a stable equilibrium:

Now, in the case of a cloud of gas particles, the kinetic energy of the particles can be calculated using their temperature:

But we're interested in little galaxies orbiting the Milky Way. In this case, the "gas" is actually made of galaxies: each satellite is like an atom of the gas cloud. Therefore, it makes sense to compute the kinetic energy of the "gas" using a macroscopic approach:

As long as the galaxies are roughly uniformly distributed through space, we can use the same equation to compute their gravitational potential energy:

So, putting the pieces together, if we assume that the satellite galaxies around the Milky Way are now, and have been for some time, distributed in a roughly stable distribution, then we can find a relationship between their kinetic and gravitational potential energies.

By measuring the velocities and positions of the satellite galaxies, we can figure out the mass M of the entire system -- most of which will reside in the Milky Way and its invisible halo.
This technique, and a similar one referred to as the "Distribution Function", or "DF" for short, yield similar results for the mass of the Milky Way.
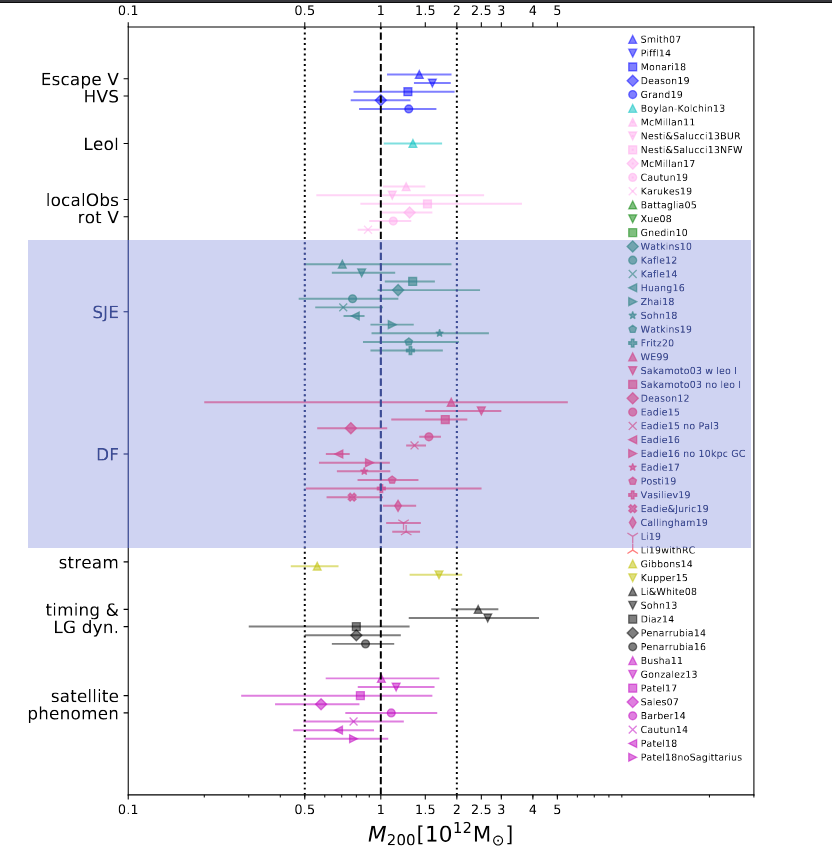
Figure 1 taken from
Wang, W-T. et al., Science China Physics, Mechanics and Astronomy,
63, 109801 (2020)
When we examine all the various methods of estimating the mass of the Milky Way, we find that they yield larger and larger values the farther out we look.
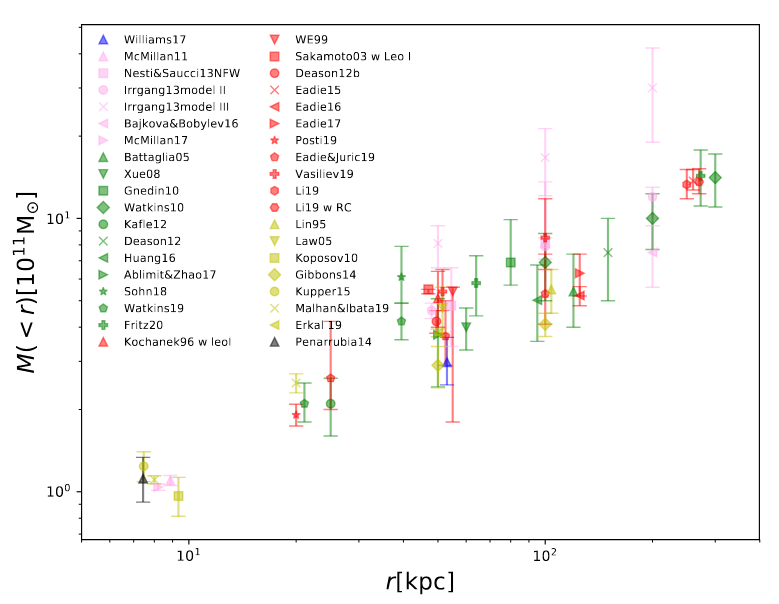
Figure 2 taken from
Wang, W-T. et al., Science China Physics, Mechanics and Astronomy,
63, 109801 (2020)
It's a bit disturbing that the estimates don't appear to show the mass "flattening out" at the largest radii. The problem is that we just run out of tracers which can help us to detect our Galaxy's gravitational influence.
Still, at some point, the Milky Way must come to an end. After all, it can't keep extending out beyond, say, the halfway point to the Andromeda Galaxy, our largest nearby neighbor.
   Q:  Roughly how far away is the Andromeda Galaxy, in kpc?

   Q:  Compute half that distance.  Where would that "halfway" point
           lie in the diagram above?
A recent review of many different methods, applied by many different astronomers, found that -- fortunately! -- most of the estimates of the Milky Way's total mass did agree with each other (at least to within a factor of two or so). The value is even a nice, round number, easy to remember: Mass of Milky Way = 1012 solar masses.
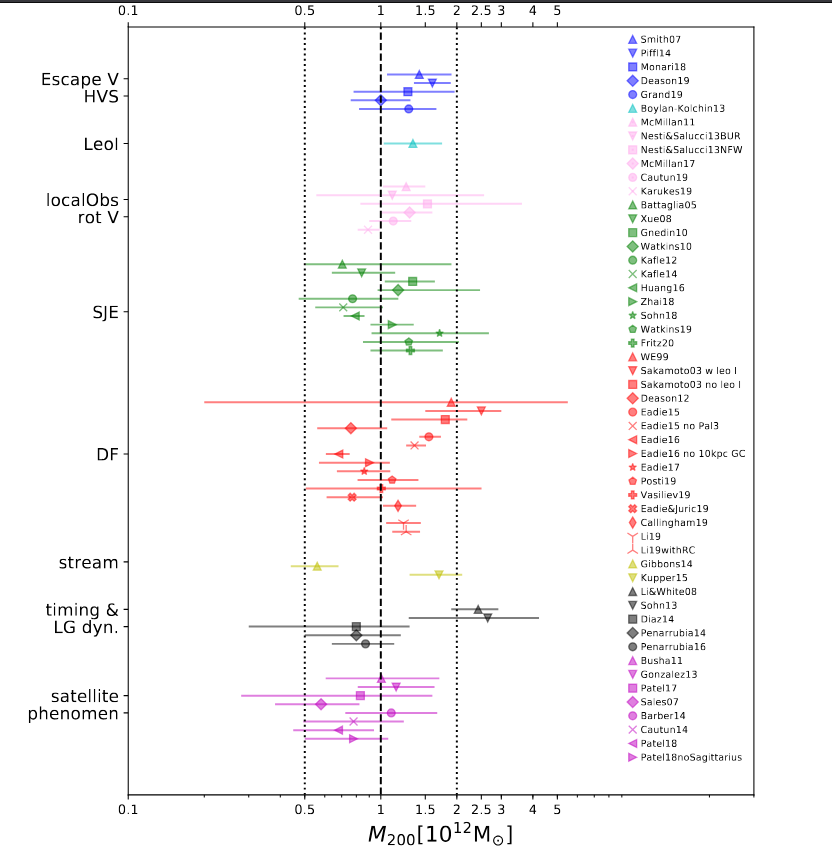
Figure 1 taken from
Wang, W-T. et al., Science China Physics, Mechanics and Astronomy,
63, 109801 (2020)
Hmmm. The Milky Way is large and massive, and the Andromeda Galaxy (M31) is also large and massive. They are relatively close to each other. It is possible that they might collide?
Well, it depends a bit on whom one asks -- and when one asks.
Here's a headline from 2012 ...
2012 headline from
NASA Hubble Mission Team
... and here's a more recent one.

2025 headline from
Universe Today
We've known for over one hundred years that the Andromeda Galaxy is unusual: the great majorities of galaxies are flying AWAY from us at high speed -- carried by the expansion of the universe -- but Andromeda is actually coming TOWARD the Milky Way.
  Q:  Why is Andromeda approaching us?  Why isn't it being carried
         away by the expansion of the universe?
Right -- because of the gravitational force between Andromeda and the Milky Way. We believe that, long ago, the two galaxies were moving apart, but over time, their mutual attraction overcame this recession and caused them to start to fall together. Astronomers can make models of these galaxies over the history of the universe, using a range of parameters for their properties, and compare their simulations to our observations of their current positions and velocities. This comparison is often called the Timing Argument, or "TA" for short.
The diagram below shows two possibilities for the separation of our Galaxy and Andromeda over the age of the universe. "PE" stands for "Previous Encounter," in which the two galaxies swept past each other at some point in the past. Note that both scenarios end with the two galaxies a distance 0.76 Mpc = 760 kpc apart at the current time, just as we observe.
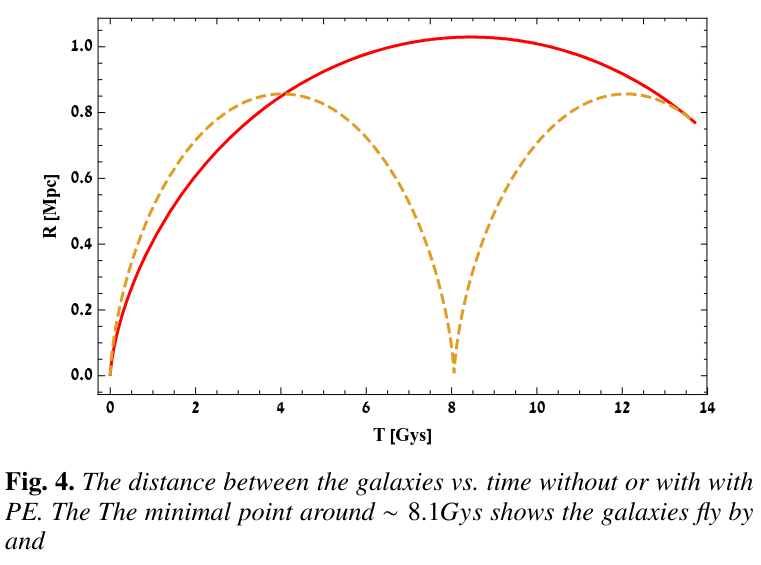
Figure 4 taken from
Benisty, D., A&A 656, A129 (2021)
Running these simulations help us to estimate the total mass of the Local Group. Note that the total mass must be considerably larger in the case of a previous encounter ...
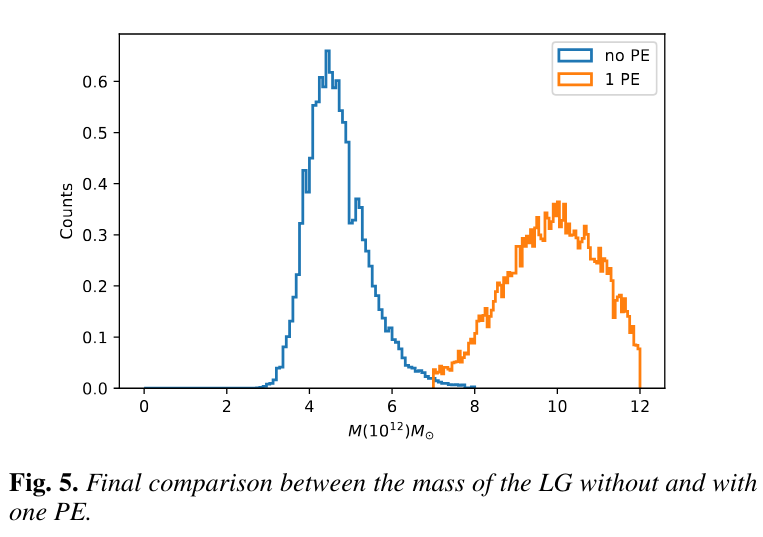
Figure 5 taken from
Benisty, D., A&A 656, A129 (2021)
While we know the RADIAL velocity of Andromeda very well, its TANGENTIAL velocity is much, much harder to measure. In order to measure it, we need to take pictures of the stars in Andromeda over some span of time, and look for changes in their position relative to very distant objects such as other galaxies or quasars. In other words, we need to measure the proper motion of those stars. And the problem is -- those motions are very, very small.
   Suppose a star in Andromeda, at a distance of d = 700 kpc,
           moves with a tangential speed of v = 100 km/s relative
           to distant sources.


        Q:  How far will it move (in meters) over a span of 100 years?


        Q:  How much will its angular position change over this time?
                Express your result in arcseconds.
So, yes, it's very hard to make these measurements. Our best estimates on the "sideways" motion of the Andromeda Galaxy can change as new instruments make better measurements, and therefore our guess as to the nature of the encounter -- collision? miss? side-swipe? -- can change as well.
On the other hand, the timing argument is not quite so tricky. We can at least make a reasonable guess at the combined mass of the Milky Way and Andromeda, as well as the other objects in the Local Group.
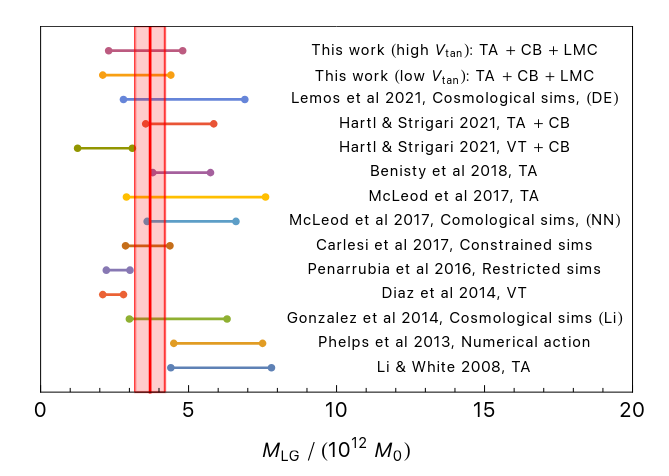
Figure 4 taken from
Benisty, D., et al., ApJ 928, L5 (2022)
Copyright © Michael Richmond.
This work is licensed under a Creative Commons License.