 Copyright © Michael Richmond.
This work is licensed under a Creative Commons License.
Copyright © Michael Richmond.
This work is licensed under a Creative Commons License.
Even long ago, a few astronomers tried sending light from their telescopes through a prism to break it up into a spectrum. Aside from the Sun, most stars were too faint to create any really informative result. The Sun, though -- its spectrum showed plenty of features. Among those who studied it closely was the Bavarian astronomer Joseph Ritter von Fraunhofer, who identified and named a number of lines. We still use his label of "D" to describe the sodium doublet at 5890 and 5896 Å.
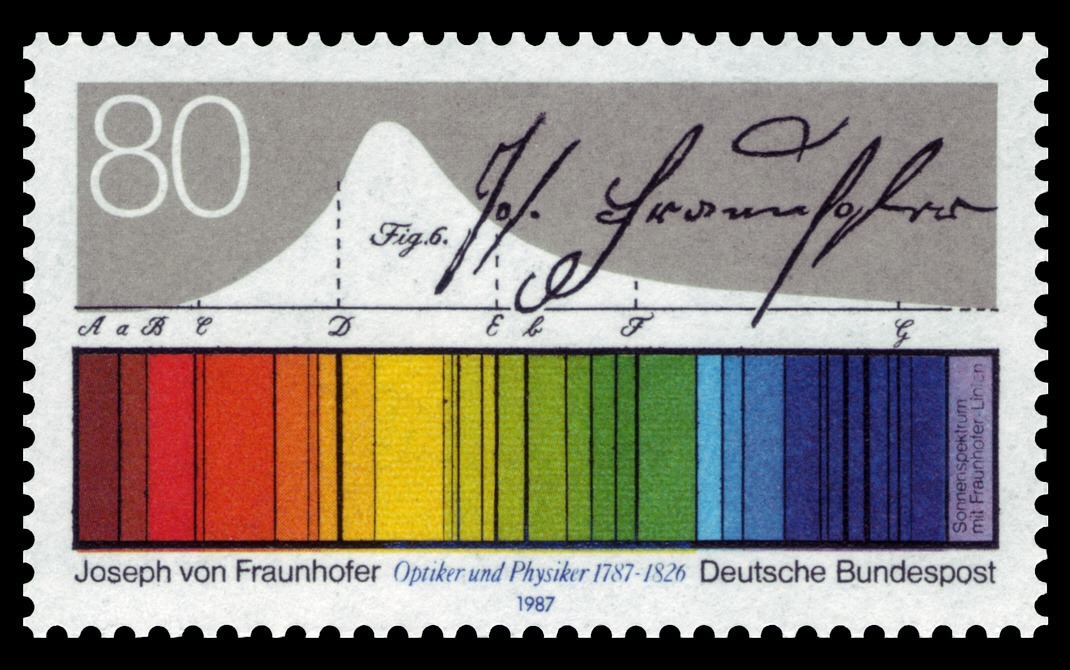
German postage stamp courtesy of
NobbiP and
Wikipedia
After Kirchoff's investigations showed that scientists could use spectra to identify the composition and properties of stars, many astronomers applied big telescopes and improved spectrographs to the problem. One of the foremost was Father Angelo Secchi, who recorded his visual impressions of the spectra of many stars, and even started to create groups showing similar features.
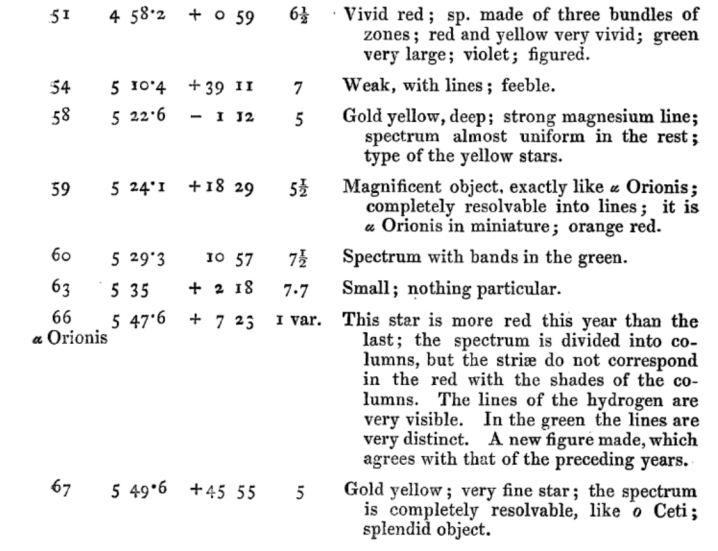
Portion of Table 1 from from
Secchi, A., MNRAS 28, 196 (1868) ;
the columns are star ID, RA, Dec, mag, description.
But the real work started when astronomers were able to acquire photographic records of spectra, which could be examined in detail and measured quantitatively. The cutting edge of the field in the 1880s through the 1920s was the the Henry Draper Memorial , named after one of the pioneers of astronomical photography. His bequest to the Harvard College Observatory funded a survey of bright stars (down to eighth or ninth magnitude) over the entire sky. Over the next forty years, HCO operated a series of telescopes at several locations equipped with objective prisms

The objective prism being removed from the front
of the Kiso Schmidt Telescope in Japan.
which turn ordinary images of celestial sources into hundreds or thousands of little spectra.
These Burrell Schmidt images taken from
"Spectroscopy" by Dave Kilkenny
The Henry Draper project began by collecting hundreds of plates, and hundreds of thousands of spectra. The job of organizing and analyzing all that data was carried out largely by a set of female "computers", led by Williamina Fleming and (later) Annie Jump Cannon. You can read the story of their work in The Glass Universe.

Some of the computers at the Harvard College Observatory, circa 1890.
Annie Jump Cannon is at front center, looking through the magnifying glass.
Picture courtesy of
Wikimedia
Fleming decided to use the absorption lines of hydrogen to place spectra into different classes. She called the spectra with the strongest lines "A", the next strongest "B", and worked her way down the alphabet to "O", where the lines were virtually invisible. Here's a small selection of spectra shown in that order:
A 
A 
B 
B 
F 
G 
K 
K 
M 
M 
O 
Cannon noticed that this arrangement ALMOST put stars in order by temperature -- -- as measured by the continuum of the spectrum, and by photometric colors. With just a few changes (getting rid of some intermediate classes, and shifting the O class to the top of the list), Cannon created a true temperature sequence that has since been used as the primary means of classifying stars.
The result of decades of hard work by the Harvard astronomers was the Henry Draper Catalogue and Extension , which contains classifications for over 270,000 stars.
Each of the major classes
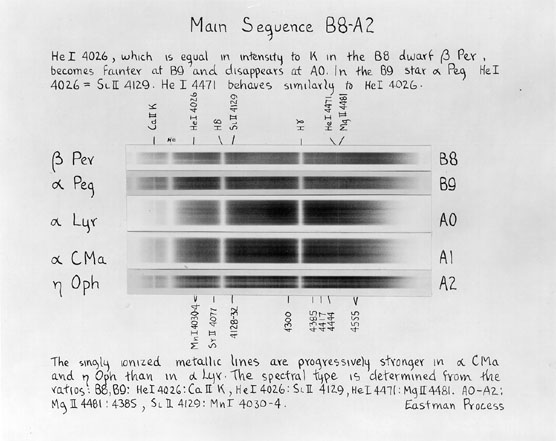
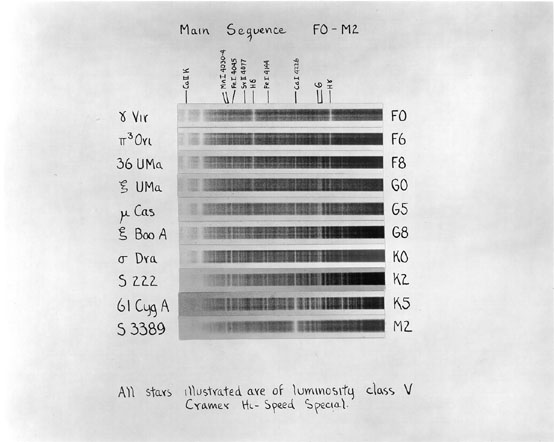
Images taken from
An Atlas of Stellar Spectra
In addition to these spectral classes, based on the relative strengths of various lines, the HCO crew also noticed systematic differences in the WIDTHS of some lines: while most stars had relatively broad lines, a few stars featured much narrower absorption lines. (Click on the picture below to see a larger version)
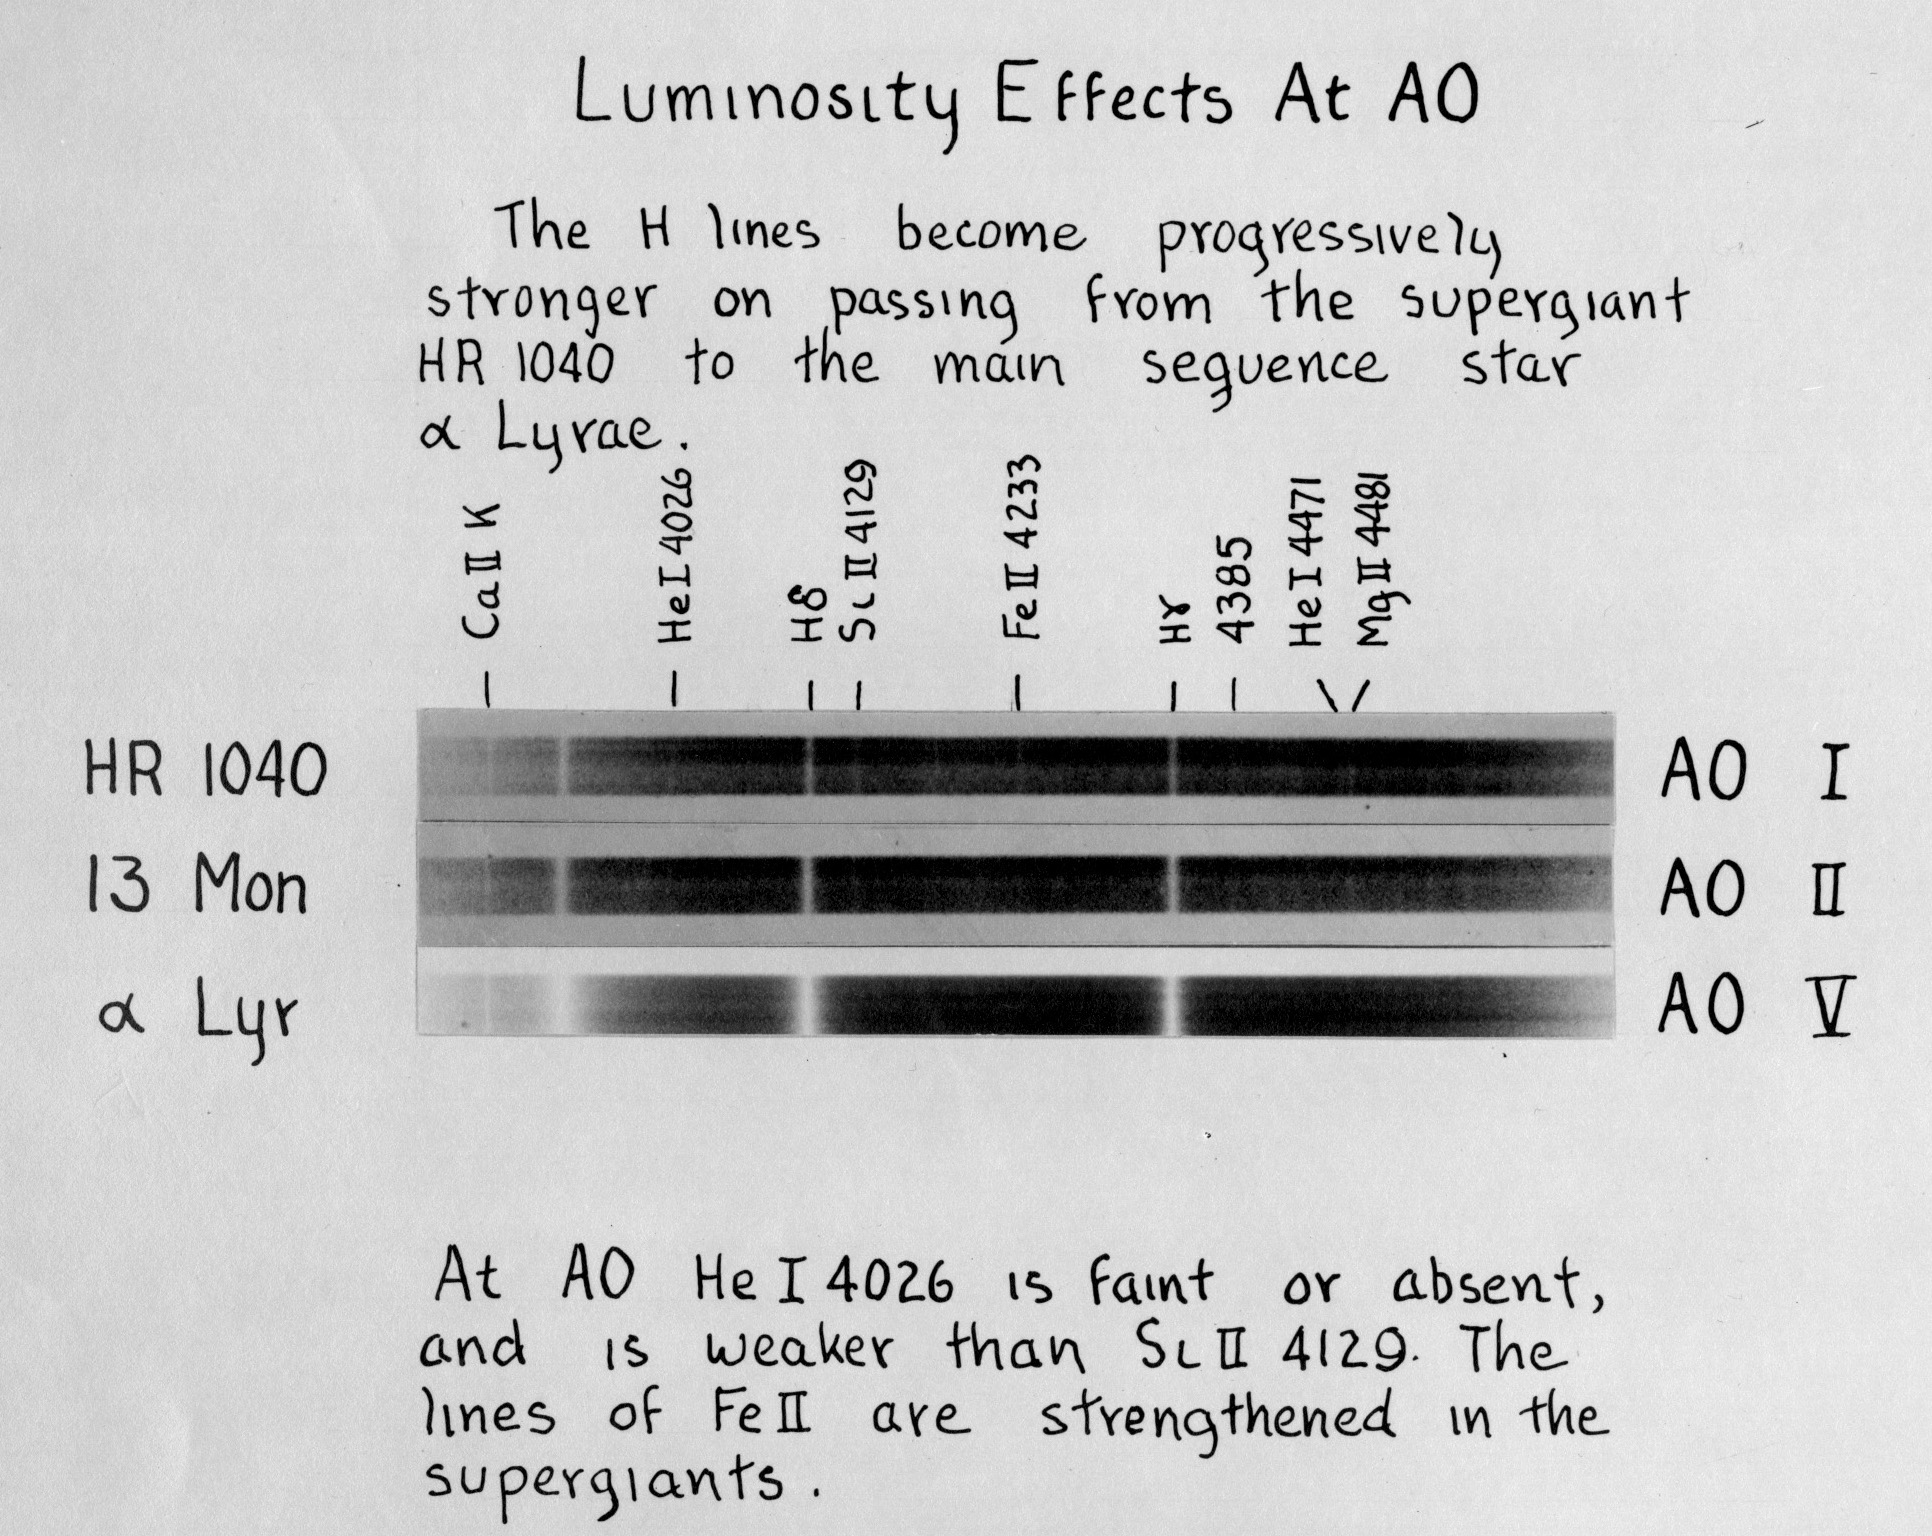
Image taken from
An Atlas of Stellar Spectra
Luminosity classes were devised to quantify these differences: luminosity class I for the narrowest lines, up to class V for the widest ones.
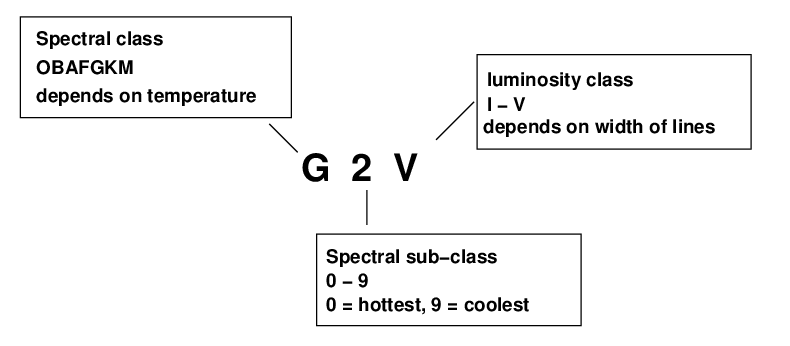
So, the full description of an ordinary star has three items (yes, yes, there are stars with extra letters and numbers, but we're ignoring them for now).
Can you put a star in the proper category, given nothing more than a copy of its spectrum? Let's find out!
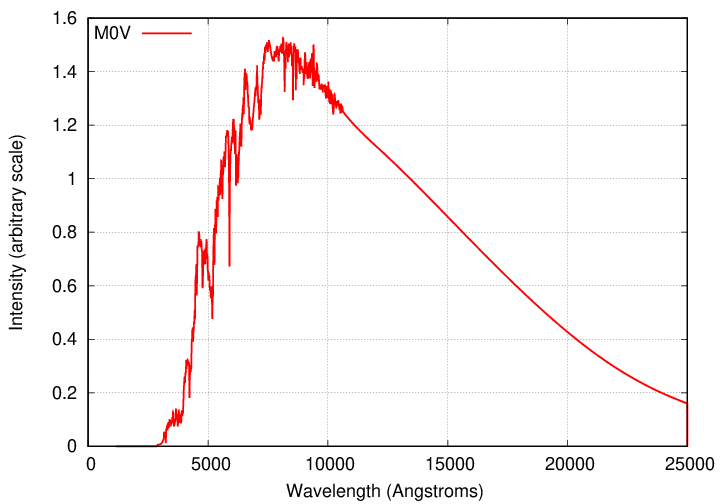
Below are a set of datafiles taken from A Stellar Spectral Flux Library: 1150 - 25000 A by A. J. Pickles PASP 110, 863 (1998). Each file provides the spectrum from a (model) star in simple ASCII text, with multiple columns. The first column lists the wavelength, and the second column the intensity of radiation.
Your first job is find a way to make graphs showing the intensity as a function of wavelength. There are many ways to create digital graphics; some people use Python's matplotlib, others (myself included) prefer Gnuplot. Find a method that works for you, and use it to make graphs for the above spectra. For example, for the M0V star, the full datafile should look like this:
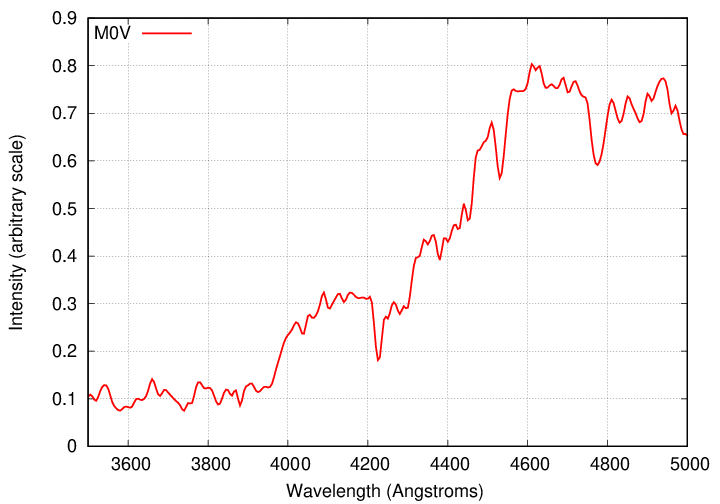
We're going to focus on the blue portion of the optical part of the spectrum, from 3700 to 5000 Å, since that region has many strong lines, and was also the region used primarily by the women who compiled the Henry Draper catalog and created the OBAFGKM system.
One way to classify an unknown star, or "target", is to figure out the known spectra which are closest to it, and make a graph showing the known spectra together with the target spectrum, like this:
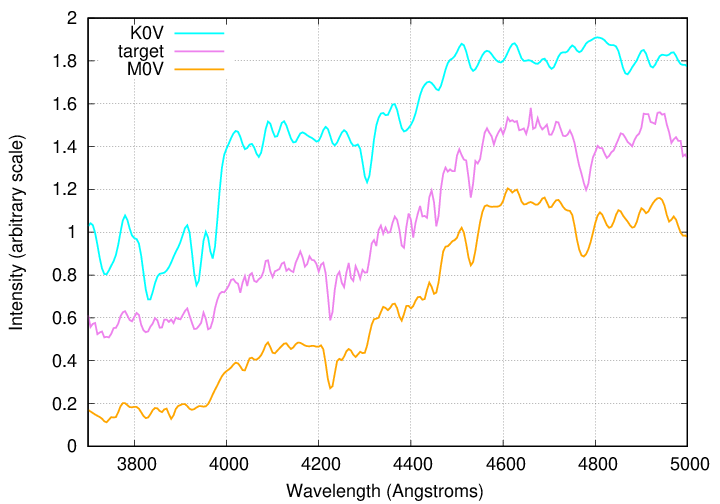
In this example, the target seems a bit closer to the M0V than the K0V spectrum, so we might classify it as K6V or K7V.
Right. Now, it's your turn. Can you classify the spectrum of the "mystery star"?
We've seen plenty of examples of stellar spectra with tens or even hundreds of distinct absorption lines -- but how are they created? What are the conditions under which the light from a star will show a dark line at some particular wavelength?
The keys are
The first of these conditions is straightforward: if we are interested in, say, the 6563 Å Balmer alpha line of hydrogen, then of course the star must have a good supply of hydrogen atoms. Likewise, the final condition is pretty easy to determine: the star's outer atmosphere must produce an observable flux at 6563 Å, or else we certainly won't observe an absorption line at that wavelength.
But the middle two conditions can be somewhat tricky. Let's look at the third condition here -- we'll tackle the second condition in the next section.
The H-alpha absorption line is created when a hydrogen atom absorbs a photon and jumps up from level n=2 to n=3.
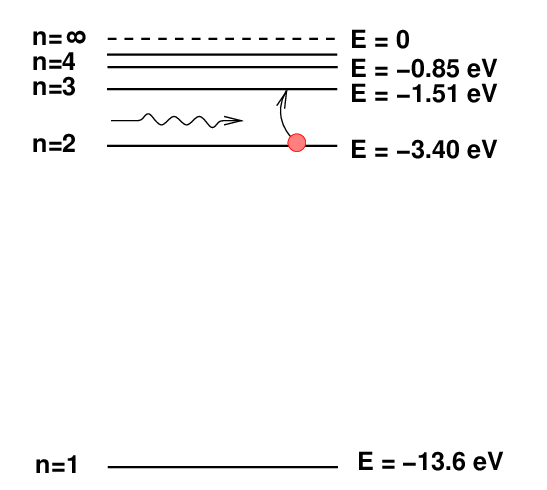
  Q:  How much energy above the ground state must a hydrogen
            atom have in order to sit in the n=2 level?
Right. The energy difference between the n=2 and n=1 levels is 10.2 eV.
One way to inject energy into an atom, so that it jumps up from the n=1 ground level, is to smash it with another atom. Collisions can transfer energy efficiently, especially when a gas is very dense. Although the motions of individual atoms vary greatly in speed and direction, the overall statistical properties of gas particles can be described very well by mathematical expressions. For example, the speeds of particles in a gas at some temperature T follow a Maxwell-Boltzmann distribution function; and, for our purposes here, the important feature of that function is that the typical kinetic energy of the particles is
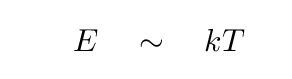
where k = 1.38 x 10⁻²³ J/K is the Boltzmann constant
So, suppose that you place a large set of hydrogen atoms into a region full of gas at temperature T, and then wait for enough time to pass that many, many collisions occur; enough collisions that the gas reaches a state of local thermodynamic equilibrium (or LTE for short). Under these circumstances, one can compute the ratio of the number of atoms which are in energy states "a" and "b" using the Boltzmann Equation:
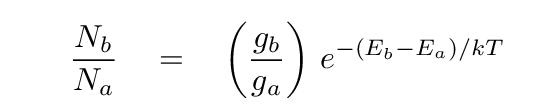
In this equation, the terms ga and gb are the degeneracy values, also called statistical weights, for the two states. For various quantum mechanical reasons, there may be a number of states which have exactly, or almost exactly, the same energy. For example, in the ground state of hydrogen, the spin of the electron can have two different values, which differ in energy by only about 6 MICRO-eV; compared to the differences of several eV between the n=1, n=2, etc., states, the spin-up and spin-down states effectively have the same energy.
The Boltzmann equation implies that if state "b" has an energy which is sufficiently higher than that of state "a", very few atoms will be in state "b".
  Q:  To a rough approximation, what is the critical difference
           in energy between the two states, beyond which point
           most of the atoms are in the lower state?
The answer is in the form of the function. Note the negative exponential factor. When the argument of the exponent is larger than one -- in other words, when (Eb - Ea) > kT -- then the ratio will drop very quickly.
  Q:  In order for hydrogen gas to absorb the Balmer alpha photons,
           atoms must be in the n=2 state.  How hot will the
           gas have to be in order for the number of atoms in
           n=2 to be as large as the number of atoms in the
           ground state, n=1?
A graph of the function makes this point clearly.
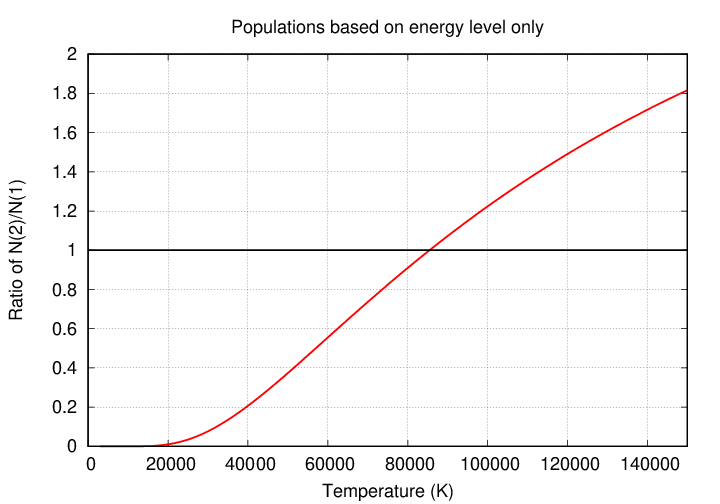
Looking at the graph, one might guess that the Balmer-alpha absorption line, at 6563 Å, ought to grow stronger and stronger as the temperature rises up to 85,000 Kelvin and beyond. But if one examines actually stellar spectra, one can see that the Balmer absorption lines are strongest in star of the spectral class A, at temperatures of around 10,000 Kelvin ... and they DIMINISH at higher temperatures.
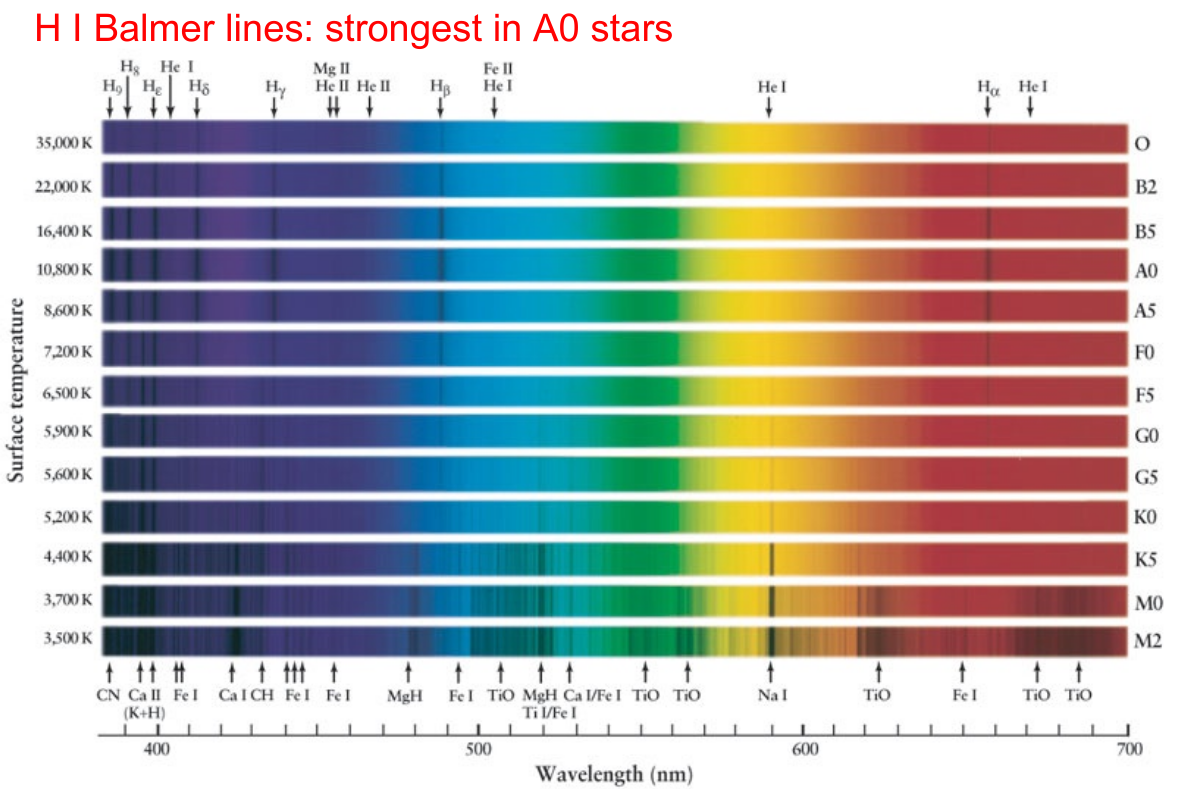
Image courtey of
Adam Burrows' ASTR 204 website
Uh-oh. We must be missing some important piece of the puzzle ....
The missing piece of the puzzle involves IONIZATION. Let's go back to the picture of the energy levels of hydrogen.
If a hydrogen atom gains too much energy -- 13.6 eV above its ground state, to be precise -- then its electron will fly off and never return. The atom will become a hydrogen ion. Ions, of course, don't create discrete absorption lines, since they don't make transitions between discrete energy levels. So, only neutral hydrogen atoms matter for computing the strength of the Balmer-alpha (or any other) absorption line.
Just as the ratio of atoms in two energy states depends on the temperature of the gas in which they reside, the ratio of atoms in two ionization stages also depends on the temperature. In fact, one can express the ratio of the number of atoms in ionization stage i+1 to that in stage i in an equation -- known as the Saha equation -- which should look familiar.
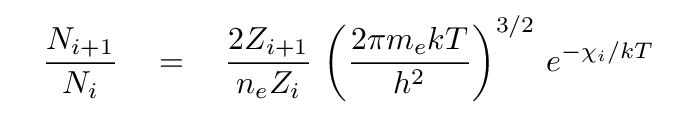
Just as in the Boltzmann equation, we see a negative exponential function involving an energy and the temperature. In this case, χi is the amount of energy required to remove an electron from a ground-state atom in ionization state i, transforming it into ionization state i+1. In the case of hydrogen, the transition from neutral i=1 to ionized i=2 requires χ1 = 13.6 eV.
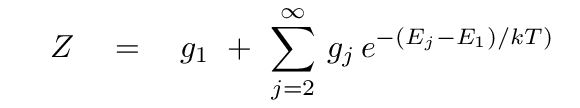
Another similarity lies in the first term: just as the Boltzmann equation had a ratio of statistical weights in the two energy states, the Saha equation has a ratio of partition functions, Zi+1 and Zi, for the two ionization stages. Like statistical weights, partition functions describe the number of different ways that electrons can be arranged in an atom while maintaining the same ionization stage. If we use Ej to represent the energy of the j'th level, and gj the statistical weight of the j'th level, then we can compute the partition function as
Let's see what all this means for the creation of Balmer-alpha absorption lines in ordinary stellar atmospheres. Most ordinary stars have temperatures well below the 118,000 Kelvin that corresponds to an energy of 10.2 eV, the difference between the n=1 and n=2 energy states. That means that for these stars, the great majority of atoms are in the ground state. According to the equation above, then, for most neutral hydrogen atoms, ZI = g1 = 2. An ionized hydrogen atom is a bare proton; there aren't any different ways to arrange its non-existent electrons, so it has a partition function ZII = 1. To a good approximation, then, for ordinary stars, ZII/ZI = 1/2.
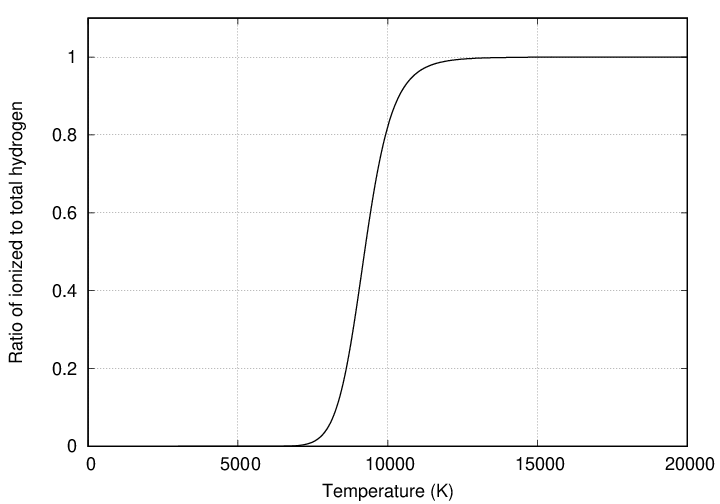
That means that the ratio of ionized to neutral hydrogen atoms is
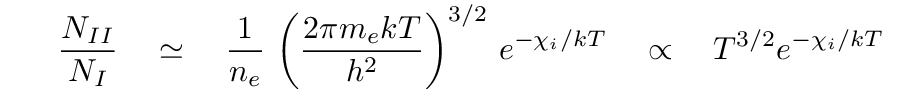
That factor of T3/2 makes all the difference. Even though the exponential term does not reach its "breakeven" point until a temperature of roughly kT = 13.6 eV → T = 158,000 K, the overall expression rises relatively quickly at much more reasonable temperatures. In fact, if we compute the fraction of atoms which are ionized, we see that it rises to nearly 100% at a bit over 10,000 Kelvin!
Of course, as the fraction of ionized atoms rises, the fraction of the remaining neutral atoms must fall.
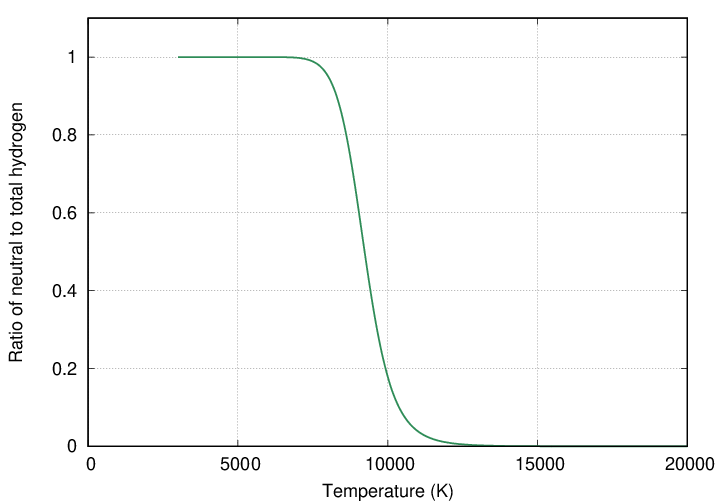
And that is the key. As soon as hydrogen becomes ionized, it cannot form the Balmer-alpha absorption line. So, as the temperature rises from 5000 to 10,000 to 15,000 K, the number of neutral atoms drops sharply ... but the fraction of those atoms in the n=2 state rises sharply. Therefore, strong lines will be created in stars with temperatures very close to this ionization limit, which will contain the maximum number of not-yet-ionized, but still excited to n=2, atoms.
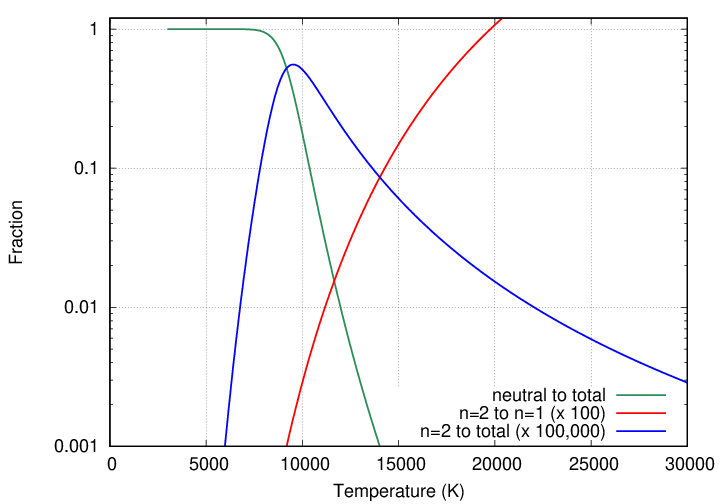
At last we can see why the Balmer absorption lines of hydrogen are strongest in stars with temperatures close to 10,000 Kelvin: those stars have the largest fraction of their hydrogen atoms sitting in the n=2 state, ready and waiting to absorp Balmer photons.
Copyright © Michael Richmond.
This work is licensed under a Creative Commons License.