 Copyright © Michael Richmond.
This work is licensed under a Creative Commons License.
Copyright © Michael Richmond.
This work is licensed under a Creative Commons License.
The Sun, like many stars, may be reasonably approximated as a blackbody; in the case of the Sun, with a temperature of about T = 5800 K. Its spectrum, in terms of flux per unit wavelength, looks roughly like this:
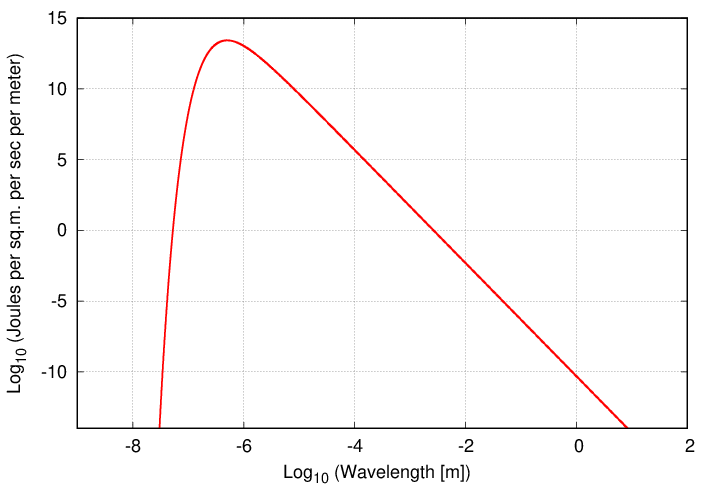
Suppose that we wanted to know the Sun's bolometric luminosity: the total energy emitted at all wavelengths. We could set up an integral of the Planck function over all wavelengths ....

That integral looks pretty ugly, but with some substitution, it can be put into a standard form

which has a simple result. So, we could find the bolometric luminosity by looking up that integral ....
OR we could simply remember that the total energy emitted per square meter per second from a blackbody is σT4, and so write the answer:

  Q:  The radius of the Sun is about R = 6.96 x 10⁸ meters.
      What is the bolometric luminosity of the Sun?
But we've never actually MEASURED that quantity. Why not? Because we don't have any detectors that can collect energy at all wavelengths -- from the gamma-rays and X-rays through the visible and on to the infrared and radio. Oh, and because the Earth's atmosphere blocks light from most of that range.
In practice, what astronomers ACTUALLY measure is the radiation over some small spectral range, or window. For example, we do have detectors that cover the optical range reasonably well, so we can make a decent measurement from, say, 4000 to 8000 Å. In logarithmic units, that range corresponds to log10 (λ) = -6.398 to -6.097.
Okay, then. It will turn out to be useful in practice to integrate the blackbody function over some finite range of wavelengths, such as:
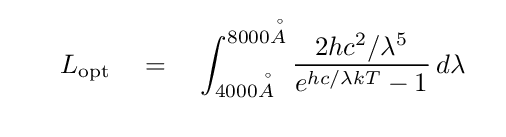
That handy integral yielding a simple result does NOT work when the limits are not zero to infinity. We must somehow find another way to evaluate this definite integral; in other words, find the area under the curve between the limiting wavelengths.

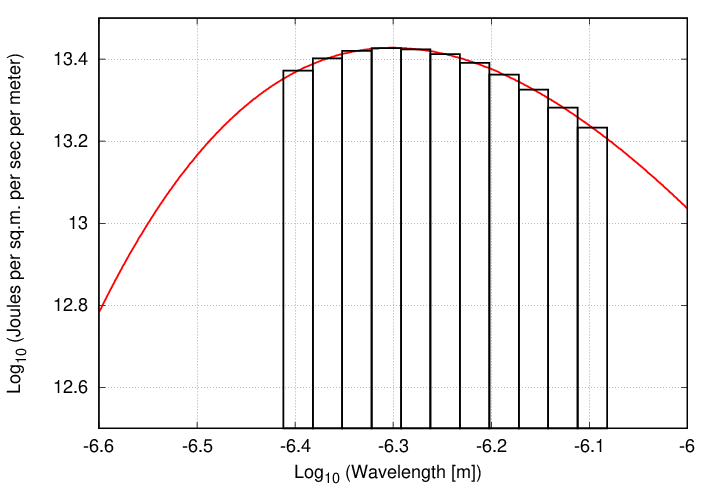
Q: How can we evaluate this integral over that range of wavelengths?
One solution is to perform a certain type of numerical integration known as "the rectangle method", or "Newton-Cotes method of order zero". The basic idea is to break up the region into a set of small slices in wavelength, and then to pretend that the blackbody function is CONSTANT within that slice.
The algorithm might be
You can read more about techniques of numerical integration in a couple of lectures from another course I've taught:
Okay, so suppose we do perform the numerical integration over some particular range of wavelengths. That should yield the flux of energy emitted from each unit area of the blackbody; ergs per second emitted per sq. cm. in cgs units, or watts per sq. m. in MKS units. We can then use these fluxes to predict what our telescopes and cameras ought to measure when we point them at blackbodies -- right?
Well, let's see. Suppose I pick two particular bandpasses, which happen to be similar to two of the standard filters (known as "Johnson-Cousins" or "Bessell") used by optical astronomers.
As you can see, the real filter transmission curves have sloping edges and pointy, rather than flat, tops, but we can approximate them to a good degree with the following rectangular equivalents:
If I integrate a 5800 K blackbody spectrum over these two ranges, I find fluxes which are nearly equal.
   Filter           flux integrated
                    from spectrum
----------------------------------------------------------------------------
                            6
    B              7.13 x 10   W/m^2

                            6
    I              7.94 x 10   W/m^2


 ratio B/I         0.90

----------------------------------------------------------------------------
Next, I take a real CCD detector, place it behind real filters, and point it at a 5800 K test object in the lab. (don't ask me how I construct the test object). After calibrating my measurements carefully, and correctly, I determine the number of photons striking the detector through each of the two filters. Those numbers are shown in the right column below.
   Filter           flux integrated              photons striking
                    from spectrums               the CCD detector
----------------------------------------------------------------------------
                            6
    B              7.13 x 10   W/m^2                15,900

                            6
    I              7.94 x 10   W/m^2                32,000


 ratio B/I         0.90                             0.50

----------------------------------------------------------------------------
Huh? Wait a minute! In theory, the two fluxes are nearly equal ... but in the lab, nearly twice as many photons reach the detector through the I-band filter.
  Q:  What's going on?  Why are there so many more photons in the
          I-band, even though the fluxes are nearly equal?
There's no funny business going on. It's simply a matter of units: our numerical integration of the blackbody spectrum produced the FLUX (energy per unit area per unit time) emitted by the object, but a CCD detector doesn't measure flux. Instead, it counts PHOTONS. In order to compare fairly the theoretical properties of a blackbody to real measurements from a photon-counting device, we must modify our integration algorithm slightly.
We can learn a lot more about stars by making much more detailed measurements of their light. When we add together all the light which passes through our atmosphere, or divide it into very large chunks by passing it through filters, we blur together a host of features. But if we send the light through a spectrograph, breaking it up into small sections by wavelength, we suddenly see that extra information.
Compare this photometric information on a star like Vega:
# lambda       flux
# (Ang)       (W/m^2)
4400 - 5300    25.8
to this spectroscopic information:
# lambda   flux
# (Ang)   (W/m^2/m)
 4000.0  2.340788
 4005.0  2.364400
 4010.0  2.392617
 4015.0  2.402697
 4020.0  2.406213
 4025.0  2.385914
 4030.0  2.363976
 4035.0  2.362967
 4040.0  2.357623

   ( ... 400 entries deleted ....)

 6050.0  0.773777
 6055.0  0.771288
 6060.0  0.770566
 6065.0  0.768194
 6070.0  0.768426
 6075.0  0.763557
 6080.0  0.757481
 6085.0  0.755058
 6090.0  0.755177
It's no contest: a spectrum contains much, much more information than any ordinary photometric measurements.
How do we acquire a spectrum? Simple. Point a telescope at a star, send the light through a prism, then let it strike a detector.
Actually, most astronomers these days (and even back in the semi-old days) use diffraction gratings instead of prisms to disperse the light.
Q: Why do astronomers prefer to use gratings instead of prisms?
When astronomers first pointed their spectrographs towards the Sun and stars, they saw a rich set of absorption lines: wavelengths at which light was diminished:
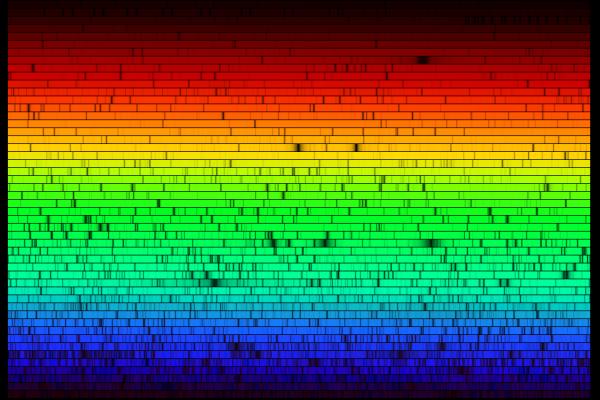
In the old days, astronomers would record spectra on photographic plates. Spectra typically were published as they appeared on the plate, showing dark lines on a relatively bright background:
In more recent times, as astronomers use digital detectors, the fashion is to show spectra as graphs, with intensity on the vertical axis and wavelength on the horizontal axis:
What was causing these dark lines?
When astronomers pointed their spectrographs at certain non-stellar objects in the sky, especially some types of nebula, they saw a different kind a spectrum. In the words of spectroscopic pioneer William Huggins, who used his own eye as the detector,
"On the evening of the 29th of August, 1864, I directed the telescope for the first time to a planetary nebula in Draco (NGC 6543). The reader may now be able to picture to himself to some extent the feeling of excited suspense, mingled with a degree of awe, with which, after a few moments of hesitation, I put my eye to the spectroscope. Was I not about to look into a secret place of creation? I looked into the spectroscope. No spectrum such as I expected ! A single bright line only!"
With more sensitive instruments, planetary nebulae display a number of these bright emission lines:
Spectrum courtesy of
Christian Buil
What was causing these dark or bright lines?
German astronomer Gustav Kirchoff, working in the 1850s, figured out the reason for these different types of spectra. He explained the three basic types of spectra as coming from three different situations:

![]()

![]()
![]()
So, in the typical stellar spectrum, there must be a dense, hot source of light in the background (to create the continuum), with a tenuous, cooler layer of gas above it (to create the dark absorption lines). We call this outer layer the photosphere.

The exact wavelengths at which light is emitted or absorbed by some material is related to the energy levels of atoms (or molecules) within it. Let's use hydrogen as an example, and adopt the simple Bohr model of hydrogen for simplicity.
The energy levels of a hydrogen atom follow a regular pattern. The energy of level n is given by a simple formula:
Sometimes it helps to make a picture of the energy levels.
We put the "ground state" level, n=1, at the bottom of the diagram. At the top, we put the level at which the atom will be ionized: if it gains this much energy, the electron flies off into space, never to return.
We can depict an atomic transition graphically by drawing a little ball on the diagram to represent the energy of the atom. If the atom drops from a high level to a lower one, it will emit a photon. The energy of the photon is equal to the difference between the initial and final energy levels.
  Q:  What is the energy of the photon emitted
      when a hydrogen atoms drops from n=2
      to n=1?
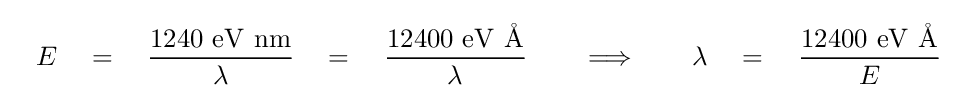
The energy of a photon determines its wavelength. You can convert from one to the other via a formula
where h is Planck's constant and c is the speed of light. The combination h times c has the convenient value of 1240 eV*nm, so
  Q:  What is the wavelength of the photon emitted
      when a hydrogen atoms drops from n=2
      to n=1?


      Could you see that photon with your eye?
Let's try a different transition. Suppose that an electron jumps from the n=3 to n=2 level.
  Q:  What is the wavelength of the photon emitted
      when a hydrogen atoms drops from n=3
      to n=2?


      Could you see this photon?
Transitions in which a hydrogen atoms drops down in energy to the second level are called Balmer transitions, after the scientist who first measured their properties very carefully. Since they occur in the visible portion of the spectrum, and they involve the most common element in the universe, they are one of an astronomer's most powerful tools. If you look at the spectrum of a planetary nebula, below, you'll see several Balmer lines:
Image taken from a paper by Mantiega et al., AJ 127, 3437 (2004)
Other atoms have spectra which are more complex than that of hydrogen; there are no simple formulae describing their energy levels. Fortunately, many scientists have spent years measuring the wavelengths of light emitted and absorbed by almost every variety of atom (and ion, and molecule) you can imagine. You can look up the wavelengths for any particular material in one of several big compilations of spectral lines.
Emission and absorption lines can tell us a great deal about a distant celestial source, but they only occur under certain conditions.
Emission lines from an element will appear if
Absorption lines from an element will appear if
Below are a set of spectra of three different real stars and one theoretical, simulated star. All three stars have similar temperatures in their photospheres, so the differences in the absorption lines of any one particular element do indicate differences in the abundance of that element.
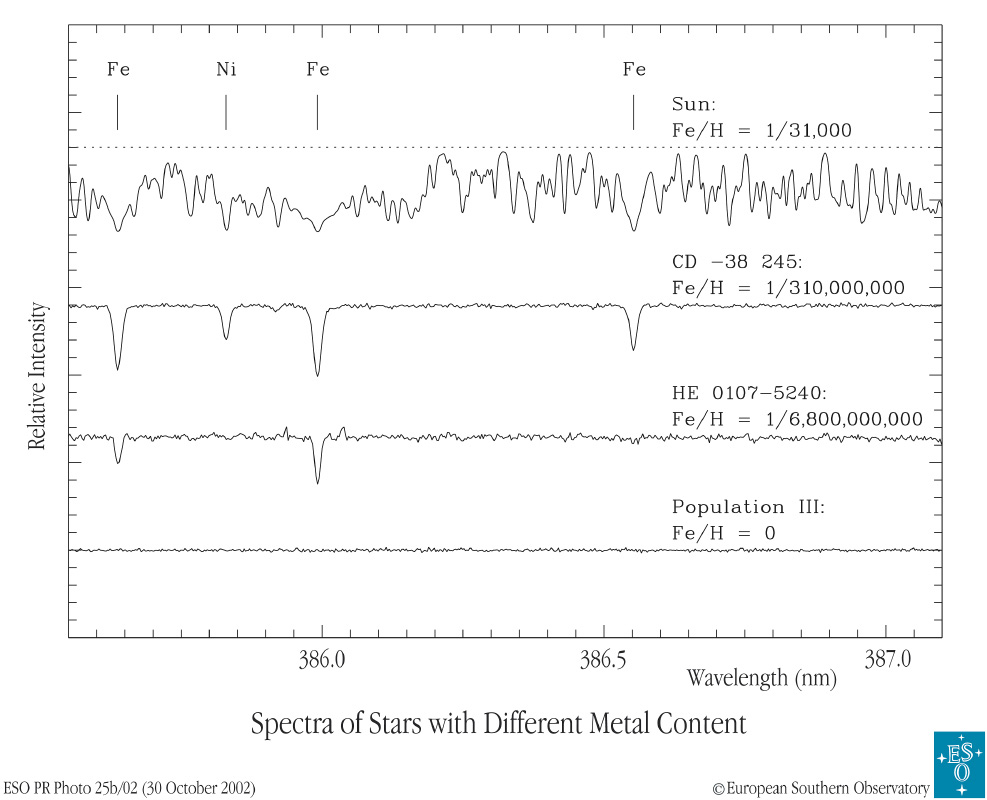
Image courtesy of
the European Southern Observatory
On the other hand, if you're not careful, spectral analysis might lead you astray. Let's compare the spectra of our own Sun with that of the bright star Vega.
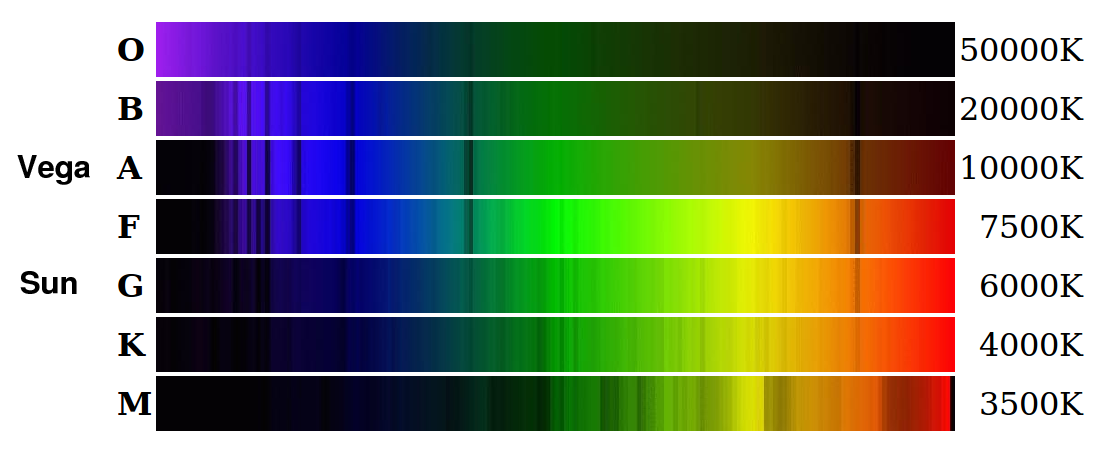
Image courtesy of
Michael Lemke and Simon Jeffrey
Here are the spectra shown as a graph, rather than as a picture. You can see the Balmer absorption lines of hydrogen in the spectrum of Vega very clearly.
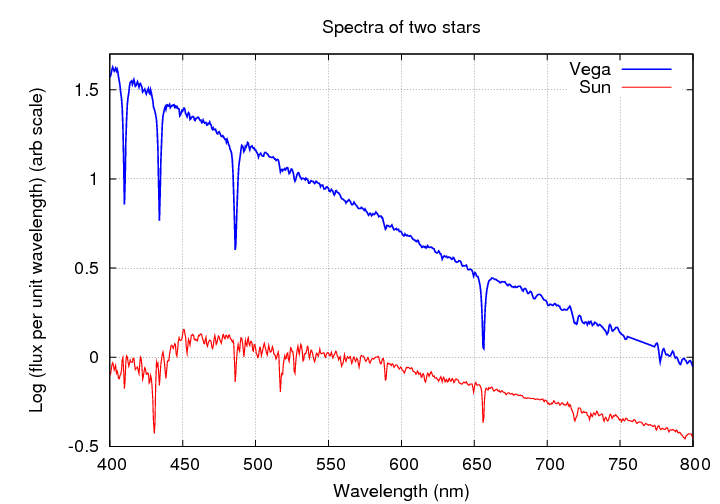
  Q:  What element makes up most of the star Vega?


  Q:  What element makes up most of the Sun?


  Q:  Why don't the absorption lines of hydrogen
      dominate the spectrum of the Sun, too?
The answer isn't obvious. In the early 1900s, astronomers didn't understand it, and they thought that IRON was one of the most common elements in the Sun's atmosphere, while hydrogen was a minor constituent. The person who solved this puzzle and figured out the true composition of the stars was a young woman named Cecilia Payne.
Copyright © Michael Richmond.
This work is licensed under a Creative Commons License.