 Copyright © Michael Richmond.
This work is licensed under a Creative Commons License.
Copyright © Michael Richmond.
This work is licensed under a Creative Commons License.
The goal today is to learn how to measure the brightness of stars in astronomical images. We'll use the clean images you created in the previous class, and focus on the process of measuring light. Our method is called aperture photometry, which is one of the simplest ways to determine the brightness of an object. Once again, we'll use XVista to do the work.
If you need to go back to the RAW images, you can find them at
An "aperture" usually means "a hole", or "an opening." Back in ye olde days, astronomers using single channel photometers would point their telescopes so that the light of just one star -- the target -- would fall through an honest-to-goodness hole in a piece of metal. Only that light would reach a detector and be recorded.
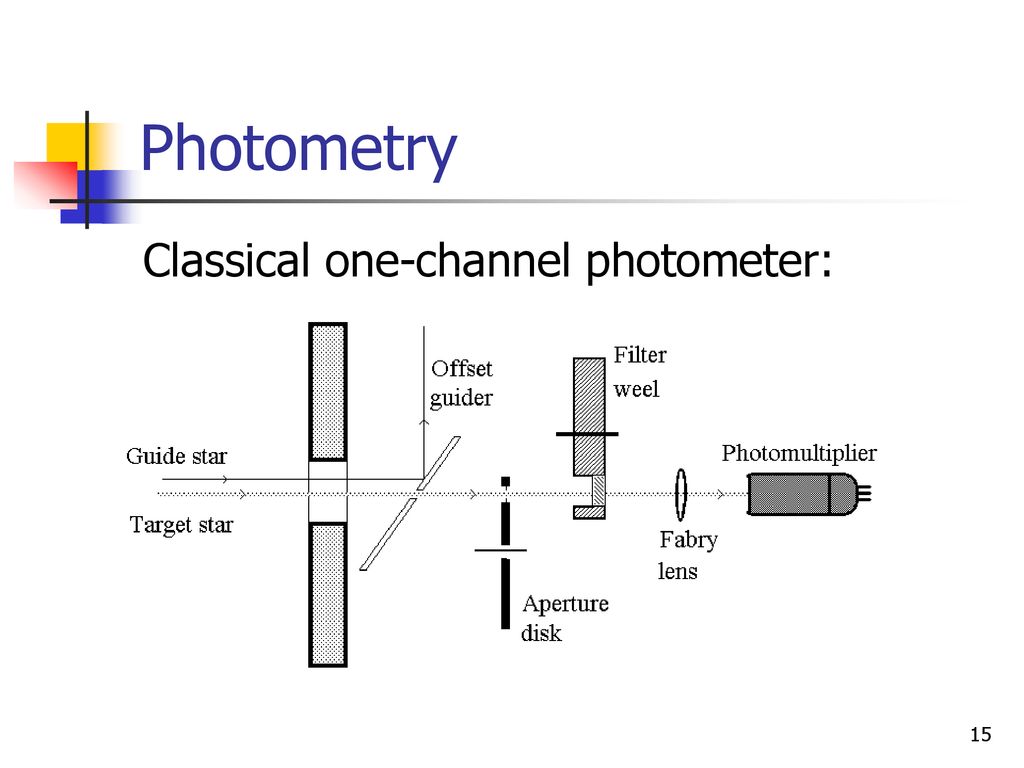
Image taken from
a presentation posted by Svend Holmberg.
But in the world of CCDs, we create "synthetic apertures" on our images. What does that mean?
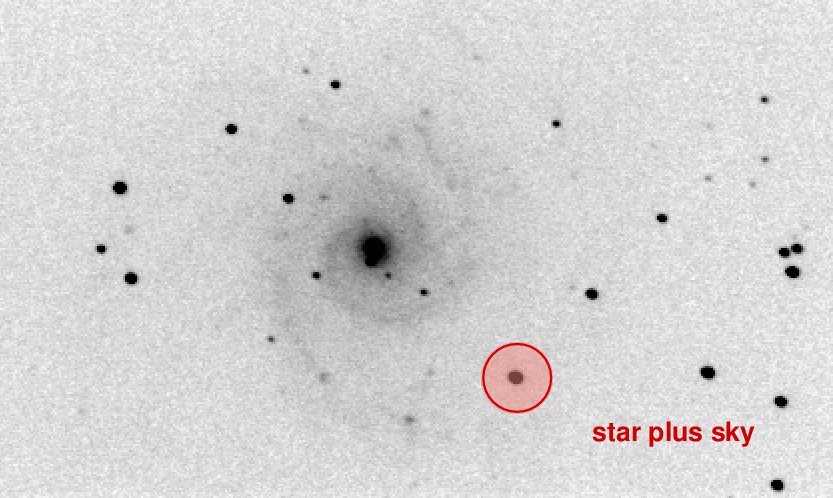
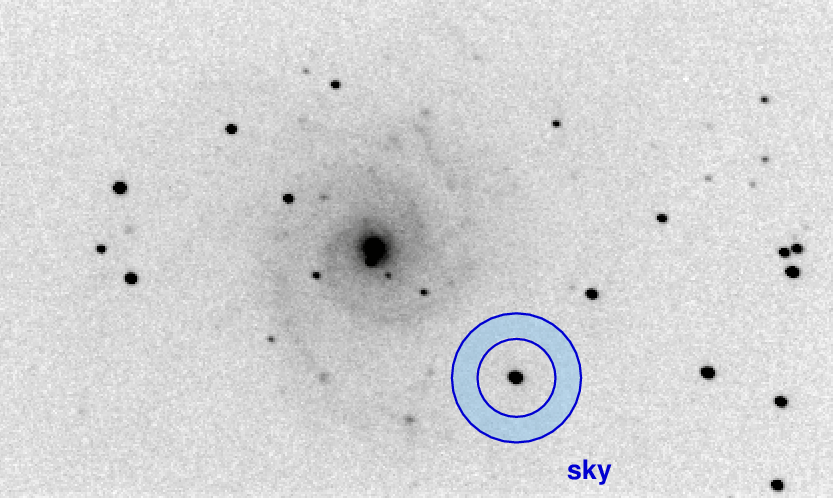
We can illustrate this method with an image of the galaxy M74.
![]()
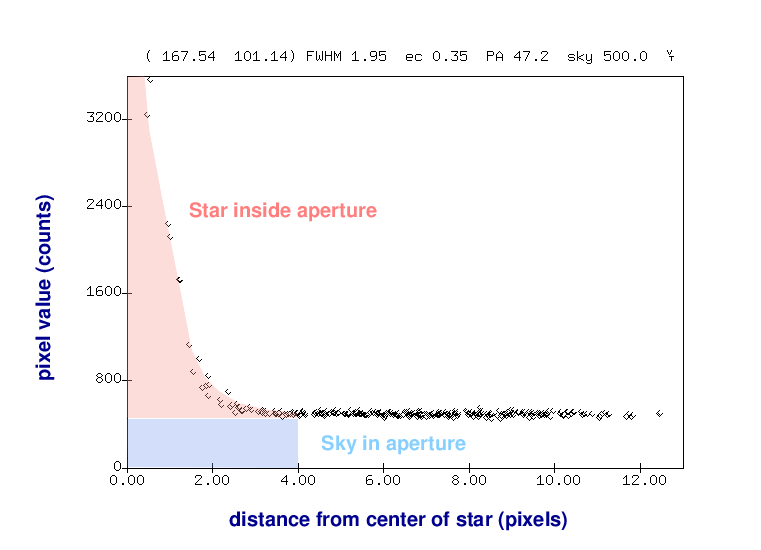
Suppose we want to measure the brightness of one star: the bright one to the lower-right of the galaxy's bulge. We can get a feel for the quantitative pixel values near this star by making a radial profile plot of the star. On the horizontal axis is the distance of each pixel away from the center of the star, and on the vertical axis is the pixel value above the local sky value.

One very simple method is just to pick the largest pixel value in this graph:
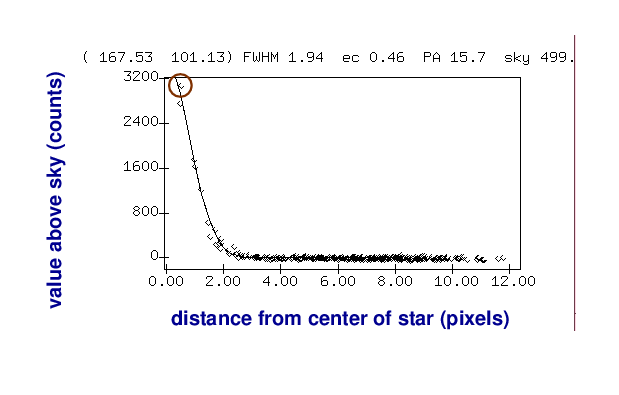
As you can imagine, this isn't very accurate for several reasons. Depending on the exact position of the star on the CCD, the peak of the point-spread-function (PSF) might fall at the center of the pixel, or near the edge, or even near the corner; the amount of light recorded by that pixel would vary in each case.
A better approach is to add up all the light which falls onto the CCD within a small region around the center of the star:
Of course, that will mean that we include some light from the sky as well.
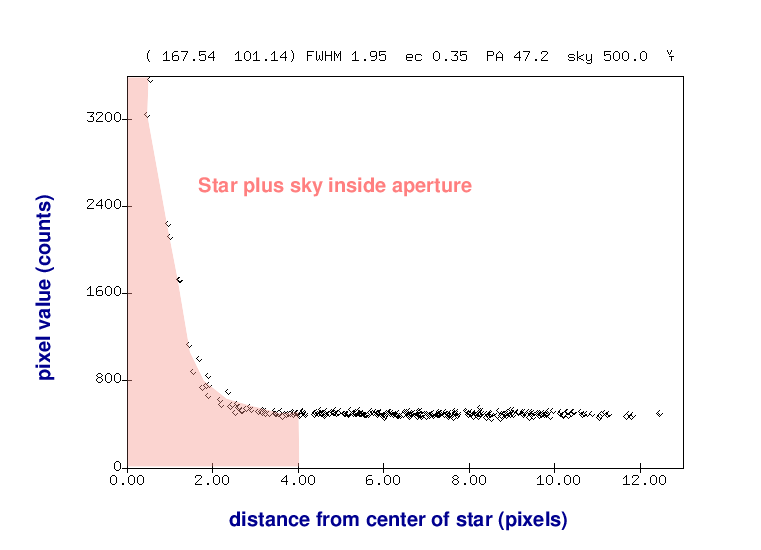
But we can then use an annulus around the star to measure the typical sky value, without any contamination from the star's light.

Once we know the local sky value, we can go back to our measurement of light inside the aperture and remove the contribution from the sky -- leaving a good measurement of the light from the star, all by itself.
The three parameters we need to set control the sizes of these circles.

You can set these using the command xlet. For example, to set the stellar aperture radius to 8 pixels, you could type
xlet aperture_radius=8
To check the current values of these (and other) parameters used by the XVista programs, just type the xlet command by itself.
xlet
Using XVista to perform aperture photometry
So, how do we do this in XVista? Let's use your cleaned image of the target, number 100, as our guinea pig. Let's choose 3 stars in addition to the target, ASASSN-14cl.
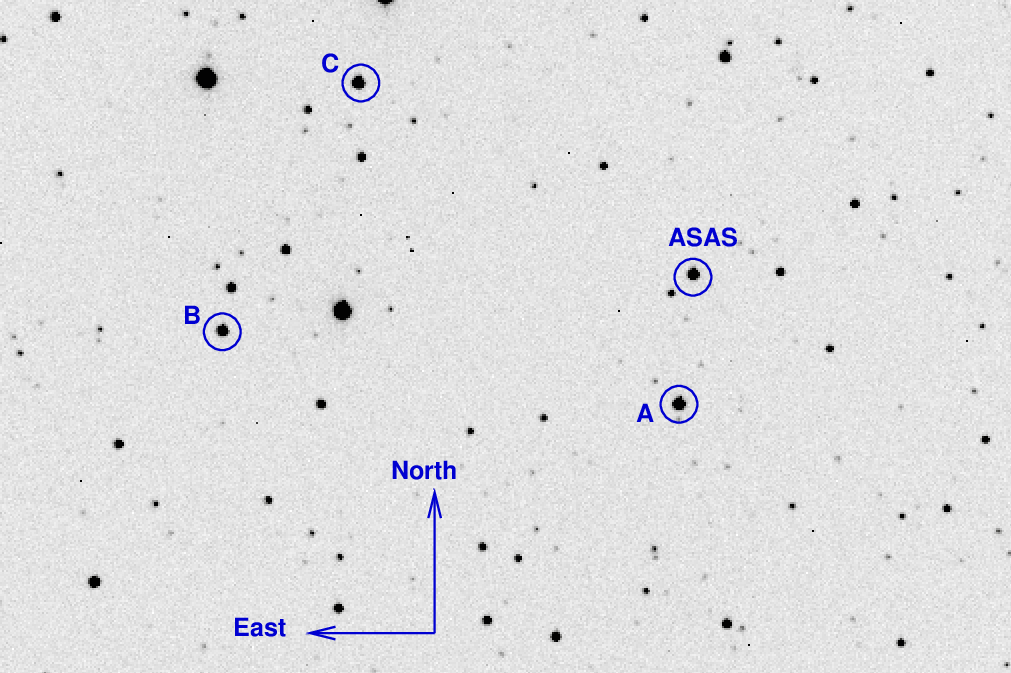
Our first job is to figure out reasonable sizes for the three circles of the stellar radius and the sky annulus. In order to figure out the right values for these parameters, we need to look carefully and up-close at stars in our image(s). We want the object aperture to contain most of the object's light, but not too much background sky; and the background annulus should contain very little or no light from the star in question --- or from other stars, if possible. As very rough guideline, the object aperture might be 2 or 3 times the FWHM of the image, while the background annulus might run from, say, 5 to 7 or 10 times FWHM. Display one of your images and move the cursor to star "A".
Repeat this process for stars "B", "C", and "ASAS". Under ordinary circumstances, you should find that the shapes of all the stars in a single image are nearly identical, so that one choice of parameters should work for all.
Part 1:
Stop at this point. We will wait for all students to carry out these measurements, and decide on one set of values for everyone to use.
You should have a set of 5 or 10 (or more) clean images of the ASASSN-14cl field. If you do not have a set of good, clean images, you can copy them in the following manner. First, move to your clean directory. Next, copy one of the clean images that I have made into your own directory, so that you can work on it. In order to copy image 065, type
cp ~ohsawa/ast613/richmond/clean/asas14clclear-065.fit .
Just replace the "065" in the above command with the number of the image you want to copy. Repeat if necessary until you have at least 5 good, clean images to analyze.
Here's a chart showing the region, with some stars labelled.
Since you have set the values for the aperture sizes, you are ready to make measurements. One way to do this is manually: move the cursor to a star and press the 'a' key. You should see a line appear in your terminal window that looks something like this:
( 139.17 349.11) flux 39840.0 npix 78.2 mag 13.499 sky 436.0 [ 5.0 8 20]
The first two numbers are the row and column position of the center of the star -- and of the apertures used to measure it. The number after "flux" is the total number of counts inside the aperture, minus the contribution of the background sky. You can compute that contribution by multiplying the number of pixels inside the aperture, "npix", by the value of the "sky". The three values in square brackets at the right end of the line are the aperture parameters:
What about the "mag" value? That's a bit tricky. It's really just a second way to write the "flux" value, using a formula like
mag = 25.0 - 2.5 * log10 (flux)
It is NOT a real magnitude. It will NOT match any value you can find in SIMBAD or other stellar catalogs. Instead, it's what we call an "instrumental magnitude," good only for comparisons with other stars in the same image. If our instrumental magnitude for star "B" is 1.5 magnitudes fainter than that of star "A", for example, then we'll probably find that the real, calibrated magnitude of star "B" in SIMBAD is roughly 1.5 magnitudes fainter than that of star "A".
Part 2:
     # Image index      A         B        C       ASAS
     # ---------------------------------------------------
          20         13.214    14.634   15.563  14.736
          25         13.221    14.639   15.569  14.745

           etc.
     # ---------------------------------------------------
where each entry is the instrumental magnitude of the star
in that image. This graph presents a rough uncalibrated light curve of the four stars in your set of images.
Suppose we want to convert our measurements from "counts" to something we can share with other astronomers. If we knew the magnitudes of at last some of the comparison stars, we might be able to convert our measurements to magnitudes, at least to a rough degree.
Can you figure out the magnitudes of these three stars? I suggest using the Aladin tool to create a chart of the region around ASASSN-14cl. Then, in the upper-left corner of the main Aladin window, click on the little arrow to the left of Catalog, then the little arrow to the left of Vizier, then the little arrow to the left of II - Photometric Data, and finally on the name APASS - AAVSO Photometric All Sky Survey. A window should pop up; click on the Load button. That will cause a set of dots to be overlaid on the image of the sky.

Clicking on one of these dots will cause information to appear below the chart, showing properties of this star in the APASS catalog. One of the pieces of information you can find is the V-band magnitude. For today, we'll assume that the V-band magnitude is a good match to the unfiltered, "clear" images we are analyzing.
Part 3:
Now that you have the basics down, it's time to apply your skills to a reasonably large dataset. For this assignment, you'll need to analyze all 41 of the ASASSN-14cl images in the given dataset (numbers 020 through 220), and measure a total of 4 stars in each image.
You may collaborate with other students if you wish, sharing measurements so that each student need only measure 10 or 15 images. Perhaps you could enter your measurements in
Part 4:
Bonus!
You may have noticed that one of the four stars varies significantly in brightness over this period. Here's your chance to earn a little extra credit.
Copyright © Michael Richmond.
This work is licensed under a Creative Commons License.