Remember, y-axis shows counts divided by 2
On Jan 10/11, 2019, RIT students Brent Neves and Teresa Symons acquired a set of dome flat images in order to check the linearity of HDI. The procedure was:
I converted the images from the native HDI FITS format to a simple FITS image format; in the process, all pixel values were divided by 2.
Brent Neves processed the images, creating a median bias frame and subtracting it from each dome flat. He then measured the mean value of pixels within a box of 200-by-200 pixels near the center of the frame.
You can find an Excel spreadsheet with his measurements and graphs here:
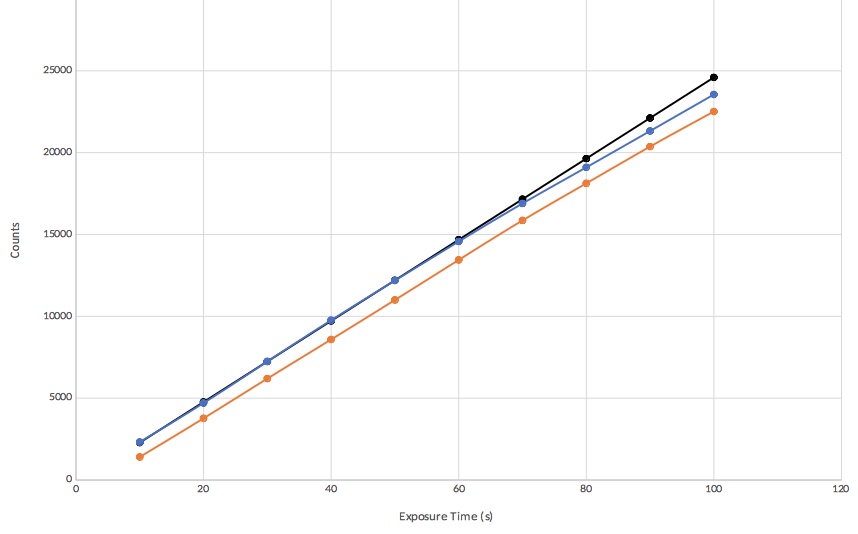
Brent Neves made a series of graphs showing the mean counts in the box as a function of exposure time. You can find all the graphs in the spreadsheet; I'll show just two here.
The first shows
It is clear that the measurements at longer exposure times have values which fall below the linear extrapolation of the fit to short exposures.
Remember, y-axis shows counts divided by 2
The second graph shows the same datasets, but without the offset for the blue measurements.
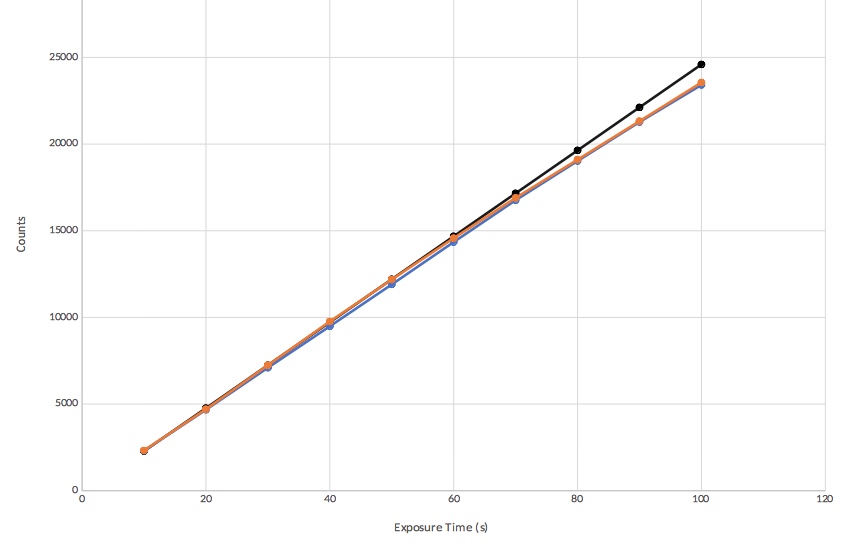
Remember, y-axis shows counts divided by 2
These tests suggest a small non-linearity in the response of HDI when levels increase above 30,000 counts (= 15,000 counts/2). That result is consistent with linearity tests performed in 2015: