
Earlier tests of linearity of amplifier "ur" can be found at
On Jan 18/19, with the help of Jen Connelly and RIT students Ekta Shah, Trent Seelig, and Andy Lipnicky, I took two series of special dome flats. The main goals were to check the linearity of two different amplifiers: "ur" = "upper right", which the amplifier that has been almost exclusively used in single-amp readout mode, and "ur" = "upper left."
In order to check the linearity of the camera in single-amplifier mode, we acquired a series of images of the dome-flat spot through no filter. We left the lamp setting at a low level (low-intensity, about 70 percent) and changed the exposure times to cover a wide range of light levels in the images. We took 2 images at each exposure time. All images were taken when the sky was dark, but one set ("ur") was taken soon after sunset, while the other ("ul") was taken many hours later.
The images can be found in the HDI archive in
 c7772t0058f00.fits  -    c7772t0085f00.fits      (amp ur)

 c7772t0327f00.fits  -    c7772t0354f00.fits      (amp ul)
Exposure times ranged from 1 seconds to 14 seconds. The tests took place after sunset, on a cloudy night, when the skies were dark. Both the dome slit and louvres were closed, so there should have been little external light inside the dome.
As we will see below, this range of exposure times is probably not the best. We should have used a lower lamp setting and/or inserted a filter, so that the shortest exposure time was at least 5 seconds; that would avoid possible shutter timing effects.
The light levels in the raw frames ranged from about 1800 counts above bias to about 47,000 counts above bias.
The procedure was
The result was 252 pairs of "exposure-and-mean" values. When one graphs the mean level versus the exposure time, one should find a linear relationship. The datafiles below have the following columns, after a brief header marked with '#' characters.
You can see the results in the figure below. The solid line is a fit to the measurements with exposure times between 5 and 10 seconds; or, alternatively, to measurements with light levels between about 17,600 and 37,000 ADU. The region used to determine the fit is shown inside the green box. The amp "ul" data has been offset by +8000 counts for clarity.
Clearly, the linear relationship fails for high light levels. The point at which the response leaves the linear regime -- at about 40,000 ADU -- is roughly the same as the point determined in in tests made in 2015.
Both the "ur" and "ul" amplifiers show the same rolloff at high counts, but the "ur" deviation from a linear fit seems larger.
Another way to look at the results is to compute a fractional difference from a linear model:
                                (measured - model)
     fractional difference  =  --------------------
                                      model
A graph of this fractional difference as a function of count level in ADU shows deviations more clearly (with the "ul" amplifier data offset by 0.15 for clarity):
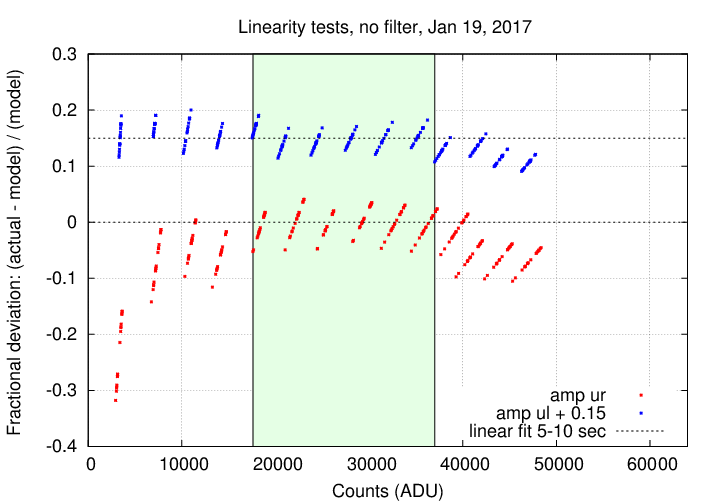
Once again, we see a rolloff in both amplifiers above 40,000 ADU; the rolloff looks larger in the amp "ur".
The curious feature of this graph is the very large deviation from the linear model at SHORT exposure times -- for the amp "ur" only. I would have expected some deviations at short exposure times due to the time required for actual shutter motion, but shutter motion should affect data from both amplifiers equally -- right?
This is a puzzle. Since the two datasets were acquired nearly 8 hours apart, I guess that is possible that the shutter mechanism might have changed its behavior somewhat during that time; due to temperature or humidity, perhaps.
We need to run similar tests again to check this difference.