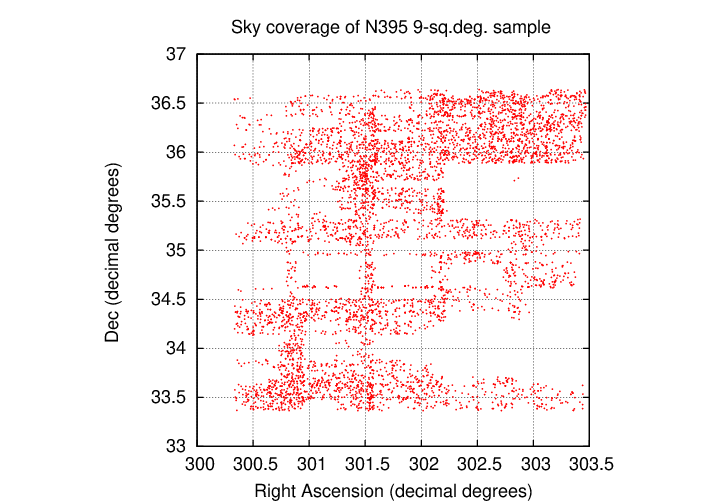
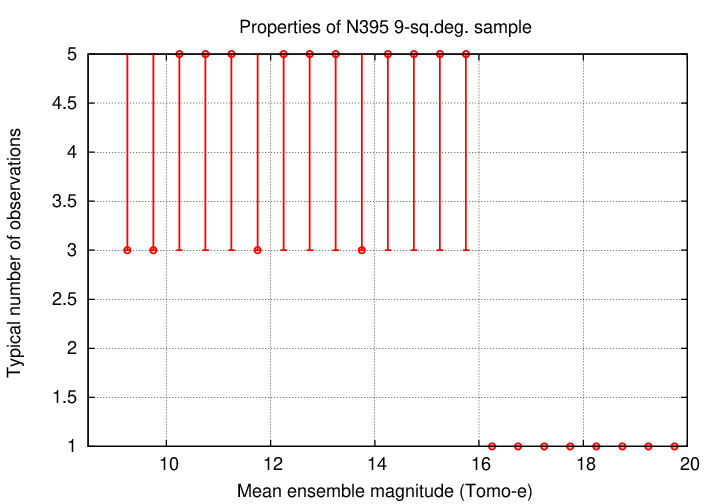
I analyzed a small collection of narrow-band Tomo-e photometry from the empcatzmcorrwcsmaskgaia_22 table. The dataset is small, covering a region of 9 square degrees and a brief time period in 2022 only, and consisting of measurements through the N395 filter only. Most areas in the region were only observed four or five times. As usual, ensemble photometry yields a small scatter in repeated measurements; however, in this case, unlike the unfiltered measurements, the ensemble scatter is only slightly smaller than the scatter of the "raw" measurements taken directly from the database. The explanation is due to the short timeperiod during which all the N395 data were acquired.
The empcatzmcorrwcsmaskgaia_22 table contains information on narrow-band measurements of stars through several different apertures. My starting point for this test was
Although I selected all measurements within this region, I found that the ensembles created from the data contained significant gaps and empty areas. I used an ensemble size of 0.25 degrees for this analysis.
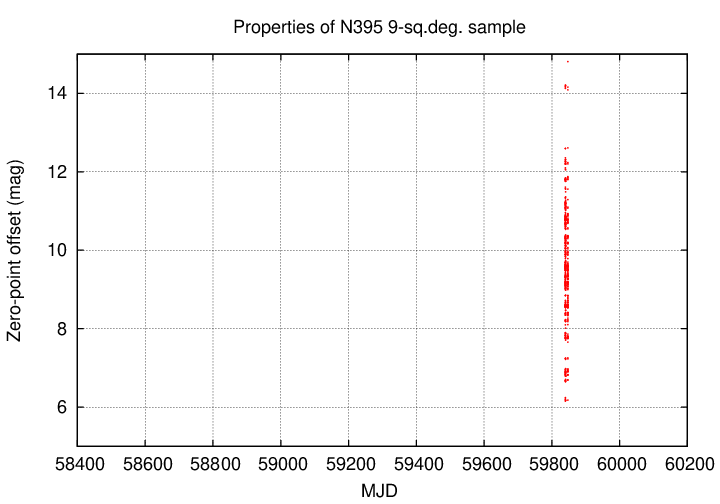
The period covered by these observations is very short, just 9 nights during 2022: 59839 < MJD < 59847.
Each star appeared in the dataset relatively few times.
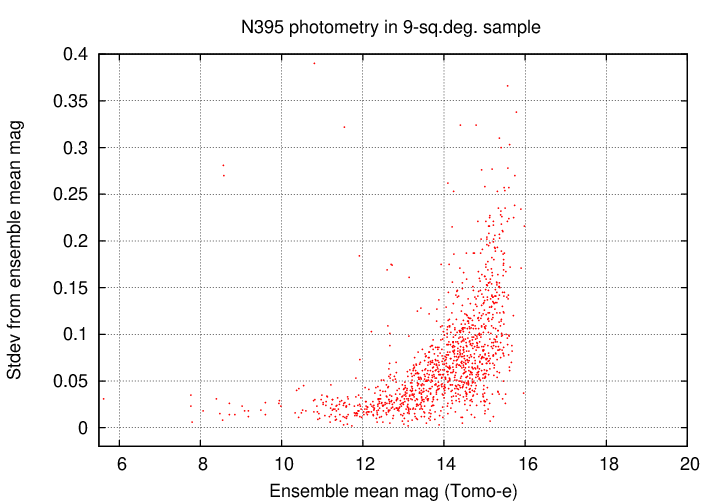
One of the primary results of ensemble analysis is a measurement of the scatter in the magnitudes of a star around its mean value. The results for this dataset show the usual features of such an analysis.
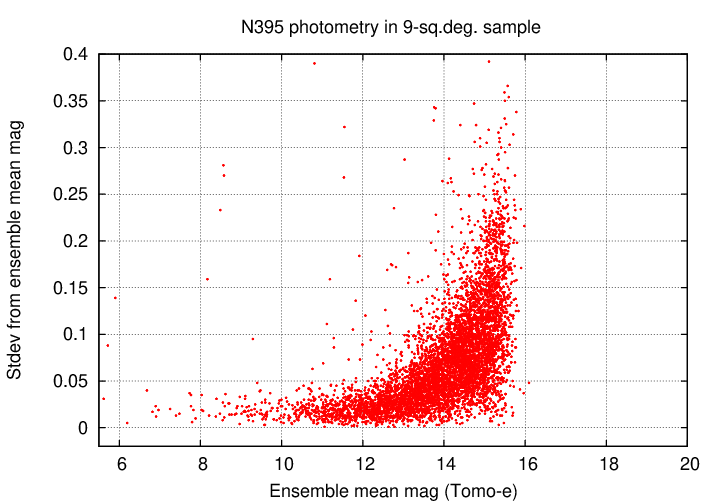
The graph below shows the same data, just using smaller symbols to show features in the dense regions of the graph.
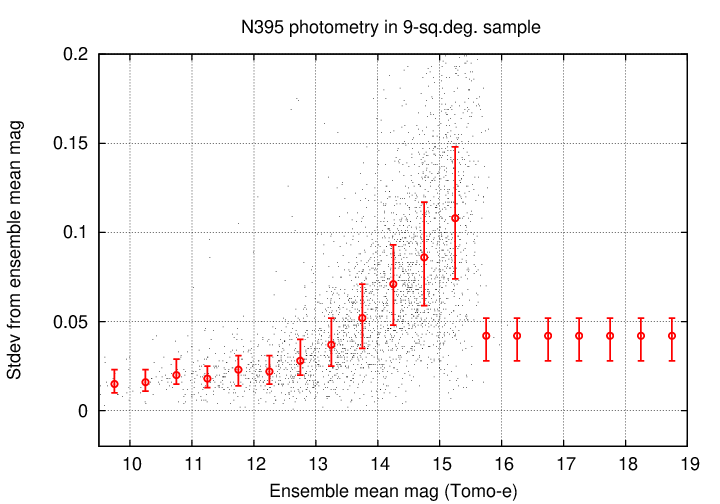
I divided the stars in bins of width 0.5 magnitude and computed median and interquartile mean of the scatter within each bin.
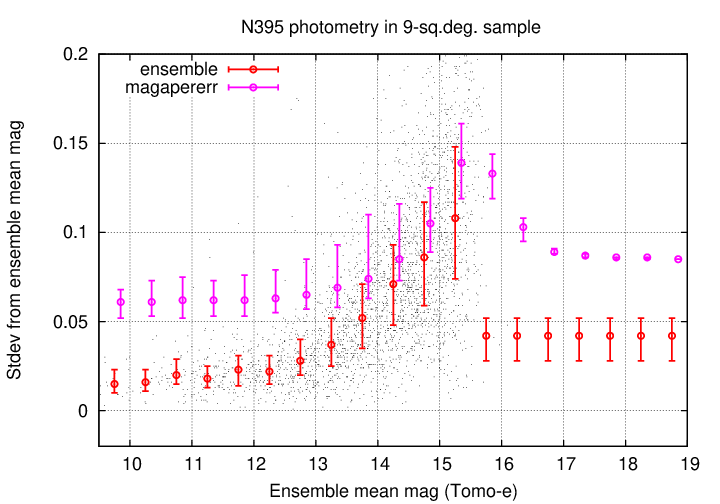
Note that the scatter in these measurements at some particular magnitude is somewhat smaller than the uncertainty estimated by SExtractor, presumably based on electron statistics alone. This is contrary to the case for unfiltered measurements, for which the SExtractor estimates are smaller than the ensemble stdev values at the bright end.
On the other hand, if we compare the scatter in the ensemble solutions to the standard deviation from the mean of the "raw" values taken straight from the empcatzmcorrwcsmaskgaia_22 table, we find that they are very similar:
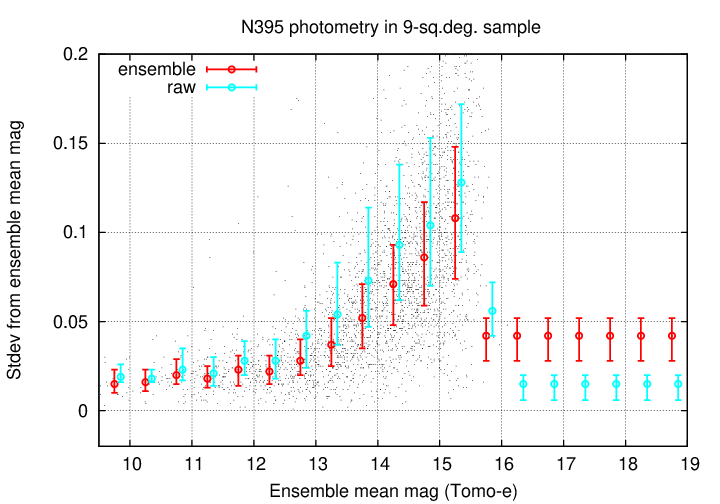
The fact that the ensemble solutions are only very slightly smaller than the "raw" measurements tells us that the epoch-to-epoch zero-point offsets in this dataset are small; and, indeed, a visual inspection of a small number of the offsets for individual ensembles showed that to be true. That is quite different from the case of the unfiltered measurements analyzed in TN 024.
What is the difference? I believe the reason that these narrow-band measurements are already such a homogenous set is simply due to the small span of time during which they were acquired: just 9 nights in 2022, versus hundreds of nights over 2018-2023 for the unfiltered dataset. Seasonal variations, and changes to the instrument and telescope, are completely absent from this particular narrow-band dataset.