I analyzed a small collection of narrow-band Tomo-e photometry from the empcatzmcorrwcsmaskgaia_22 table. The dataset is small, covering a region of 6 square degrees and a brief time period in 2022 only, and consisting of measurements through the N433 filter only. Most areas in the region were only observed four or five times. Nonetheless, ensemble photometry yields a small scatter in repeated measurements. I ran the analysis twice, splitting the data into ensembles of different angular size, and found very similar results.
The empcatzmcorrwcsmaskgaia_22 table contains information on narrow-band measurements of stars through several different apertures. My starting point for this test was
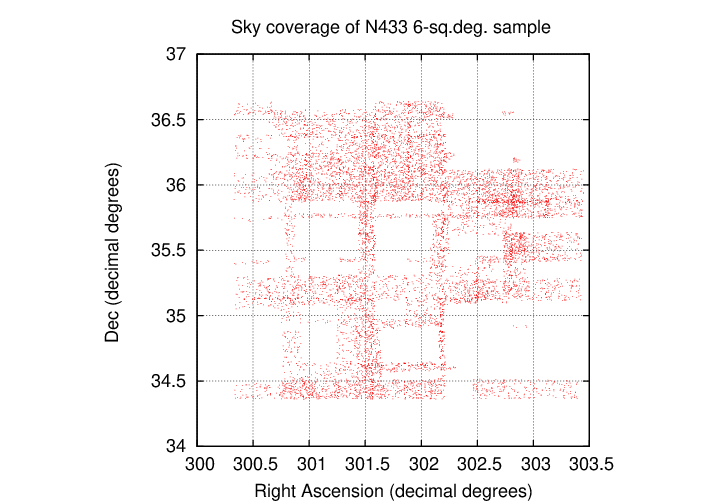
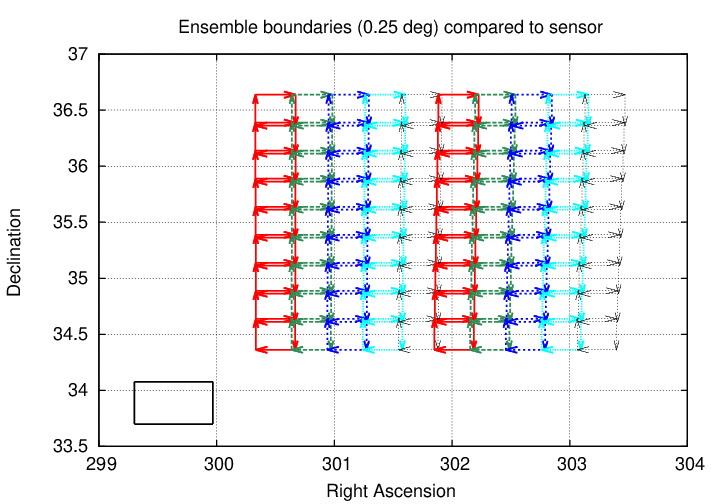
Although I selected all measurements within this region, I found that the ensembles created from the data contained significant gaps and empty areas.
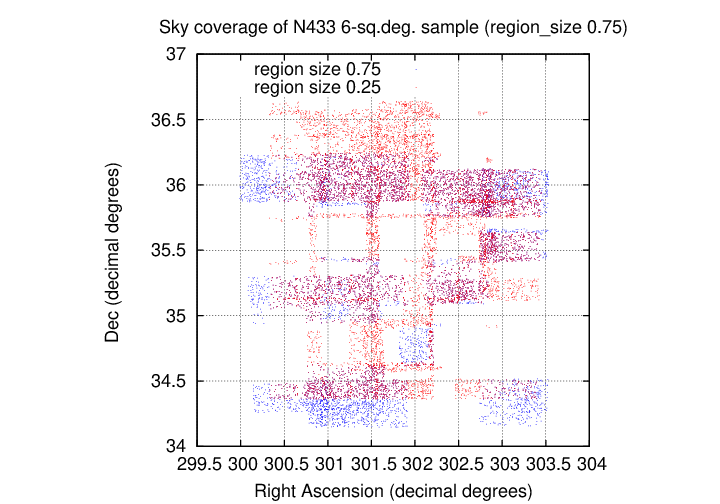
The location and size of the gaps changed when I switched the ensemble size from 0.25 degrees (red) -- my default, as it is roughly the size of a single Tomo-e detector -- to 0.75 degrees (blue). I don't understand this at the moment; it may just be the interplay of the real distribtion of measurements on the sky (which does, I think, have gaps) and my choices of sampling centers.
The period covered by these observations is very short, just a month or two in 2022.
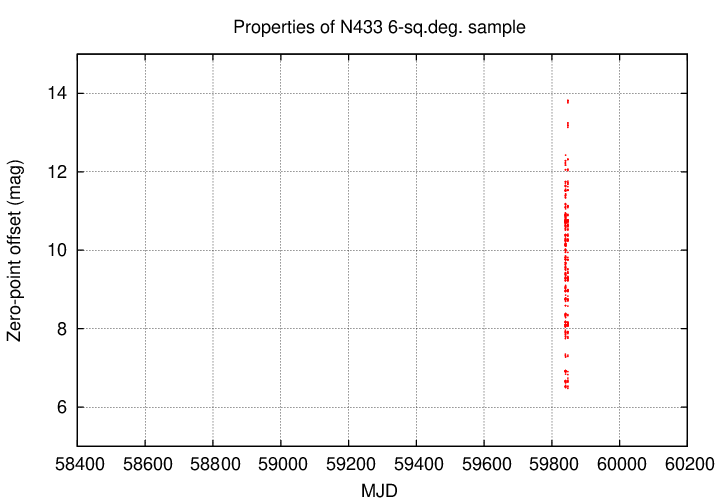
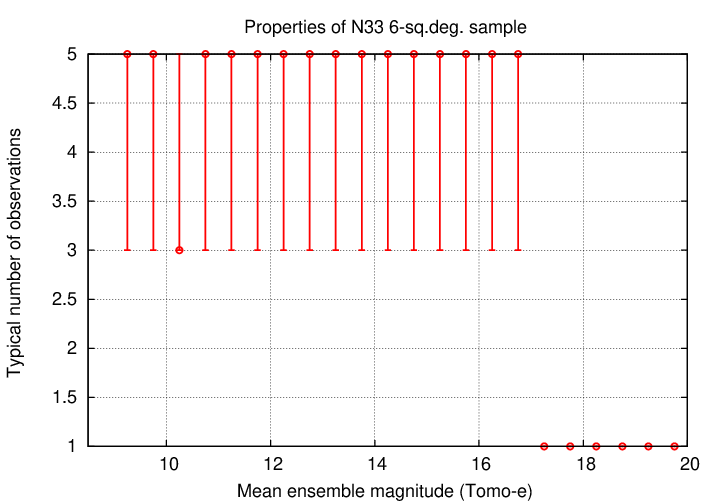
Each star appeared in the dataset relatively few times.
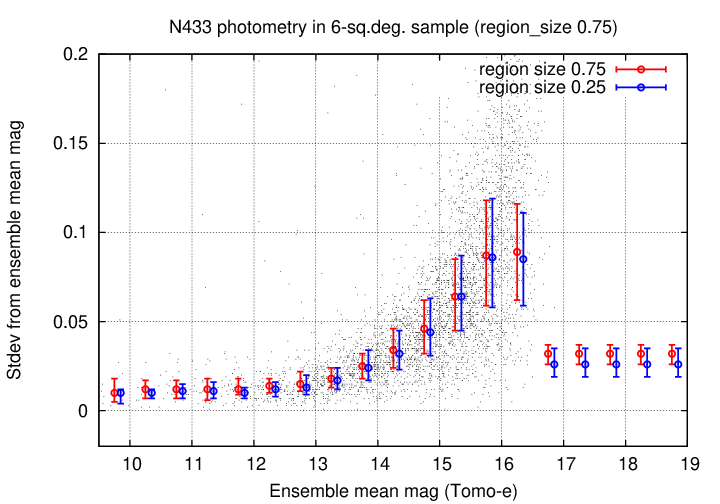
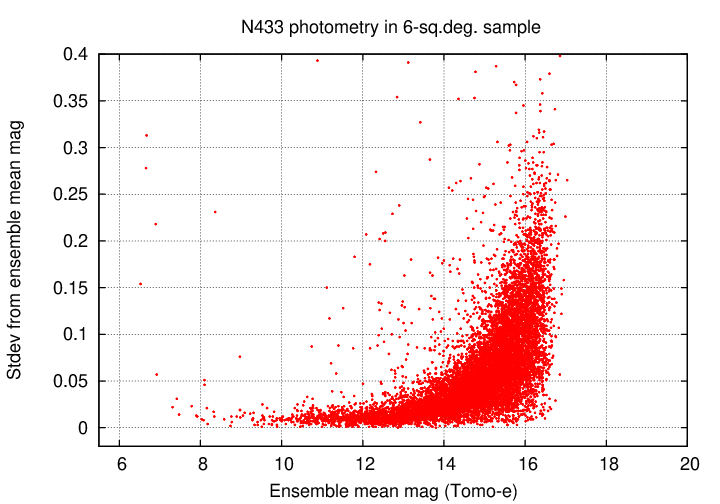
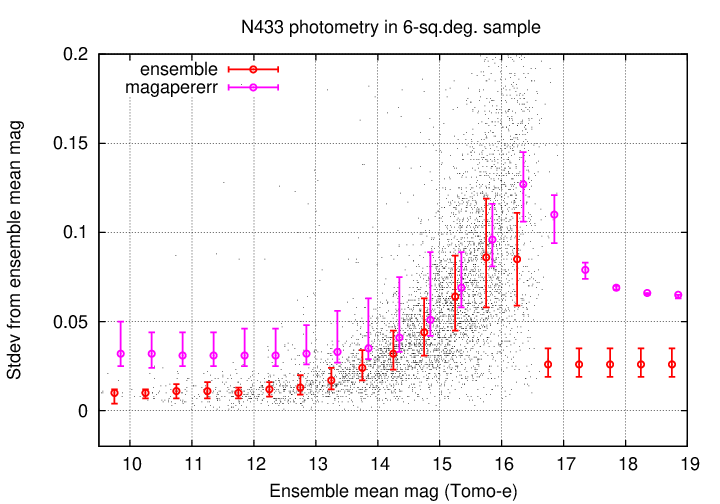
One of the primary results of ensemble analysis is a measurement of the scatter in the magnitudes of a star around its mean value. The results for this dataset show the usual features of such an analysis.
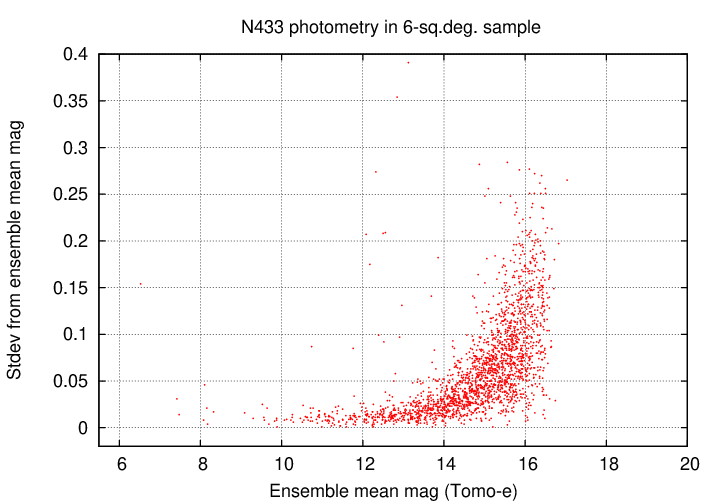
The graph below shows the same data, just using smaller symbols to show features in the dense regions of the graph.
I divided the stars in bins of width 0.5 magnitude and computed median and interquartile mean of the scatter within each bin.
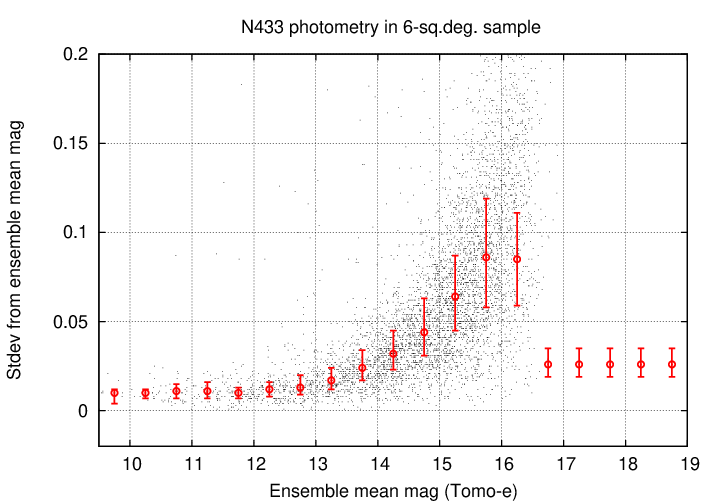
Note that the scatter in these measurements at some particular magnitude is somewhat smaller than the uncertainty estimated by SExtractor, presumably based on electron statistics alone. This is contrary to the case for unfiltered measurements, for which the SExtractor estimates are smaller than the ensemble stdev values at the bright end.
Now, as mentioned earlier, the size of a Tomo-e sensor is roughly 2000 x 1128 pixels, each 1.2 arcseconds in size; thus, the sensor covers a region 2400 x 1354 arcseconds, or 0.66 x 0.38 degrees. My default for ensemble work has been to create ensembles which are roughly 0.25 degrees wide and high; these should contain stars which cover only a portion of a single detector. See the figure below for the regions covered by the default ensembles.
I ran a second analysis of this same data, this time selecting stars from the database which fell into larger regions, 0.75 degrees on a side.
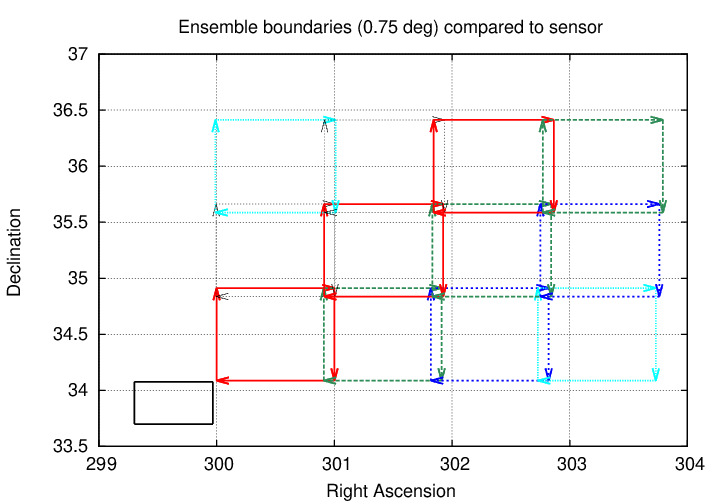
The ensembles in this analysis might contain stars from several different detectors in a single exposure; thus, if each detector had a significantly different zero-point offset for some reason, we would expect the results to show larger scatter (as the ensemble analysis can only account for a single shift in magnitude per epoch).
However, the end results for ensembles created from small and large areas are very similar: