So you're interested in contributing to astronomy by measuring the brightness of supernovae? Well, I have some good news and some bad news.
The good news is:
The bad news is:
Let me try to explain some of the issues involved with making proper measurements of the magnitude of a supernova. I'll use SN 2011fe in M101 as an example. Some of the topics I'll discuss are
If you want to share your results on supernovae with other astronomers, you have to bite the bullet and purchase a set of standard filters.(*)
(*)Well, almost. If you get lucky, and just happen to be taking a picture of a galaxy when, unknown to all, a supernova is just starting its rise to stardom, we'll be interested in your pictures no matter what sort of filter you used (even if there's no filter). With a lot of work, we can gain a little information from this otherwise hidden early evolution. For examples, see SN 1994I in M51 and SN 2005cs in M51
What do I mean by "standard filters?" I mean either the Johnson-Cousins UBVRI set, or the SDSS ugriz set. The common "RGB" filters you might find included with an inexpensive CCD camera do not count. Speaking of CCD cameras, you'll need to use a monochrome camera -- not one which has red and green and blue filters covering individual pixels on the focal plane.
Where can you get these filters? The following lists are simply examples gleaned from a quick search; I am not recommending any particular manufacturer (though I welcome reviews).
Why do you have to use the standard filters? When you compare your measurements to mine, a problem will occur if
Look carefully at the differences between measurements of SN 1987A by astronomers at South America (CTIO) and Africa (SAAO) in the graph below. Note the scale on the y-axis.
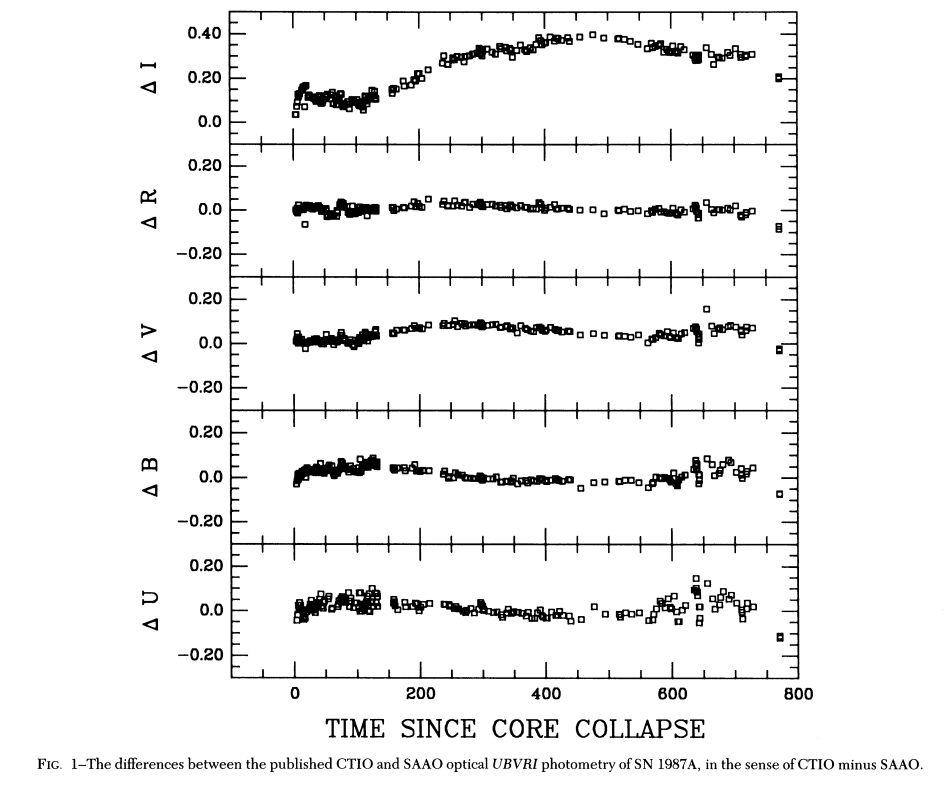 Image taken from
Hamuy et al., PASP 102, 888 (1990)
Image taken from
Hamuy et al., PASP 102, 888 (1990)
You can find a brief explanation of color terms and the trouble with supernovae (see "DO use the proper astronomical filters") in some other material I've written; I'll come back to this later.
In my examples, I'll use the BVRI filters from the Johnson-Cousins system. Very few people use the U-band (Johnson-Cousins) or u-band (SDSS) because it's just too dependent on the atmosphere, and because detectors tend to be insensitive at such short wavelengths.
There are a lot of astronomical catalogs, but you can't just choose any one of them to supply the magnitudes of your comparison stars. There are (at least) three problems:
The best way to find good comparison stars is to follow the lead of an expert. The AAVSO has spent decades compiling good sequences of comparison stars for many areas of the sky, so they are the first place I'd check. For SN 2011fe, for example, they provide the following set of stars:
| AUID | RA. | Dec. | Label | U | B | V | Rc | Ic | J | H | K | Comments | |
| 000-BKD-627 | 14:01:24.41 [210.35172d] | 54:21:53.8 [54.36494d] | 91 | - | 9.497 (0.052)1 | 9.062 (0.034)1 | - | - | - | - | - | ||
| 000-BKD-527 | 14:03:49.86 [210.95775d] | 54:09:05.8 [54.15161d] | 117 | - | 12.268 (0.057)29 | 11.735 (0.040)29 | 11.359 (0.048)29 | 11.006 (0.054)29 | - | - | - | ||
| 000-BKD-528 | 14:04:21.68 [211.09033d] | 54:19:22.4 [54.32289d] | 119 | - | 12.572 (0.068)29 | 11.948 (0.047)29 | 11.528 (0.056)29 | 11.134 (0.063)29 | - | - | - | ||
| 000-BKD-578 | 14:04:42.12 [211.17551d] | 54:21:06.4 [54.35178d] | 123 | - | 13.057 (0.075)29 | 12.319 (0.047)29 | 11.911 (0.055)29 | 11.528 (0.061)29 | - | - | - | ||
| 000-BKD-529 | 14:02:00.79 [210.50330d] | 54:23:15.8 [54.38772d] | 128 | - | 13.553 (0.062)29 | 12.751 (0.031)29 | 12.253 (0.045)29 | 11.788 (0.056)29 | - | - | - | ||
| 000-BKD-530 | 14:01:55.32 [210.48050d] | 54:16:21 [54.27250d] | 131 | - | 13.540 (0.064)29 | 13.094 (0.044)29 | 12.716 (0.051)29 | 12.361 (0.056)29 | - | - | - | ||
| 000-BKD-531 | 14:02:02.00 [210.50833d] | 54:20:43.9 [54.34553d] | 133 | - | 14.188 (0.094)29 | 13.291 (0.057)29 | 12.772 (0.074)29 | 12.287 (0.088)29 | - | - | - | ||
| 000-BKD-532 | 14:01:49.79 [210.45746d] | 54:23:02.7 [54.38408d] | 134 | - | 14.187 (0.047)29 | 13.436 (0.033)29 | 12.970 (0.049)29 | 12.534 (0.061)29 | - | - | - | ||
| 000-BKD-533 | 14:03:13.67 [210.80696d] | 54:15:43.4 [54.26205d] | 138 | - | 14.699 (0.091)29 | 13.801 (0.046)29 | 13.230 (0.062)29 | 12.698 (0.074)29 | - | - | - | ||
| 000-BKD-534 | 14:02:54.17 [210.72571d] | 54:16:29.5 [54.27486d] | 140 | - | 14.557 (0.107)29 | 13.991 (0.074)29 | 13.581 (0.078)29 | 13.197 (0.083)29 | - | - | - | ||
| 000-BKD-535 | 14:02:29.54 [210.62308d] | 54:16:55.2 [54.28200d] | 141 | - | 14.959 (0.102)29 | 14.100 (0.045)29 | 13.598 (0.063)29 | 13.130 (0.077)29 | - | - | - | ||
| 000-BKD-536 | 14:02:31.15 [210.62979d] | 54:14:03.9 [54.23442d] | 146 | - | 15.158 (0.078)29 | 14.605 (0.029)29 | 14.204 (0.061)29 | 13.828 (0.082)29 | - | - | - | ||
| 000-BKD-540 | 14:01:50.86 [210.46191d] | 54:16:08.1 [54.26892d] | 149 | - | 15.373 (0.010)29 | 14.925 (0.000)29 | 14.635 (0.006)29 | 14.361 (0.008)29 | - | - | - | ||
| 000-BKD-538 | 14:03:23.74 [210.84892d] | 54:14:32.6 [54.24239d] | 155 | - | 16.015 (0.042)29 | 15.475 (0.000)29 | 15.133 (0.046)29 | 14.811 (0.065)29 | - | - | - | ||
| 000-BKD-539 | 14:03:05.64 [210.77350d] | 54:17:26.2 [54.29061d] | 162 | - | 16.776 (0.091)29 | 16.177 (0.000)29 | 15.640 (0.079)29 | 15.140 (0.112)29 | - | - | - | ||
| Report this sequence as: 5254nd in the chart field of your observation report. This table is for a 0.25000° fov around PTF11KLY, RA: 14:03:05.81 (210.77421) & Decl.: 54:16:25.40 (54.27372). | |||||||||||||
If the AAVSO doesn't provide what you need, you might try to look for earlier studies of the same galaxy. Searching the Astrophysics Data Service for titles with the words "M101" and "supernova" yields a list of papers; alas, none of these provide a good photometric sequence. You might have better luck with some other galaxy....
When a supernova is at its peak, it often overwhelms the light of its host galaxy. Measuring the light of such a supernova is easy: just add up all the light within a region centered on it, subtract the contribution of the general background of the image, and you're done.
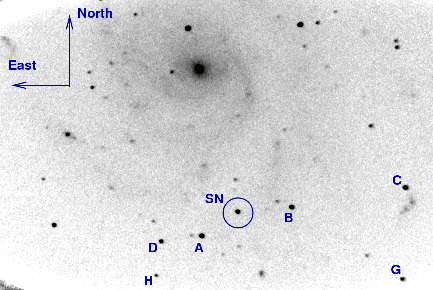
SN 2011fe is (at the moment) one of these easy cases. In the picture below, you can barely see the light of the galaxy at the supernova's position.
On the other hand, what happens if you want to measure the light of an object like, say, SN 1994D, which was very close to the nucleus of its host galaxy?
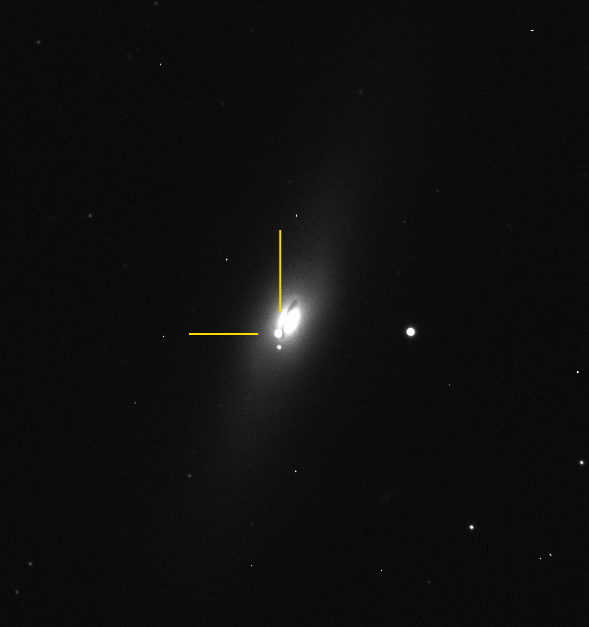
The background "underneath" this supernova is changing rapidly: you can see that the pixels below the supernova contain less light than those above the supernova, for example. How can one measure the light from the supernova alone, without subtracting away too much or too little of the light of the background galaxy?
This is definitely a tricky business. There are several different approaches, with different levels of correctness. You can read about some of those methods in this document ; see the section labelled DON'T ignore contamination by other sources of light .
There is now an additional document devoted to the topic of color terms: How to measure color terms for your camera
What are color terms? They are small adjustments which, we hope, will correct for differences between your instrumental setup (detector + filter + telescope + atmosphere) and the standard setup used to establish the Johnson-Cousins or SDSS magnitude system. In simple form, they look something like this:
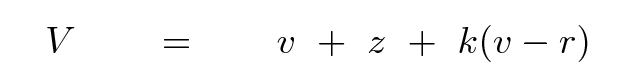
where
          V       is the calibrated, standard V-band magnitude

          v       is the raw, instrumental V-band magnitude

          r       is the raw, instrumental R-band magnitude

          z       is the zeropoint of the image

          k       is the first-order color term for V
                       as a function of (v - r)
How does one determine the color terms for one's equipment? That's a good question -- and I'll provide an explanation at a later time. For the moment, let's work through one particular example to see how this works.
I determined that the V-band color term for (v-r) for my equipment is k = -0.077. That means that if I find that two stars appear to have exactly the same brightness through my V-band filter, but one of which has color (v - r) = 0.0 and the other (v - r) = 1.0, then then the two stars will actually have V-band magnitudes which differ by about 0.077 magnitudes.
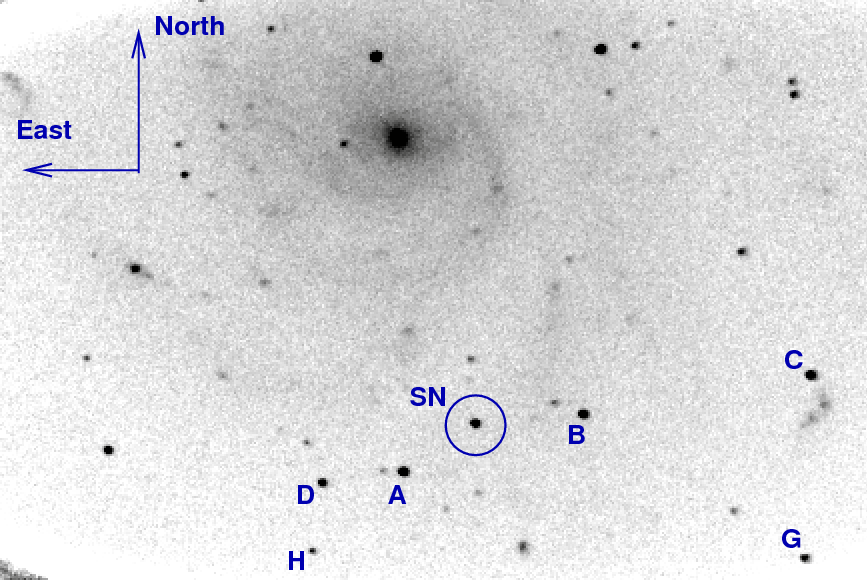
Okay. On the night of UT Aug 26, 2011, I measured the following instrumental magnitudes for SN 2011fe and the stars labelled "A", "B" and "C" in the picture above.
Remember, these are instrumental magnitudes -- something like 25 - log10(counts - sky). None of these stars is really a first-magnitude object.
star         b         v          r        i
-------------------------------------------------
A           1.387     0.845     0.732     0.441
B           1.253     0.992     1.002     0.939
C           1.624     1.114     1.010     0.804
SN          0.000     0.000     0.305     0.625
-------------------------------------------------
Note that all 3 stars are roughly the same color -- (v - r) = -0.1. The supernova, on the other hand, is considerably bluer: (v - r) = -0.3.
The AAVSO's sequence for this field yields the following magnitudes on the standard Johnson-Cousins system:
star         B         V          R        I
-------------------------------------------------
A          14.699    13.801    13.230    12.698
B          14.557    13.991    13.581    13.197
C          14.959    14.100    13.598    13.130
-------------------------------------------------
Now, if I didn't worry or know about the color terms, I would compare the instrumental v measurements of stars A, B, C to the standard V measurements and find the offset between the two sets of values ...
  A      V - v  =   12.956
  B      V - v  =   12.999
  C      V - v  =   12.986
                  ---------
          avg       12.980
... and then I'd add this offset to my instrumental magnitude for the SN:
SN V = 0.000 + 12.980 = 12.980 wrong!
However, I DO know about color terms. What I need to do is to use my measured values of v and r and the AAVSO's values of V for the three stars, plus my known value of k, to solve for the constant z in this slightly more complicated equation:
After a little mathematics, I find the result is
V = v + 12.986 - 0.077(v - r)
So, now I can compute the V-band magnitude of the supernova like so:
  SN     V  =   0.000  +  12.986  -  0.077(0.000 - 0.305)

            =   0.000  +  12.986  -  0.023

            =   12.963                          right!
How big is the difference between this value and the one determined without color terms? Not very big: only about 0.02 magnitudes. However, in many cases, supernovae may be so different in color from most of the comparison stars that this type of error might be 0.05 magnitudes or even larger. When different observers try to combine their measurements, even a small systematic difference can look pretty big.
One very widely used method of doing photometry involves three objects: the target star, the comparison star, and the check star. One uses two differences for each measurement:
For many variable stars, this is a fine system: careful study over several months or years can verify that neither the comp nor the check star is a variable, and one has plenty of time to identify stars which are close to the target star in magnitude and color and position in the sky.
For supernovae, though, this often doesn't work out so well. First, since we don't know where the SN is going to explode, so we can't do the preliminary work to identify which of the nearby stars happen to be constant. Second, as a supernova waxes and wanes, its brightness may change by 3 or 4 magnitudes or more. A star which is similar to the SN early on, and thus a good comparison, may be so much fainter than the SN at maximum light that it really doesn't work very well: it may be too faint to provide many photons in an exposure which is short enough to avoid saturating the SN.
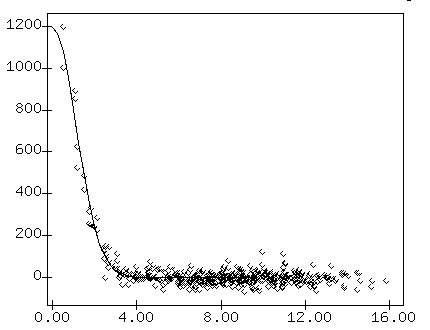
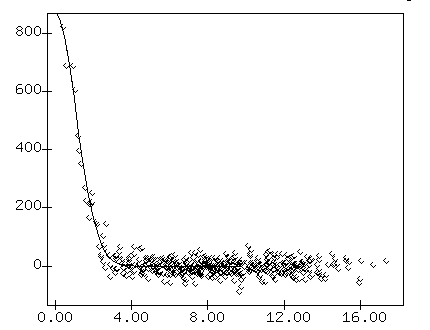
The case of SN 2011fe provides a good example. Below are measurements made from an image taken on UT 2011 Aug 26: on the left is the radial profile of the star marked "A" in the chart above, and on the right, the radial profile of the supernova in the same image. You can see that the SN is just a little bit fainter than star "A", so comparing it to star "A" is a good choice on this night.
On the other hand, just about one week later, on UT 2011 Sep 04, look at the profiles of the same stars. The SN is now about 16 times brighter than star "A"!
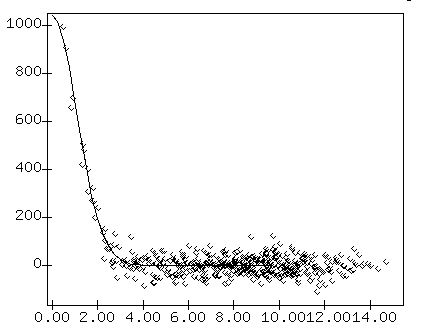
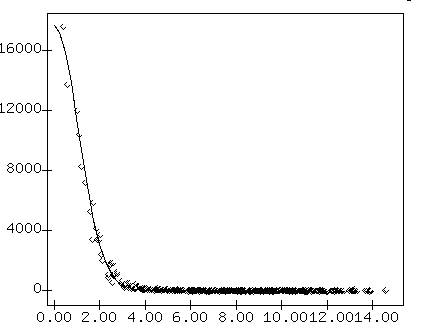
If we use star "A" as the sole comparison star at both early and late times, we risk ruining very good measurements of the supernova by comparing them to mediocre measurements of the much fainter star.
One way to deal with this problem is to use a set of stars of different magnitudes as comparisons. You could simply choose to measure against star "A" when the supernova is faint, then switch to a bright star "K" when the supernova grows brighter; as long as the magnitudes of those two stars have been calibrated in the same way by the same person, so they are completely consistent, that's not a bad idea. But an even better idea is to use as many stars as possible in as many images as possible, excluding only stars which are saturated or so faint that their measurements are uncertain. By averaging together the measurements of many stars, you can improve both the accuracy and the precision of your result.
The term for this is "ensemble photometry". I recommend the paper CCD ensemble photometry on an inhomogeneous set of exposures for a clear explanation of the benefits of this technique, and a very clear exposition of the mathematics. You can also find a simpler discussion of the idea in the JAAVSO; see Differential Ensemble Photometry by Linear Regression. If you are interested in pursuing this idea, you can find software to do the calculations in several places:
I'd like to be able to combine my measurements of SN 2011fe, made at the RIT Observatory, with those made elsewhere. For one thing, the bad weather in Rochester, NY, has left gaps in my measurements. For another thing, I'd like to verify that I haven't made any fundamental mistakes in my data reduction and analysis.
You can grab a copy of my measurements from the link below:
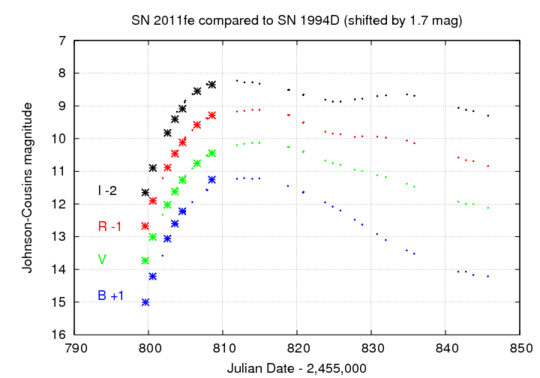
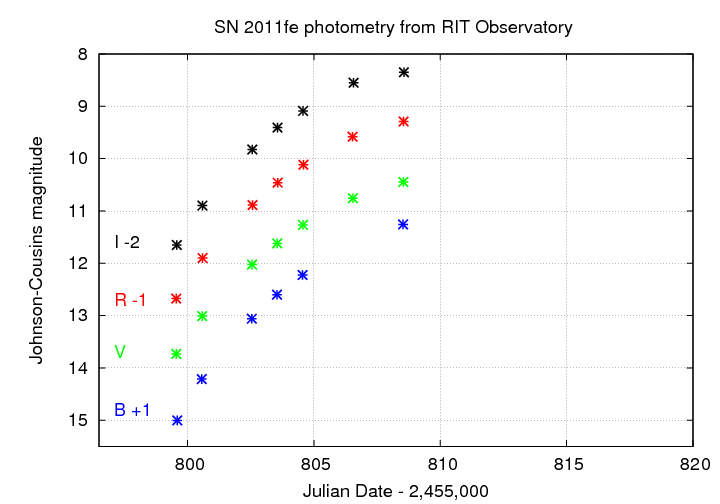
Here's a light curve, showing my measurements of SN 2011fe in the BVRI passbands. I've shifted the measurements made in different filters so that they don't all interfere with each other.
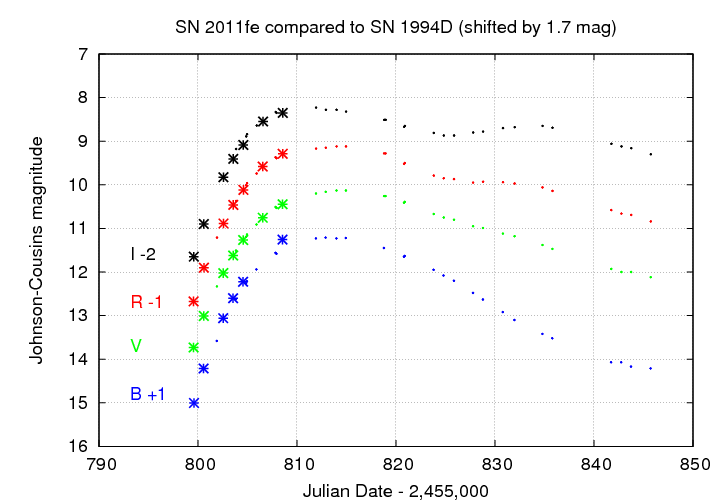
Spectral measurements of SN 2011fe suggest that it may be a relatively "normal" Type Ia supernova, similar to SN 1994D, which occurred in a galaxy in the Virgo cluster a while ago. I had some measurements of SN 1994D lying around, so I shifted them roughly to line up with the early data on SN 2011fe. This gives us an idea for what we might see from SN 2011fe over the next few weeks.
Last modified 9/05/2011 by MWR.