Click on picture to download a Postscript version.
I have been working on my photometric simulation of the SNAP telescope. As described in earlier documents,
this simulator is designed to produce realistic instrumental magnitudes without going as far down as the pixel-by-pixel details. I will use it to evaluate different observing techniques.
I have finally put into the simulation all the effects required to calculate accurately the number of photons registered by the detectors on the focal plane for stars of arbitrary position, magnitude and spectral type. There are hooks for adding the effects of readout noise, dark current, background sky, etc., but those sources of noise are not yet implemented.
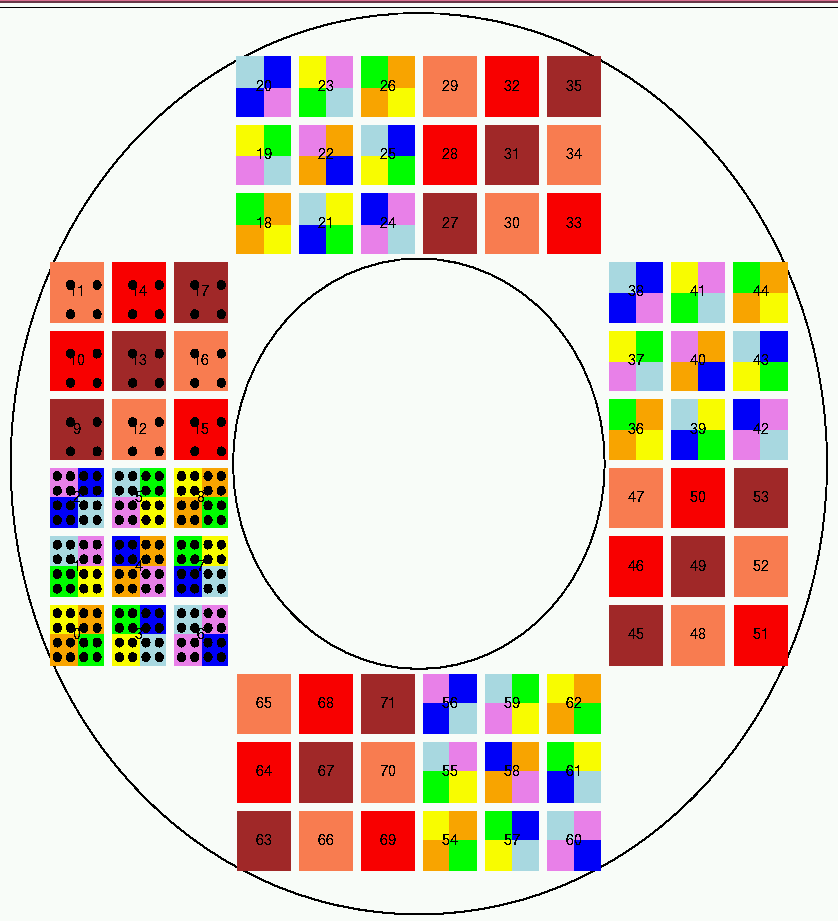
As a first demonstration (and verification) of the simulator, I created a grid pattern of stars in the sky near the SNAP northern field. The stars fall only in one quadrant of the detector; I don't yet include asymmetric effects, so one quadrant includes all effects.
Click on picture to download a Postscript version.
The input catalog contains stars of three spectral types: A0V (hot), G0V (sun-like), and M0V (cool). The spectra are taken from A Stellar Spectral Flux Library: 1150 - 25000 A by Pickles ( 1998PASP..110..863P ). My simulation allows me to place stars on top of each other without any interference or cross-talk from each other (I warned you that it isn't realistic in some ways ...), so I put one star of each of these types at each position in the grid. Therefore, four stars of each spectral type fall within the field of each filter.
Some notes on the current state of the simulator:
How many photons per second will be recorded by the detectors? The Pickles spectra are normalized at 5556 Angstroms, near the effective wavelength of the Johnson-Cousins V passband. I therefore assumed that the Pickles model spectrum of each star is normalized to have the same V-band magnitude. In other words, I assumed that the A0V spectrum from the Pickles library and the K0V spectrum from the Pickles library represent two stars with the same V-band magnitude. Of course, the K0V spectrum rises towards the red, while the A0V spectrum falls towards the red. Thus, we expect that if an A0V and K0V star provide the same number of photons in the V-band, the K0V star will provide many more photons in the I-band, or in the near-infrared.
I chose stars of magnitude V=20 as representative of stars SNAP will observe. One can easily translate the results below to V=15 by multiplying the number of photons by 100, or to V=25 by dividing by 100.
I ran the Pickles spectra for these stars through the simulator and calculated the number of photons which would be detected each second.
    detected photons per second from star of mag V=20

  Filter          A0V          G0V         M0V
-----------------------------------------------------------
    0             169          103          50
    1             203          173         132
    2             207          233         278
    3             207          300         520
    4             202          356         844
    5             160          314         923

    6             109          238         913
    7              89          218        1075
    8              71          200        1230
-----------------------------------------------------------
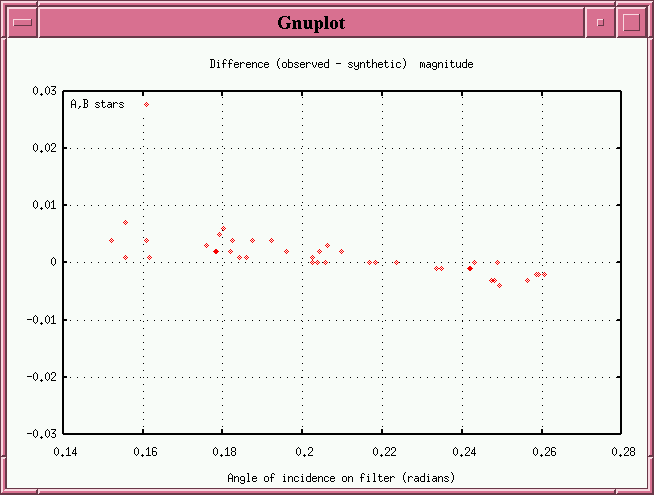
I then modified my simulator to enable changes in the effective passband due to the angle at which light strikes the filters. A very quick look at the results, for stars of spectral class A0V only, shows the following variations in number of photons detected per second at different locations on the focal plane.
  variations in (photons/sec) of A0V star across grid

  Filter          min        max      delta_mag
-----------------------------------------------------------
    0             169.08   169.58      0.0030
    1             202.39   203.34      0.0047
    2             205.87   207.28      0.0068
    3             205.80   207.33      0.0074
    4             201.50   203.02      0.0075
    5             159.51   160.44      0.0058

    6             108.50   109.61      0.0102
    7              88.20    89.16      0.0109
    8              71.19    71.73      0.0076
-----------------------------------------------------------
The size of this effect -- about 0.01 magnitudes peak-to-peak for an A0V star -- is consistent with results I calculated in a more straightforward manner some time ago:
I will continue to study these effects, both to verify that my simulation produces accurate results, and to start to consider their impact on observing strategy.