The SNAP project has designed a set of filters which allow one to measure properties of supernovae over a range of redshifts. In this document, I point out how the actual overall passbands differ from that of the filters alone.
The three main factors in determining the overall passband are
There are four mirror surfaces in the SNAP telescope. I considered two coatings:
Below is a graph of the reflectivity as a function of wavelength for one bounce, and for four bounces, for each material.
The SNAP filters are based on a filter like Johnson B, with copies which have wavelengths multipled by 1.16^N, N ranging from 1 to 8. The first 6 filters cover optical CCD detectors, and the final 3 filters cover near-IR detectors.
In the files below, the wavelengths are given in Angstroms, not nanometers.
Each type of detector has its own spectral sensitivity.
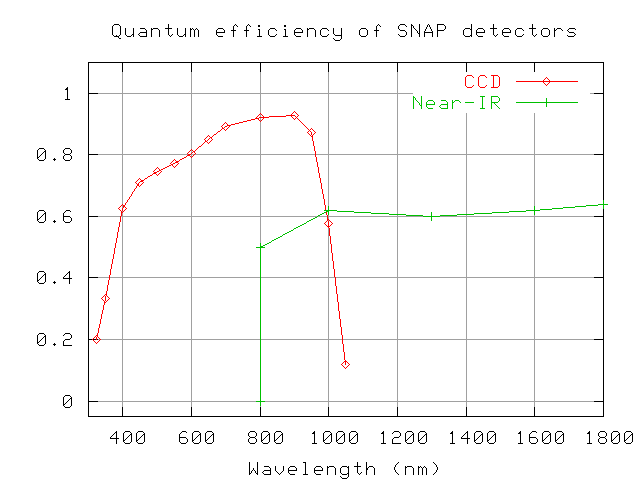
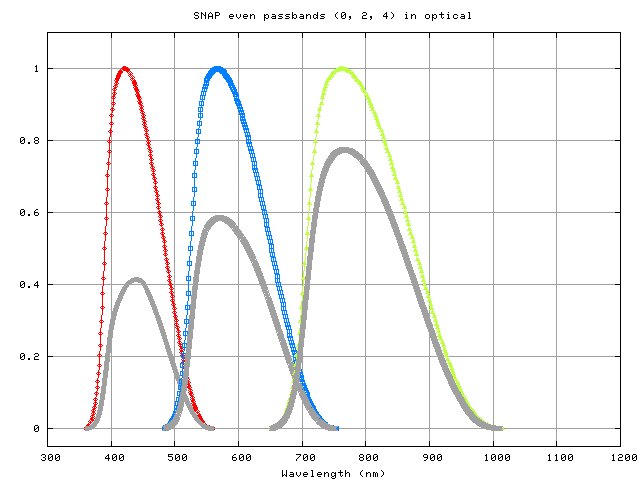
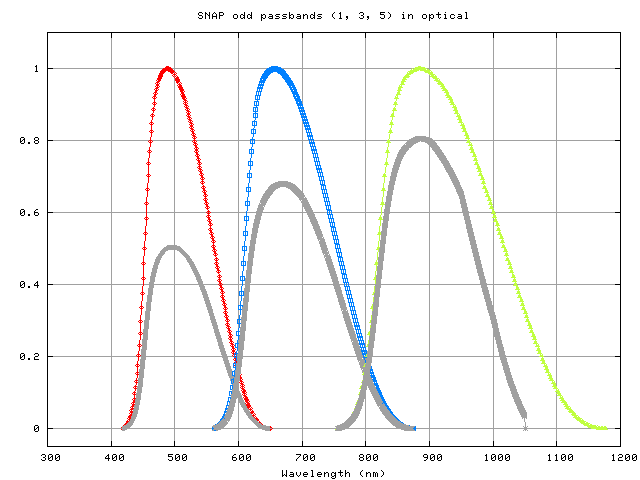
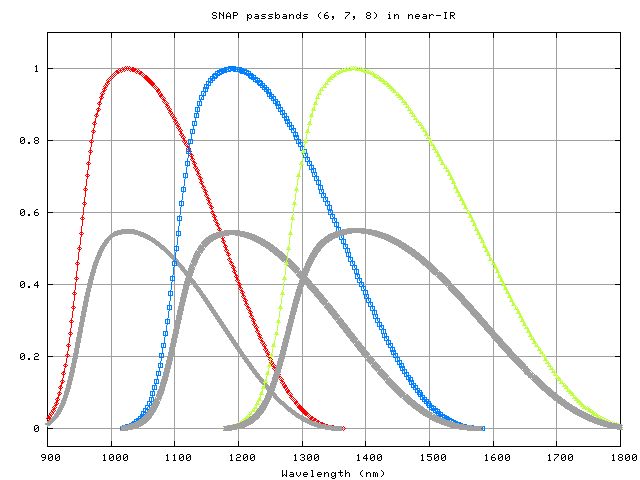
If we combine the effects of mirrors, filters, and detectors, we end up with overall passbands which differ from the nominal filter transmission curves.
Optical filters 0, 2, 4:
Optical filters 1, 3, 5:
Near-IR filters 6, 7, 8:
Here are ASCII data files with the actual transmission curves for each passband. There are two columns: wavelength (in nm) and overall transmission (0.0 = no light, 1.0 = perfect transmission).
A summary of the differences:
               Difference between filter and passband for SNAP

            Filter only  Overall Passband  shift    sensitivity loss
Index  z   cent. lam (nm)  cent. lam (nm)  (nm)     (mag)    percent
-----------------------------------------------------------------------------
 0   0.0      441          447              6       0.95    -58%

 1   0.16     512          515              3       0.71    -48%

 2   0.35     594          597              4       0.55    -40%

 3   0.56     689          693              4       0.40    -31%

 4   0.81     799          800              1       0.28    -23%

 5   1.10     927          905            -22       0.41    -31%

 6   1.44    1076         1077              1       0.66    -45%

 7   1.83    1248         1248              0       0.66    -45%

 8   2.28    1447         1450              3       0.64    -44%
--------------------------------------------------------------------------

updated 5/20/2004