In order to detect variations in photometry due to small changes in filter properties, one must start from exactly known quantities. I have created self-consistent catalogs in the following manner:
The result is a list of synthetic magnitudes which can be exactly reproduced, given a spectral type and set of filters. The distribution of spectral types will be decent approximations to the actual distribution (which is not known). The spectra will be decent approximations to the true spectra
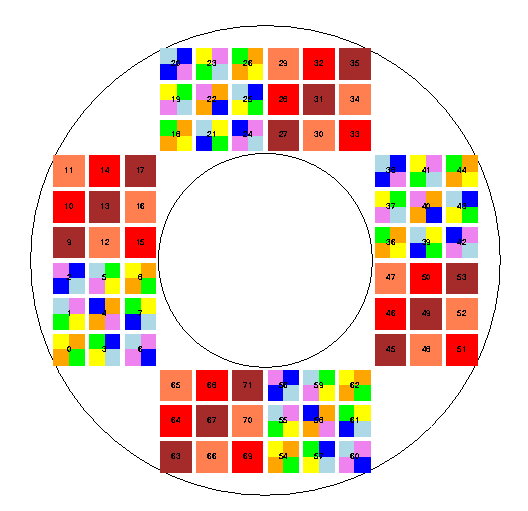
The focal plane model is based on Chris Bebek's presentation Dimensioning the focal plane, 9 July 2003, revised 14 July 2003. A picture of the focal plane model. Click on the picture to get a Postscript version.
There are 72 detectors in the focal plane. Each near-IR detector has one filter deposited on it. Each CCD has 4 filters, one per quadrant. The 9 fiducial filters are based on Alex Kim's document SNAP "B" filter in the "PS15F0 Instrument - Filter Development" section of the SNAP BSCW archive. There are a total of 180 individual filters over the focal plane. Each one may be individually tweaked from its fiducial transmission curve.
There are 3 coordinate systems in the model:
Actually, there's a fourth coordinate system, used to draw items.
The basic idea goes something like this:
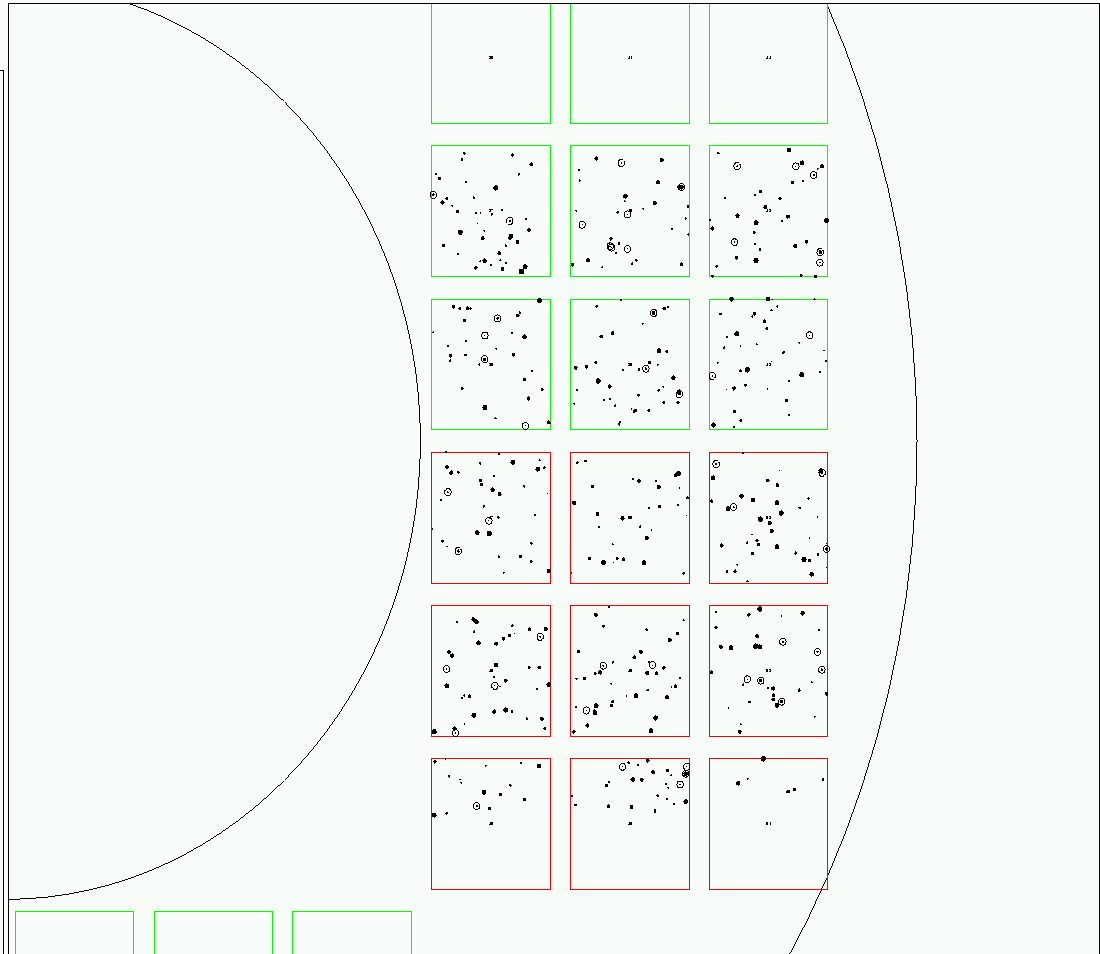
Below are some pictures showing a picture of the simulation results. This is a shot of one sector of the focal plane, showing stars brighter than V=20 from the USNO-A2.0 catalog.

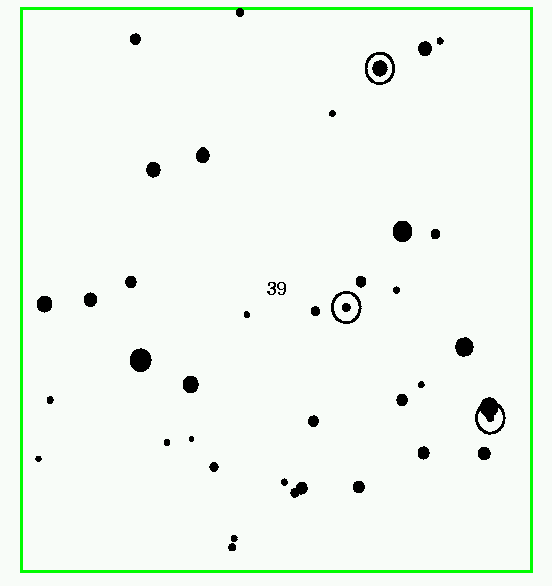
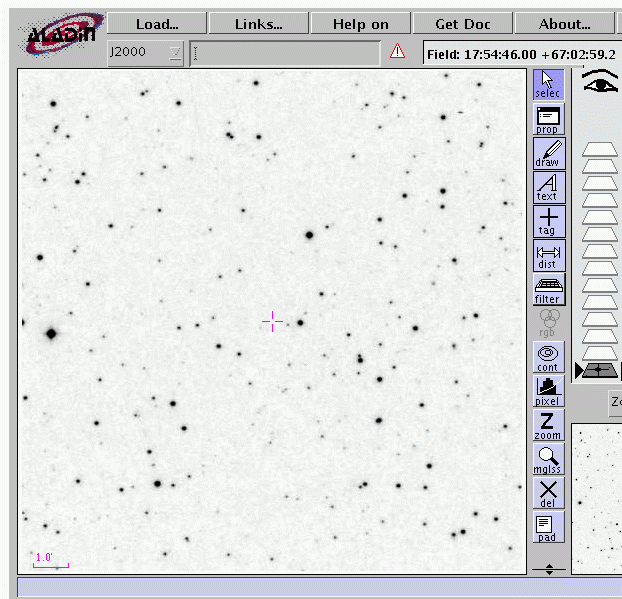
And here's a closeup of chip number 39: the simulation version, and then a picture of the real sky. The center of this chip lies near RA = 17:54:46, Dec = +67:02:59. You can see that the chip covers only the central portion of the 14x14 arcminute field shown in the real image. Objects drawn without a ring range from magnitude 15 to 20, those with a ring from 10 to 15.


Note that the simulation is actually calculating instrumental magnitudes for stars in four different filters, one per quadrant of this detector (starting in the lower-left corner and running clockwise, the filters are approximately R, B, V, I). The real image, on the other hand, depicts all stars as seen through a single red bandpass.