 Copyright © Michael Richmond.
This work is licensed under a Creative Commons License.
Copyright © Michael Richmond.
This work is licensed under a Creative Commons License.
I'm reporting on the work of many other people, as this press release shows. Special thanks go to Masao Sako and Ben Dilday, who kindly provided copies of the material they created for their recent papers (Ben's and Masao's) presented at the 207'th meeting of the AAS.
Table of contents
There is very strong evidence from a number of different fields which shows that our universe used to be a very different place.
Sometime around 12 or 15 billion years ago, this very hot, very dense universe began to expand outwards. Astronomers call the outward expansion from this initial state the Big Bang. As time has passed, the universe has become much less dense (on average) and much cooler. For example, if you were to fly a spaceship far from the Sun or any other star, and toss a ball out into space, the ball would cool off to a temperature of about 3 degrees above absolute zero; that's about -455 degrees Fahrenheit!
We understand the rough outline pretty well, but the exact details are more difficult; we don't know exactly how long ago the Big Bang happened, or exactly how fast the universe is expanding. Perhaps most frustrating is that we don't know exactly what is going to happen in the future: will the universe continue to expand forever? Will it slow down at all? Might it even stop expanding and contract back on itself?
The answers to these tough questions depend on the ingredients of our universe. To first order, there are three important pieces:
![]() non-baryonic, or "dark", matter
This stuff must be made up
of some exotic particles -- there are several
candidates, some of which have been detected,
some of which are (at the moment) purely theoretical.
Although we can't see this stuff directly,
we can detect it by its gravitational influence
on ordinary matter. The motions of stars in
our Milky Way and other galaxies, and the motions
of galaxies within big clusters, suggest very strongly
that there must be a lot of this floating around.
non-baryonic, or "dark", matter
This stuff must be made up
of some exotic particles -- there are several
candidates, some of which have been detected,
some of which are (at the moment) purely theoretical.
Although we can't see this stuff directly,
we can detect it by its gravitational influence
on ordinary matter. The motions of stars in
our Milky Way and other galaxies, and the motions
of galaxies within big clusters, suggest very strongly
that there must be a lot of this floating around.
![]() "dark energy, sometimes called
"the cosmological constant" or "lambda."
This is a theoretical property of space itself
which acts in a repulsive way to cause
empty space to expand.
"dark energy, sometimes called
"the cosmological constant" or "lambda."
This is a theoretical property of space itself
which acts in a repulsive way to cause
empty space to expand.
The more total matter (ordinary and dark together) a universe contains, the greater the gravitational forces which pull back to oppose the expansion. If there is enough matter, the expansion might even halt or reverse. On the other hand, the more dark energy there is, the more the universe will tend to expand and expand. For any particular mixture, scientists can figure out what will happen. So can you, by visiting the Fate of the Universe simulator.
We can simulate the behavior of any particular combination of these ingredients. But how can we figure out the mixture which actually makes up our own universe?
Most stars live and die in a relatively quiet manner. Our Sun, for example, will run out of fuel in its core about 5 billion years from now. When it does, it will swell up briefly, growing cooler but more luminous, but eventually shrink down into a dense sphere about the size of the Earth. This "white dwarf" will gradually cool off over billions of years, ending up as a dead, cold chunk floating in space.
On the other hand, a very few stars end their lives with a bang. There are two variations on this theme.

If enough matter falls onto the white dwarf to push its mass over a critical value (about 1.4 solar masses), nuclear reactions may run through the white dwarf, blowing it apart. Astronomers call this sort of explosion "Type Ia".
In either case, the result is a titanic explosion. We call these events supernovae. For a few weeks, they can shine more brightly than an entire galaxy of ordinary stars, as this sequence of pictures shows:
This animated GIF of SN 1998S made by Pedro Re. Click
on the image if necessary to see the evolution.
Supernovae are so luminous that we can see them in very, very distant galaxies; that means we can look back into the past history of the universe. The Type Ia explosions (in which white dwarfs accrete too much material from a companion) appear to be almost carbon-copies of each other. We can use them as standard candles (within certain limits) to illuminate the rate at which the universe has been expanding. Different models of the universe will yield a different relationship between the apparent magnitude of a supernova and its redshift:
Note that there are few supernovae in the middle of this graph, at moderate redshifts. The SDSS is a good tool to find events will fall in this gap ...
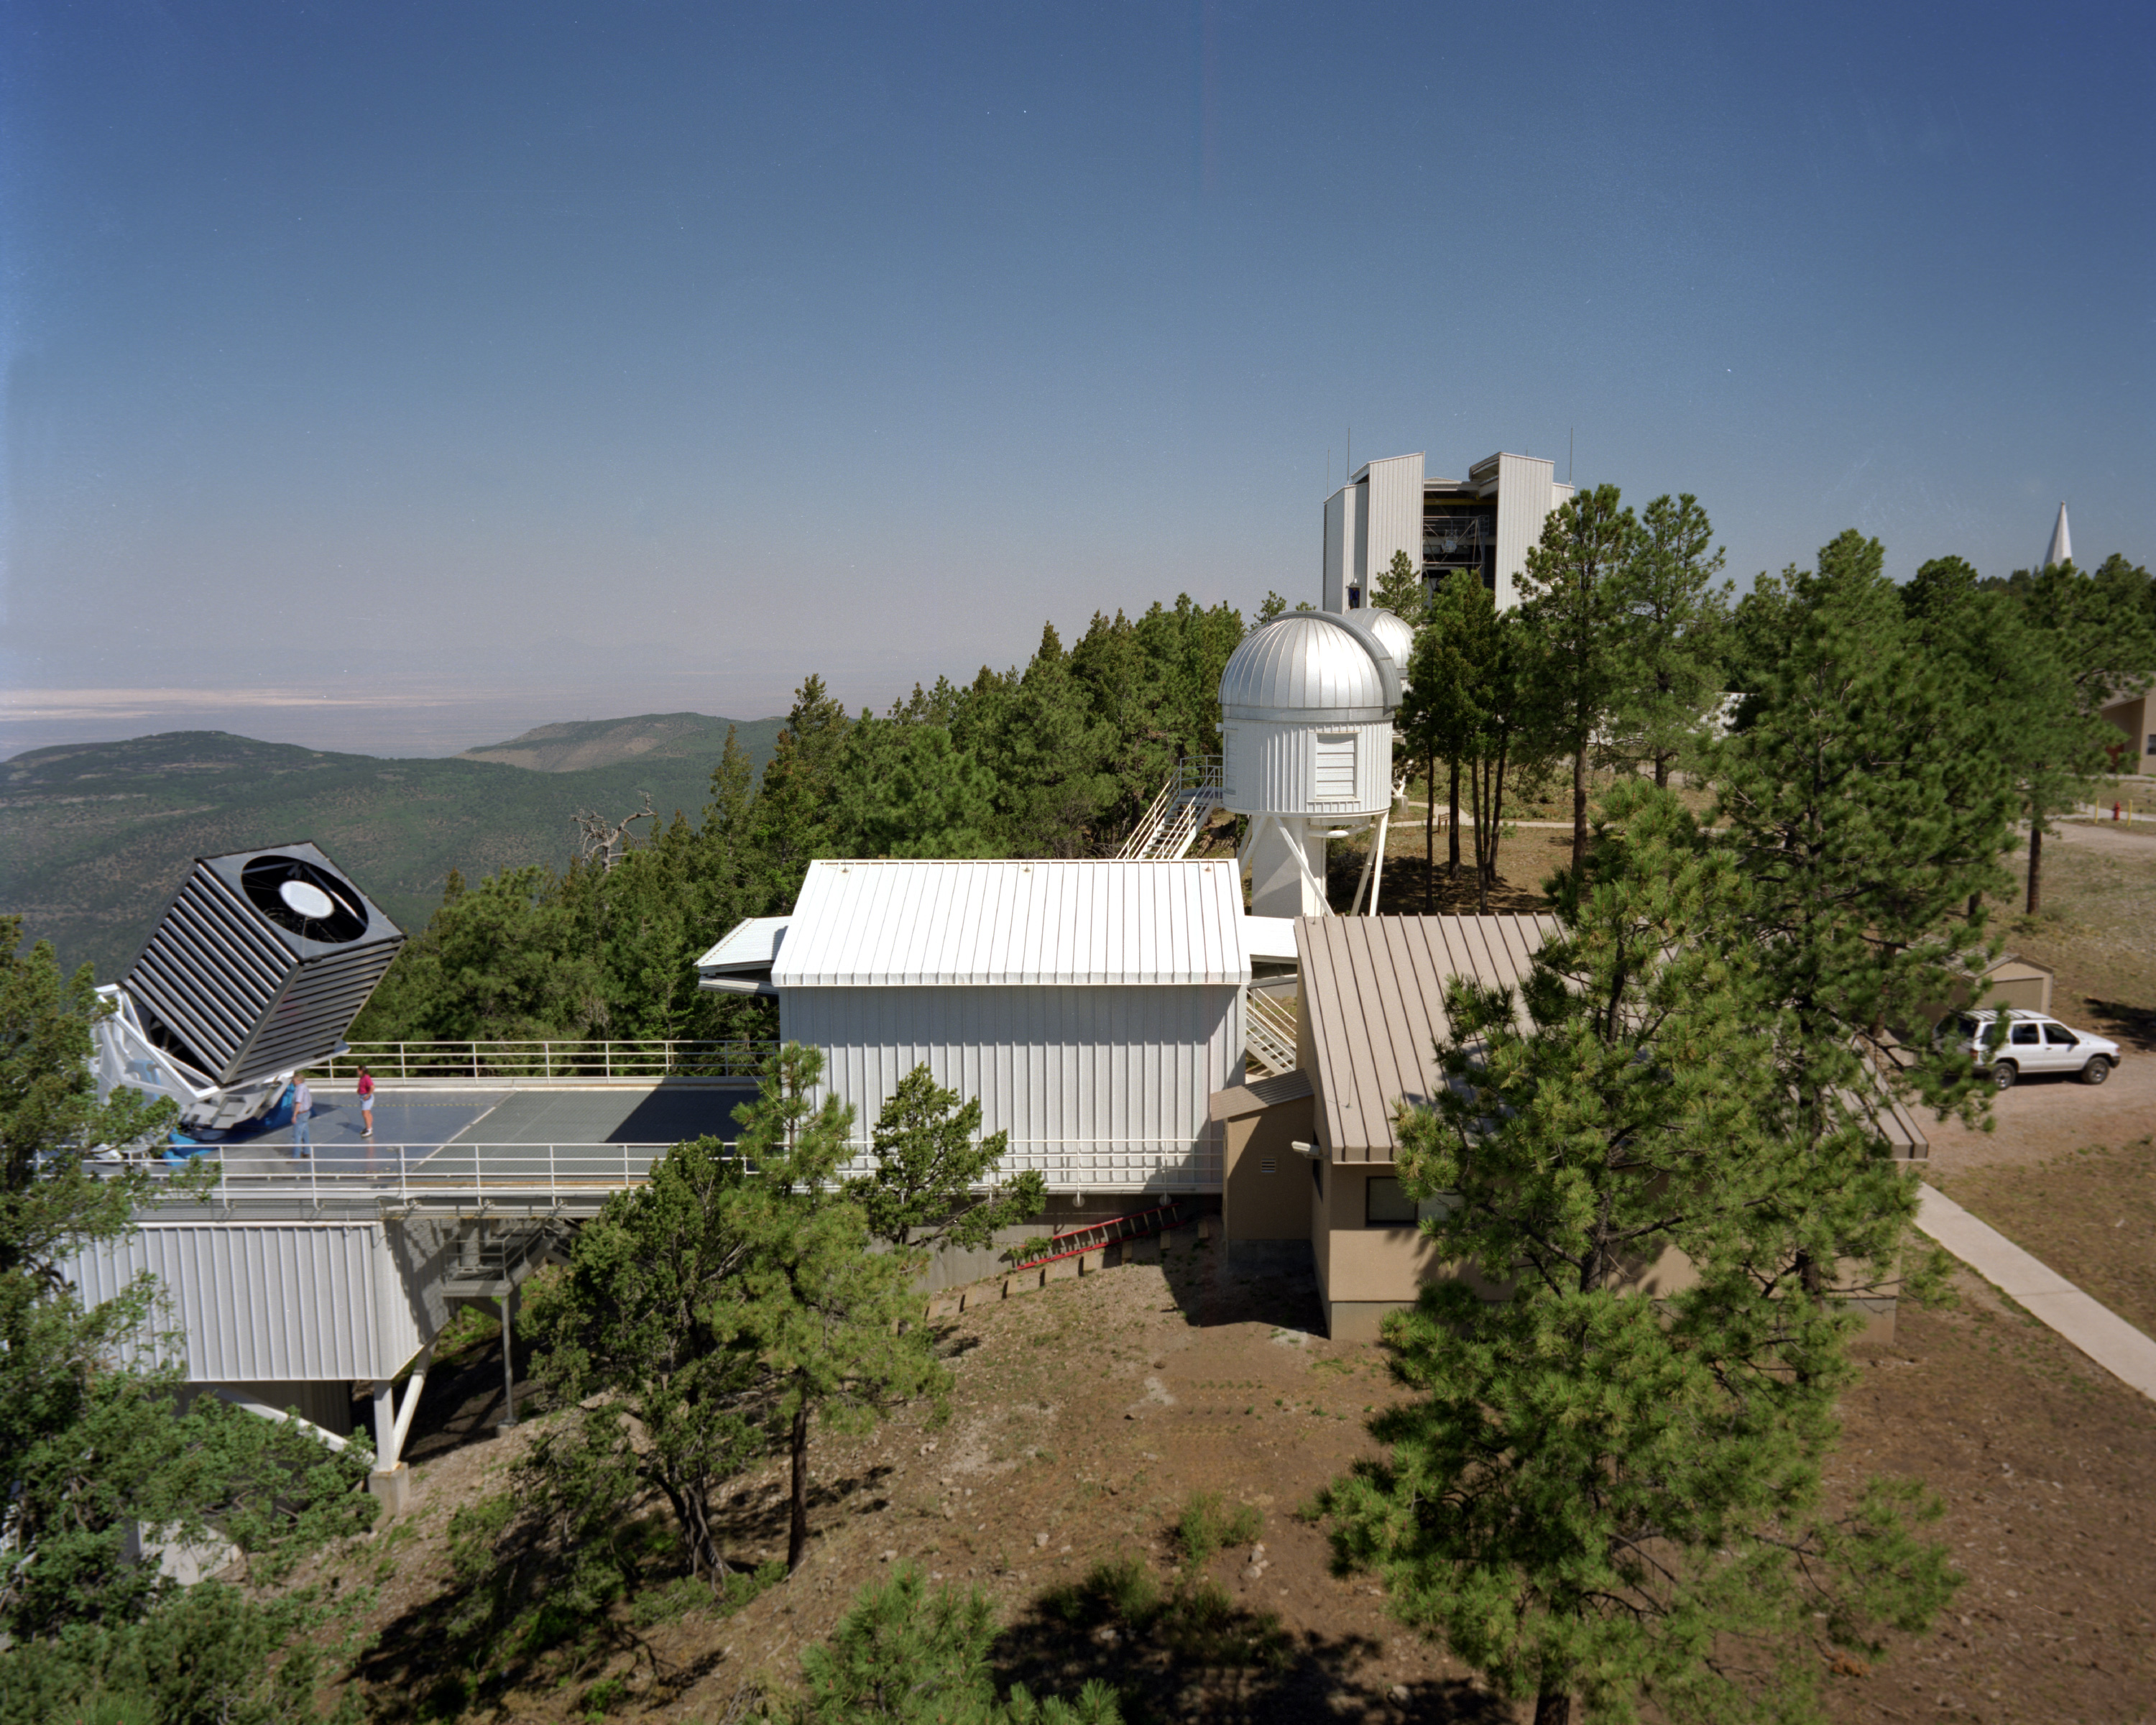
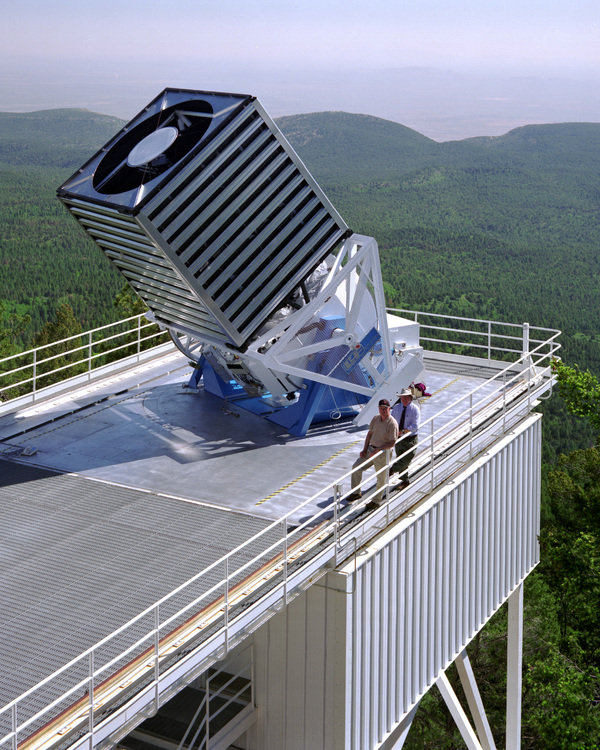
The main telescope has a telescope 2.5 meters in diameter. It sits out on a track, away from the face of the mountain, so that the prevailing west winds will sweep across the telescope smoothly before the ground and trees stir up a lot of turbulence.
The main telescope has two main instruments: a mosaic imaging camera with 30 large CCDs, which acquires images in long strips through five differert filters nearly simultaneously:
and a multi-object fiber spectrograph, which can measure the spectra of 600 objects at once.
In order to calibrate the images taken with the 2.5-meter telescope, the SDSS also includes a smaller telescope. The Photometric Telescope (PT for short) sits on top of a raised pier, again to avoid turbulence associated with the ground-air interface.
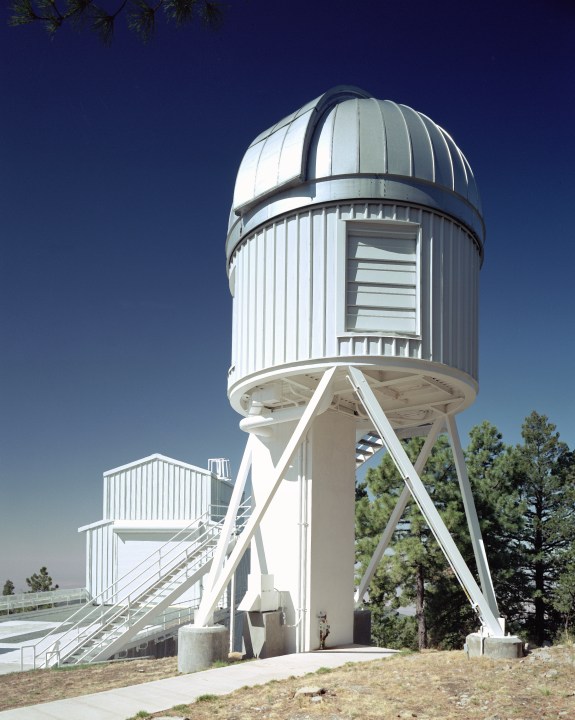
The PT's mirror is only 24 inches in diameter, but since it concentrates on "bright" stars around magnitude 15, that's not a problem.
The main goal of the SDSS has been to make a three-dimensional map of the local universe, showing the distribution of galaxies around the Milky Way.
Observations started in 1997, and they continue to this day.
During the autumn of 2005, the main SDSS telescope spent a good fraction of its time performing a special task: it scanned two particular narrow strips of the sky, roughly alternating between the two from night to night. The region of interest lies along the celestial equator and stretches about 120 degrees from end to end.
Each night, special software processed the images and then searched them for supernova candidates. The basic idea is simple: compare tonight's picture of the sky to an earlier one. If the new picture shows an object which doesn't appear on the old one, then it might be a supernova....
In theory, this sounds like a great idea, and one that shouldn't take much effort -- let the software do the work. Now, the software does do a LOT of work, picking out candidates and ignoring all the objects which don't change ... but it isn't perfect. We needed to insert humans into the process.
After each clear night of observations, a team of astronomers would use a very nice web-based tool to examine a few hundred candidates. For each candidate, we looked at a set of pictures like this:
Our job was to select the candidates which were bona fide supernova -- or might be, as far as we could tell. Most of the candidates turned out to be, well, something else. For example, diffraction spikes ...
... or asteroids ...
... or slight offsets between template and new image ...
... or the result of a saturated star which would not subtract cleanly ...
But, every now and then, we'd find a good one:
We would classify each candidate using the web-based form
A single astronomer would then collect all these classifications and select the best ones for further followup.
There are two ways to confirm that a candidate is really a supernova, and not some unusual type of variable star in our own Milky Way. These are
We were fortunate enough to be given time on a number of other telescopes -- big ones! -- to take the spectra of our best candidates. Among our tools were
With some of these telescopes, we could follow a single candidate for a long time -- 5 minutes, 10 minutes, even an hour in some cases -- and build up a good spectrum. Here are a few examples of different types of supernovae we found:
Another way to make sure that a variable object is really a supernova is to make a light curve: measure its brightness through several different filters over a period of several weeks or months. Most supernovae follow a particular path in their evolution. In some cases, we can not only confirm a candidate as a supernova, but determine its type and even its redshift.
So, how well did we do during the Fall 2005 season? We found quite a few confirmed supernovae:
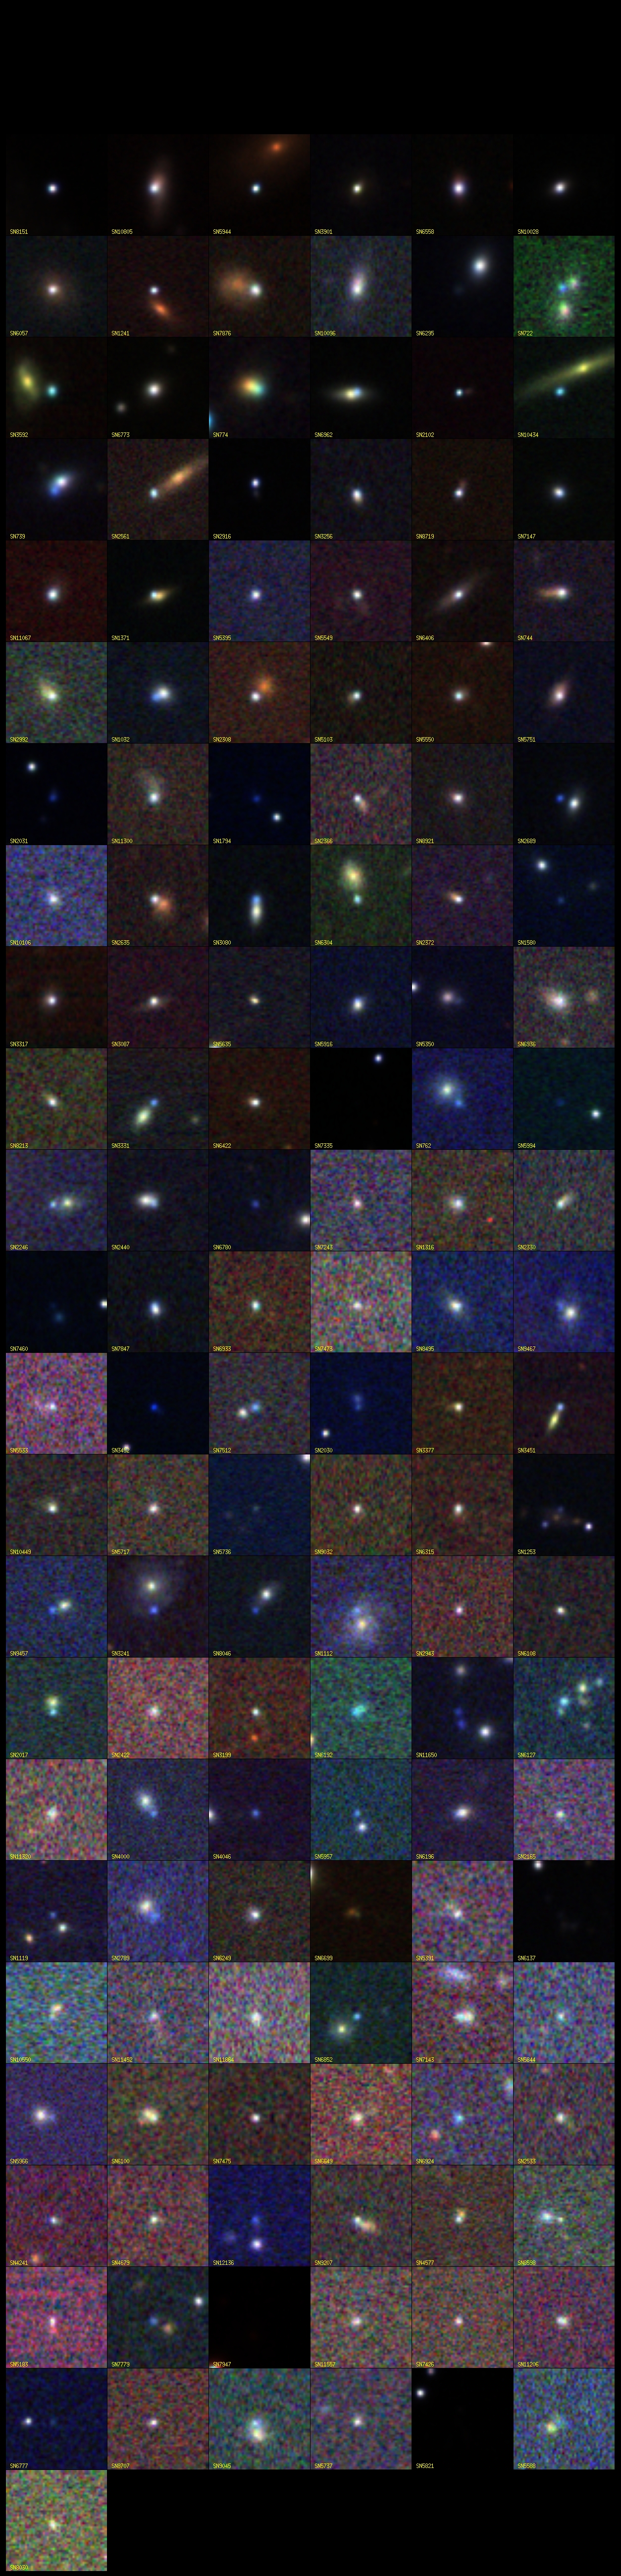
Here's a brief summary:
Note that most of our supernovae fall into a range of "moderate" redshift: between 0.1 < z < 0.4 . That means that our work fills in a gap: there are several other groups which are very good at finding supernovae in the nearest galaxies, in the range 0 < z < 0.10. There are also other groups who are trying hard to find the most distant supernovae, at or beyond redshift z = 1 .
If you look at the supernovae discovered and reported during 2005 alone, the SDSS search provides the bulk of the events in this "moderate" range.
We are still working on the data, and it will be several months before we are ready to apply our measurements to the big questions of cosmology. But it is clear that we can help to add one more piece to this fascinating puzzle.
Copyright © Michael Richmond.
This work is licensed under a Creative Commons License.