How accurate is a single magnitude measurement from an SDSS scan? One can answer that question in several ways. I will look at the repeatability of SDSS magnitudes: the scatter between measurements of the same object on different scans.
As part of another project (searching for planetary transits in SDSS photometry), Waqas Bhatti at JHU gathered a nice, big chunk of data from the SDSS for tests of photometry. He describes the criteria used to pick the data from the SDSS database:
SDSS PSF r mag from 14 to 25 Flags: NOT(SATURATED, BRIGHT, NOTCHECKED, DEBLENDED_AS_MOVING, BAD_MOVING_FIT, MAYBE_CR, MAYBE_EGHOST, BLENDED) and (BINNED1)
(Flag descriptions at: http://cas.sdss.org/runs/en/help/browser/enum.asp?n=PhotoFlags )
The stars fall within a box with rough limits 37.35 < RA < 37.51 and -0.21 < Dec < +0.01 The photometry comes from repeated scans of the celestial equator, some as part of the SDSS Supernova Survey. These scans were made over the past few years, with Julian Dates ranging from 2,451,075 (Sep 18, 1998) to 2,453,641 (Sep 27, 2005).
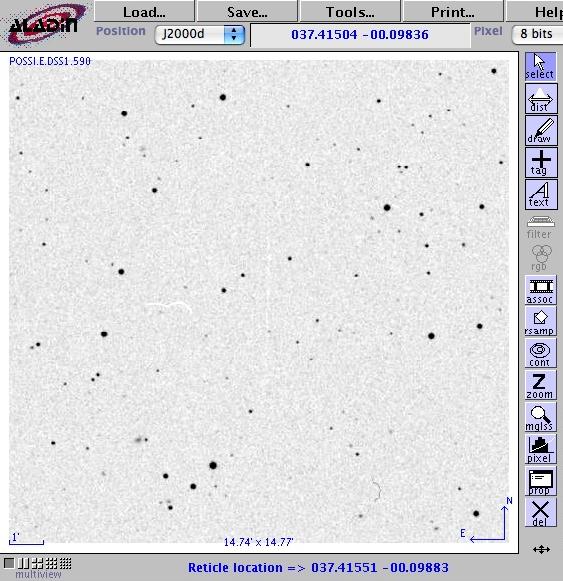
Here's a picture of the field, taken from the POSS-I plates, courtesy of Aladin.

I used my ensemble photometry package (with very minor modifications) to
My primary tool for gauging the quality of a solution was the scatter-versus-magnitude relationship: if the scatter of most of the stars is relatively small, then the solution is good. Since stars at the bright end might be saturated, I looked at them carefully, and marked as "variable" any which showed a scatter larger than expected; these "variable" objects are not used to determine the photometry solution, but do appear in the output.
I will show the results for the g'-band, r'-band and i'-band photometry in a series of graphs below. Each displays scatter from the ensemble mean magnitude on the vertical axis, and the mean ensemble magnitude on the horizontal axis. I show on each graph the level corresponding to a scatter of 0.01 mag = 1 percent. There are black squares showing the estimated RMS for stars, based on theoretical calculations of the telescope and filter throughputs, etc. from Gunn et al., AJ 116, 3040 (1998).
I also show, superimposed on each graph, the values for a few stars in the field of one supernova discovered by the SDSS; Jon Holtz and Masao Sako did detailed photometry of these stars in the field in the same way that they measure supernovae.
I will use only the "fiber" magnitudes (aperture magnitudes, using a synthetic aperture of diameter 3 arcseconds), since earlier tests show that these aperture measurements are more stable from night to night than the PSF-fit magnitudes.
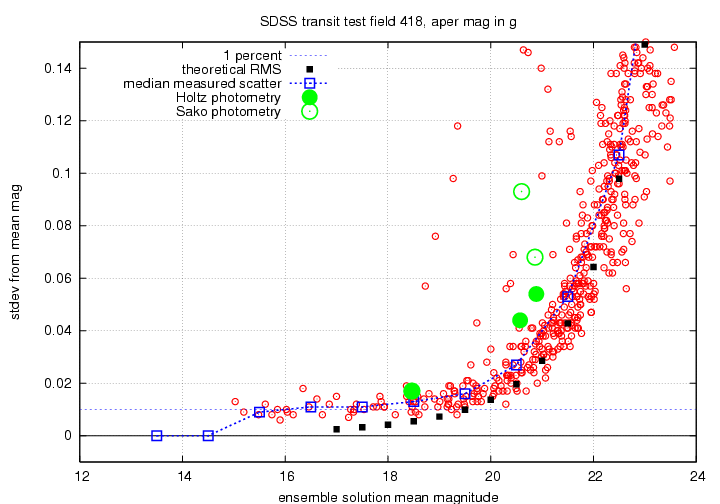
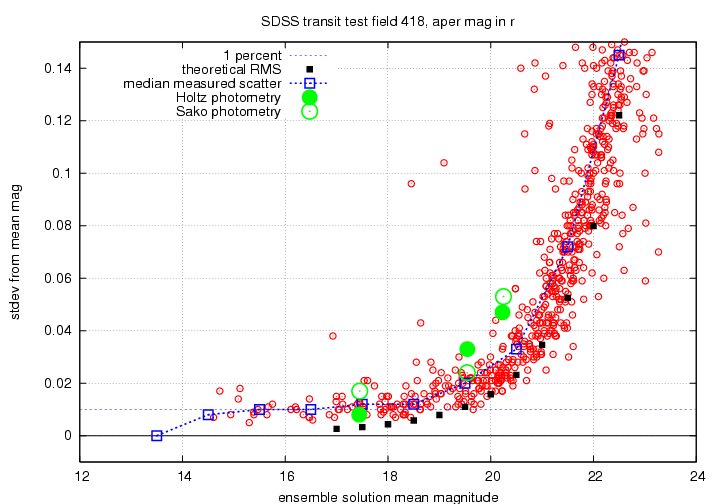
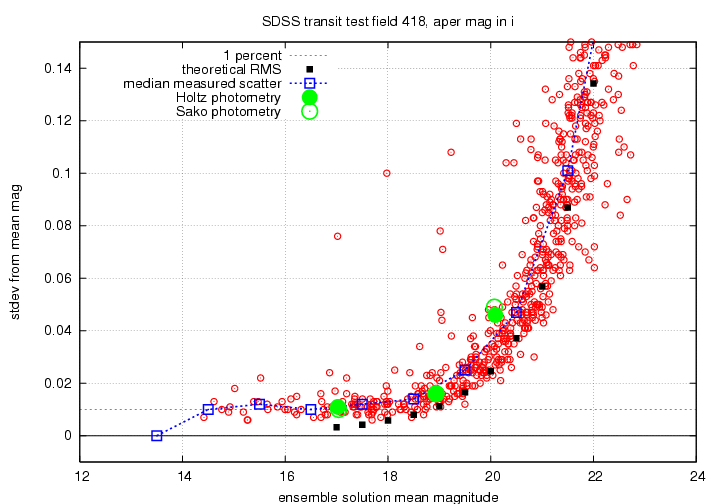
There are several features we can see in a glance:
I believe that the results here provide an estimate for the lower limit of the uncertainty in a single photometric measurement of a star-like object; this limit might be appropriate for the measurement of an isolated supernova. Measurements of objects immersed in complicated backgrounds must have larger uncertainty.
Below are tables showing the median scatter from the mean measurement, within bins one magnitude wide. The second and fourth columns are the min,max limits of the bin, the sixth column is the number of stars in that bin, and the eighth column is the median stdev from the mean within that bin. These values are plotted in blue in the graphs above.
 min 13.000  max 14.000   num      0   median  0.000
 min 14.000  max 15.000   num      0   median  0.000
 min 15.000  max 16.000   num      7   median  0.009
 min 16.000  max 17.000   num      9   median  0.011
 min 17.000  max 18.000   num     12   median  0.011
 min 18.000  max 19.000   num     19   median  0.013
 min 19.000  max 20.000   num     41   median  0.016
 min 20.000  max 21.000   num     69   median  0.027
 min 21.000  max 22.000   num    150   median  0.053
 min 22.000  max 23.000   num    183   median  0.107
 min 23.000  max 24.000   num    234   median  0.239
 min 24.000  max 25.000   num     91   median  0.462
 min 13.000  max 14.000   num      0   median  0.000
 min 14.000  max 15.000   num      3   median  0.008
 min 15.000  max 16.000   num      9   median  0.010
 min 16.000  max 17.000   num     13   median  0.010
 min 17.000  max 18.000   num     25   median  0.012
 min 18.000  max 19.000   num     43   median  0.012
 min 19.000  max 20.000   num     58   median  0.020
 min 20.000  max 21.000   num    111   median  0.033
 min 21.000  max 22.000   num    206   median  0.072
 min 22.000  max 23.000   num    243   median  0.145
 min 23.000  max 24.000   num    105   median  0.268
 min 24.000  max 25.000   num      1   median  0.554
 min 13.000  max 14.000   num      0   median  0.000
 min 14.000  max 15.000   num      5   median  0.010
 min 15.000  max 16.000   num     12   median  0.012
 min 16.000  max 17.000   num     17   median  0.010
 min 17.000  max 18.000   num     51   median  0.012
 min 18.000  max 19.000   num     51   median  0.014
 min 19.000  max 20.000   num     94   median  0.025
 min 20.000  max 21.000   num    147   median  0.047
 min 21.000  max 22.000   num    226   median  0.101
 min 22.000  max 23.000   num    206   median  0.201
 min 23.000  max 24.000   num      7   median  0.404
 min 24.000  max 25.000   num      1   median  0.641
Added Sep 14, 2006
I looked at the sigma-vs-mag plots for my test field and picked 11 of the brightest outliers in each passband. Some stars were outliers in all three passbands, some were outliers only in one. I found that 6 of the 11 were intrinsic variable stars (similar variations in all passbands simultaneously), and 5 of the 11 were spurious: just one or two bad measurements in a single passband.
I checked to see if the stars with single bad points were close to nearby stars, using the Aladin tool to examine DSS plate scans. I found that none of the stars I checked had nearby brighter companions.
What fraction of the stars are outliers? Well, you can look at the graphs, pick a "reasonable" level of outlier-li-ness, and see for yourself. If I look only at the bright stars, I find that about 29 of 307 stars (9%) with g < 22 are outliers, 11 of 262 stars (4%) with r < 21 are outliers, 15 of 376 stars (4%) with i < 21 are outliers.
Other work I've done on repeated measurements of stars, Tests of photometry in test field 94, shows very clearly that PSF-fitting photometry is much less consistent than aperture photometry for bright stars.
On the one hand, Scranton et al. do agree with my assessment: they state that bright objects typically display much more scatter than one would expect based on the photo errors; (section 3.1, paragraph 1). On the other hand, they seem to discount this in their conclusions, stating: the pipeline errors match the observed scatter very well, provided the object is not intrinsically variable (Conclusions, bullet marked ``For Stellar Objects''). For faint stars, this is true; but for bright stars, I disagree. Let me be quantitative: below are plots showing the actual scatter around the mean for repeated measurements (red circles, blue dashed line) and the typical database uncertainties (black squares). I have taken all the uncertainty values from the database within bins 0.5 mag wide and computed the median -- just as I did for the actual scatter in the blue dashed line.
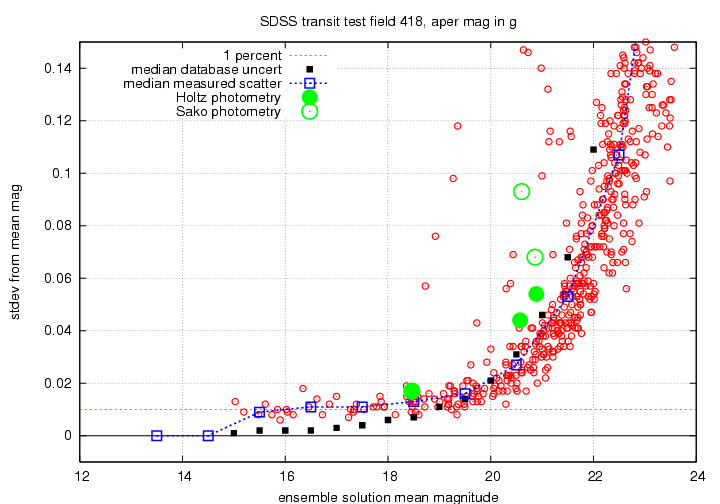
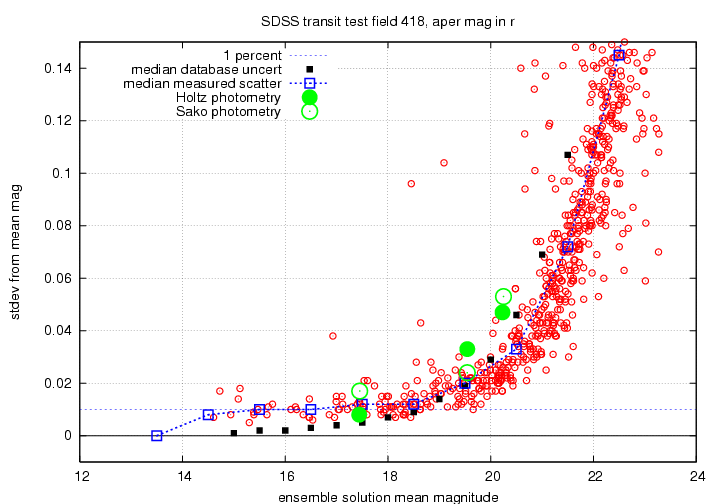
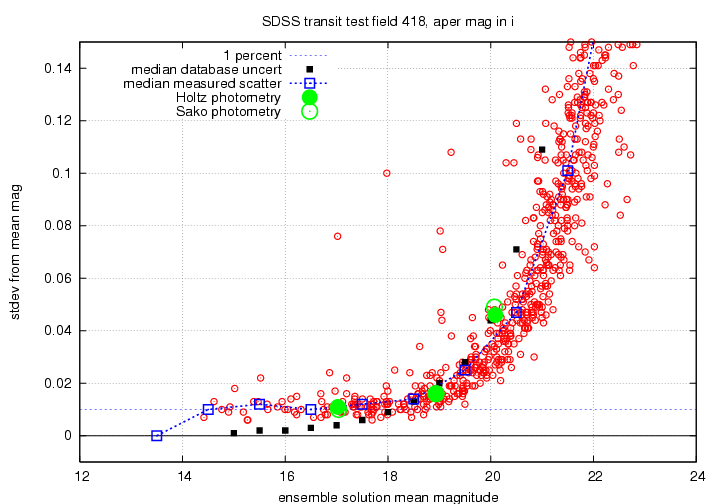
For very bright stars, the database uncertainties are clearly too small; for faint stars, they are decent estimates of the scatter from the mean. The crossover points are roughly
                 g-band           r-band           i-band
               --------------------------------------------
                 g = 19.5         r = 19.0         i = 18.5
               --------------------------------------------
Added Sep 15, 2006
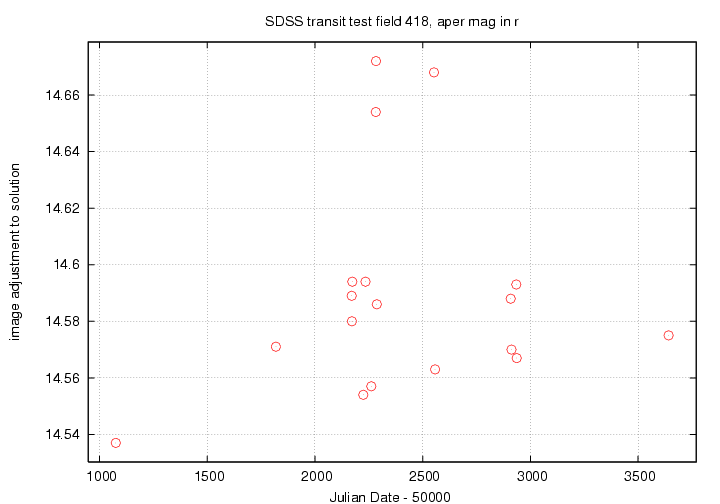
If we discard the data from the nights MJD 52282, 52283 and 52552, and discard all the bright variable objects noted in the ensemble analysis as well, then re-run the ensemble analysis, we find a slightly smaller scatter: shown below are the results in r-band.

The solid black line shows the median scatter within 1-mag wide bins using ALL the data, while the dashed blue line shows the median scatter after removing the bad nights and variable objects. The scatter has indeed decreased, but not by a huge amount. Tables of the new scatter with this "cleaned" dataset are linked below.
Here's a comparison of the "dirty" and "cleaned" tables for r-band.
                                             dirty     cleaned
         min 13.000  max 14.000      median  0.000      0.000
         min 14.000  max 15.000      median  0.008      0.006
         min 15.000  max 16.000      median  0.010      0.007
         min 16.000  max 17.000      median  0.010      0.006
         min 17.000  max 18.000      median  0.012      0.009
         min 18.000  max 19.000      median  0.012      0.011
         min 19.000  max 20.000      median  0.020      0.017
         min 20.000  max 21.000      median  0.033      0.030
         min 21.000  max 22.000      median  0.072      0.065
         min 22.000  max 23.000      median  0.145      0.136
         min 23.000  max 24.000      median  0.268      0.268