 Copyright © Michael Richmond.
This work is licensed under a Creative Commons License.
Table of contents:
On Dec 6, 2005, Derek Breit watched the asteroid (818) Kapteynia briefly cover the star TYC 2436-00333-1. Maps of the event are at Steve Preston's occultation predictions site.
Derek's location for observing this event was near his home in Martinez, CA:
His equipment included
He mailed a videotape of the event to me. I digitized it using equipment at the RIT Center for Imaging Sciences. The best codec I could use produces individual frames of size 720x480 pixels compressed so that they fill 2.1 Mbps.
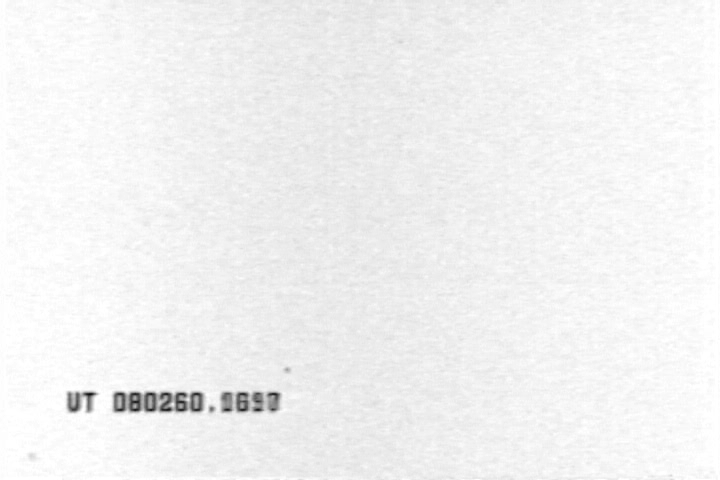
Each video frame has a time stamped on it. Below is an example, frame number 1 in the sequence.

As far as I can tell, each frame in the movie file contains a combination of two fields of video data. By "field", I mean the light striking the camera during a period of about 1/60 of a second. Since two fields are combined in each frame of the video file, the time stamps show a blur in the least significant digits. In the example above, you can see
After looking at several consecutive frames at the very start and very end of the movie file, I decided that
This yields a frame rate of about 29.96 frames per second.
After making a first pass through the analysis of the data, and posting a sample graph of the light curve on the IOTAoccultations Yahoo site, I discovered a problem: when I had broken the movie into individual frames, my computer had dropped many, many of the frames. There were only 431 frames to span 23 seconds, yielding only 18 frames per second. Whoops!I made a second attempt at breaking the movie file into individual frames, this time checking to make sure that no other process was using the CPU. This yielded 690 frames. I checked the procedure by doing it again while giving the decoder some time between frames, and again got 690 frames.
In any case, please disregard the plot mentioned in this initial message.
I processed this movie file in the following manner:
In addition to the target star, there are several other stars visible in the field. It is easier to see them if one adds together a number of frames. Here's an image made from the sum of about 100 frames.
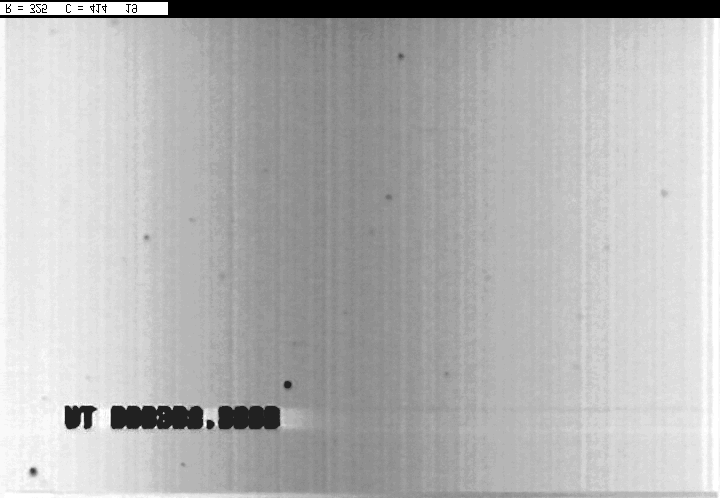
As you can see, the video signal is not particularly clean. There is a clear variation in light level across the frame: the middle has a higher background level, or is more sensitive to light. There are also clear vertical artifacts. Over the course of the 23-second video clip, the stars drift by roughly 10 pixels in both the vertical and horizontal directions. The horizontal motion causes stars to move across the stripes, which will undoubtedly cause slow, gradual variations in the signal of a star.
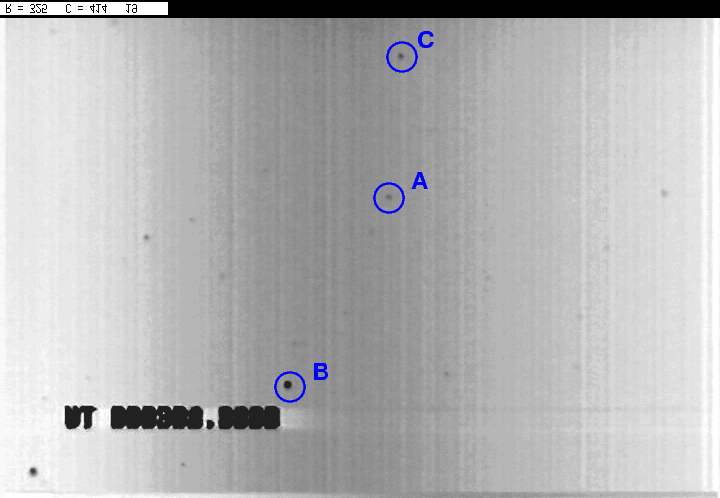
Here's another copy of the co-added image with a few labels to identify stars of interest:
     star          Tycho2 ID          Bt       Vt
----------------------------------------------------
   A  (target)     2436-00333-1      13.4     12.2

   B               2436-00575-1      10.3      9.8

   C               2436-00191-1      12.9     11.7
-----------------------------------------------------
The target star is labelled "A" in the figure above.
I will measure the light from it
the stars marked "B" and "C" in all frames.
The field is rotated by about 68 degrees counter-clockwise from the usual astronomical convention of "North up, East left." Here's a copy of the matching portion of the POSS I plate for this region, rotated to match the movie. I've marked the same three stars.
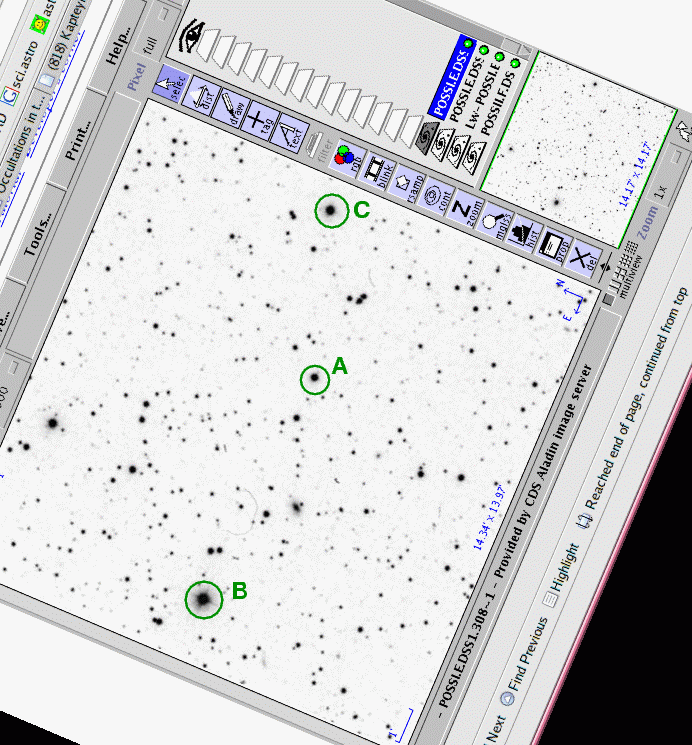
The video images have a scale of 2.00 arcseconds per pixel.
The 8-bit digitized images had a small dynamic range, from 0 to 255 counts per pixel. None of the stars was anywhere close to the top of this range: even the bright star "B" was only about 100 counts per pixel near its peak (including the background of about 20 counts per pixel). The FWHM of star "B" was around 6 pixels.
For each of the 690 frames, I
After looking at the resulting light curves, I decided that a synthetic radius of 4 pixels produced tighter photometry than larger radii. I'll use that aperture size for all the photometry discussed below.
To gauge the precision of the photometry, I calculated the mean flux and standard deviation from the mean for each star over two sections of the record (both of which are outside the occultation).
      star                       mean counts    standard deviation
-------------------------------------------------------------------
frames 1-100
   star A                          187               79
   star B                         1777              163
   star C                          359              100

frames 500-600
   star A                          223               73
   star B                         1833              119
   star C                          394               84
--------------------------------------------------------------------
The precision of the photometry is low, especially for the faint target star. This is not surprising: if one watches the video file as a movie, the target star winks in and out of visibility continually.
In this case, unlike that of Regulus observed with a 50mm camera lens, scintillation is probably not the major source of noise. Using the equation quoted in the source above, scintillation should produce a fractional uncertainty of about 4 percent to the photometry. Instead, I guess that there are simply few photons entering the camera. Let's do a quick calculation to check.
I'll assume that the camera collects photons over an effective bandpass which is twice as wide as the standard Johnson-Cousins V passband. I'll assume that all the stars have spectral types similar to Vega (though that isn't true, as you'll see later). Vega produces about 880,000 photons per second per square centimeter of collecting area above the atmosphere through the V passband. I'll double that, to 1,760,000 photons per second per square centimeter of collecting area above the atmosphere, and call that the flux for a star of magnitude Vt = 0 (again, ignoring the niceties in this quick calculation). Then a star of magnitude Vt = 12.2 will produce a flux of about 23.2 photons per second per square centimeter of collecting area. In this case, we have
Putting it all together, I estimate roughly
                       23.2 photons
 flux from target  =  --------------- * (650 sq.cm.) * (0.033 sec) * (0.78)
                      (sec * sq.cm.)


                   =   388 photons per frame entering camera
If the camera detects even half of these photons -- which I suspect would be an overestimate -- then each frame might involve 194 photons. Let's ignore light from the background sky, the electronics, etc., and just look at the random photon noise in the signal itself. This has a size of roughly sqrt(1/194) = 0.07 = 7 percent.
Hmmm. This is only a small portion of the actual, roughly 37 percent, variation in the signal from star "A" in our measurements. I guess that the background light, electronics, and other complications do contribute a lot of the noise.
Updated 1/4/2006: I've replaced earlier versions of most of the graphs in this section with new ones, generated from photometry which is not truncated at a flux level of zero.
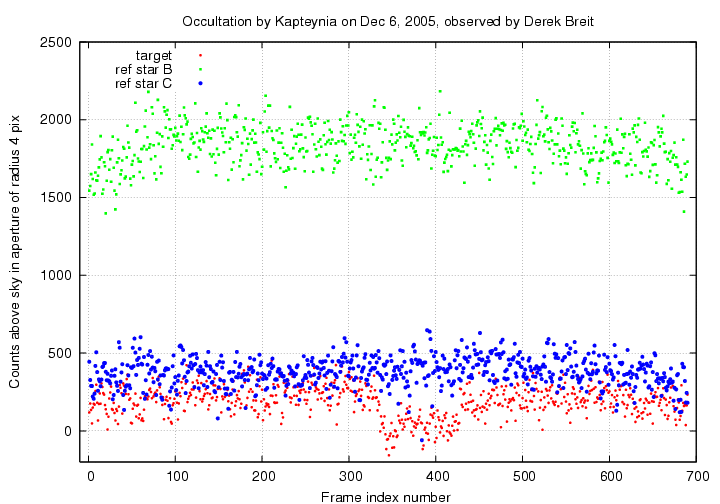
Here are quick views of the results.
The entire light curve:
In order to give you an idea for the size of the random variations in the measurement of light from a truly "empty" region of the frame, I placed a square box of size 7x7 pixels slightly below the target star A in each image. I added up the value of all pixels within this box, which has roughly the same area as a circular aperture of radius 4 pixels, and then subtracted the same local sky value used for the target star A. Below is a graph showing those measurements, shifted slightly for clarity, and the measurements of star A.
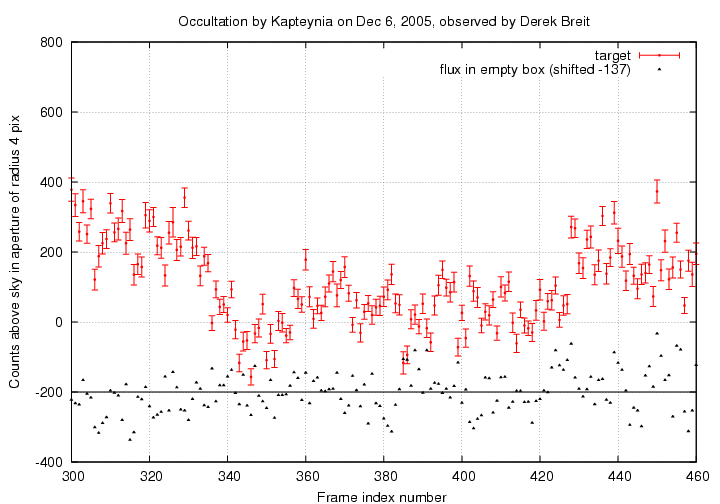
You can see that the summed flux in the "empty" region bounces up and down with an amplitude of about 50-100 counts. The fluctuations in the target star's aperture do seem to be a bit more positive than those in the "empty" region, but I suspect the stripey background may cause correlations in these fluctuations which vary from place to place on the frame.
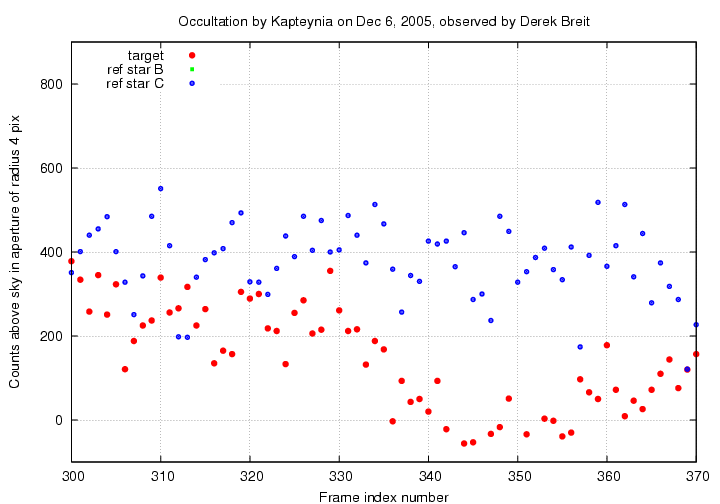
Okay, back to the light curve of the real stars. A closeup around the dis-appearance:
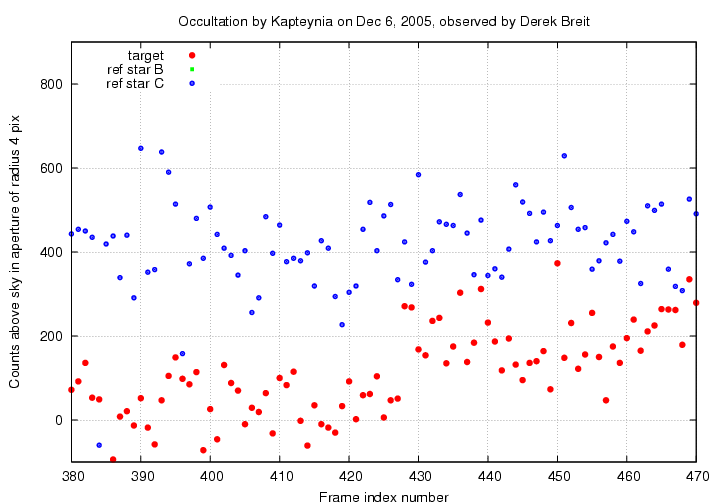
A closeup around the re-appearance:
There is clearly a lot of random noise in the measurements of the target star. Perhaps it will help to smooth the data somewhat. Below, I show a "5-item boxcar average" of the target star's photometry; that means that the number for frame N is the average of the values for frames (N-2), (N-1), N, (N+1), (N+2).

This plot still shows the older photometry
which truncates at zero. Sorry.
Another view which may help to show the occultation is shown below: I use instrumental magnitudes instead of linear units for flux.

You can grab the data in a multi-column ASCII text file below. The columns are
 col              quantity
------------------------------
  1              frame index

  2,3            flux of target star "A" in 4-pixel-radius aperture,
                     and estimate of uncertainty in that flux
  4,5            ditto 5-pixel aperture
  6,7            ditto 6-pixel aperture
  8,9            ditto 7-pixel aperture
  10,11          ditto 8-pixel aperture


  12,13          flux of star B in 4-pixel aperture,
                     and estimate of uncertainty in that flux
  14,15          ditto 5-pixel aperture
  16,17          ditto 6-pixel aperture
  18,19          ditto 7-pixel aperture
  20,21          ditto 8-pixel aperture


  22,23          flux of star C in 4-pixel aperture,
                     and estimate of uncertainty in that flux
  24,25          ditto 5-pixel aperture
  26,27          ditto 6-pixel aperture
  28,29          ditto 7-pixel aperture
  30,31          ditto 8-pixel aperture
What can we learn from this event? There are two main possibilities:
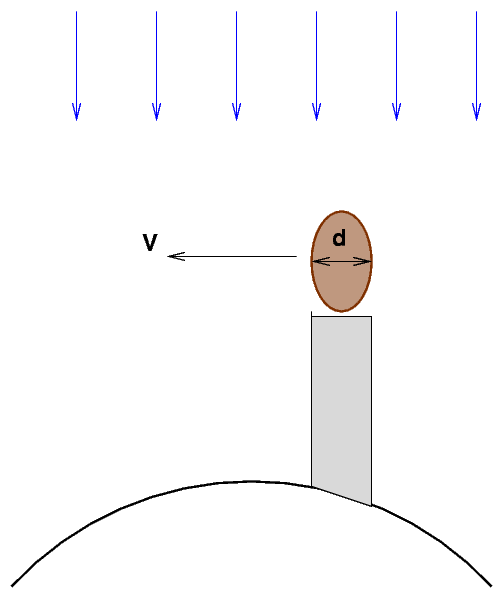
On the ground, an observer measures T, the duration of the occultation. That is related to the transverse component V of the asteroid's velocity relative to the Earth, and the projected diameter d of a chord through the asteroid, like so:
                d
        T  =  ------
                V
So, if we know V and measure T, we can compute the projected diameter of this particular chord of the asteroid:
d = T * V
How long is the occultation? I'll pick the times at which the light from star A appeared to drop far below its ordinary level. Although it's hard to be precise, I will choose
The duration of the occultation is thus (427 - 336) = 91 +/- 3 frames. At a frame rate of 29.96 frames per second, this is T = 3.04 +/- 0.10 seconds.
One can compute the absolute time of the start and end of the occultation by using the time for frame 1, which I estimate to be 08:03:00.065, and the adding the number of frames to an event times the frame rate, which was 29.96 frames per second. Or, if you wish, you can try to decipher the time stamps on each of the frames in question. Here they are: first, the stamps on frames 335, 336, and 337:
![]()
![]()
![]()
And now the stamps for frames 426, 427, 428:
![]()
![]()
![]()
How can we figure out the transverse component of the asteroid's motion relative to the Earth? We can skip all the tough calculations by going to the JPL Horizons ephemeris system and letting it do the work. We find that on UT Dec 6, 2005,
The apparent transverse component of the velocity of Kapteynia relative to the target star would then be
    V  =  L * w

       =  (3.183E11 m) * (3.85E-8 radians/s)

       =  12264 m/s
And we can now compute the projected length of this chord of Kapteynia:
        d  =   T * V

           =   (3.04 +/- 0.10 s)  *  (12264 m/s)

           =   37282  +/-  1226 m

           =   37.3   +/-  1.2  km
How does this compare to values of this asteroid's size derived elsewhere? The IRAS infrared space telescope observed a number of asteroids in the mid-IR, where their light is dominated by thermal emission. Astronomers compared the IR measurements with visual ones (dominated by reflected sunlight) to get very rough ideas for the size of many asteroids. A paper describing this work is The Supplemental IRAS Minor Planet Survey , in Astronomical Journal, 123, 1056 (2002). You can find a table of the results at http://www.psi.edu/pds/archive/simps.html
For Kapteynia, the SIMPS estimates a diameter of d = 49.45 +/- 3.9 km . That is a bit bigger than the chord observed by Breit during this event. No inconsistency here.
Now, the other item we can try to learn from this event is the apparent angular size of the star TYC 2436-00333-1. How do we do that? Read the final section of my report on another occultation for all the details. I'll be brief here, since it will turn out that we don't learn anything about the star.
The parameter b describes the spacing between diffraction fringes projected onto the Earth's surface (if it is perpendicular to the line of sight of the occultation). This parameter is
b = sqrt ( L * lambda )
where
With these choices, we find the fringe spacing would be roughly b = 418 m if the surface of the Earth were perpendicular to the line of sight to the star and asteroid.
Recall that the linear speed of the shadow across the Earth's surface (if it were perpendicular to the line of sight) would be about V = 12264 m/s. We would therefore predict that a characteristic time for the oscillations in the flux level due to the passing of fringes across the detector would be
             b
   t   =   -----
             V


              418 m
       =  -----------
            12264 m/s


       =   0.034 sec
Note that this is very roughly 1/30 of a second, about the duration of a single video frame. In other words, we ought to expect that any oscillations in the flux level due to diffraction effects would be too rapid to appear in a video record.
But ... what if the target star were not a perfect point source of light, but an extended disk? That might complicate things. What do we know about the apparent size of TYC 2436-00333-1? Very little. There were no direct measurements I could find; that's no surprise, for such a faint and anonymous star.
The Tycho color (Bt - Vt) = 1.2 for this star suggests that it is of late spectral type, of mid-K or so. It could be either a main-sequence ("dwarf") star, or an evolved giant star. Let's consider each case.
Is the apparent angular size large enough to detect? It would have to be at least the size of a single fringe to have much of an effect; let's see how the projected angular size of the star compares to that of a single diffraction fringe. Given the distance between the asteroid and Earth, the angular size of a main-sequence star would correspond to a linear size on the ground of about 145 m. Recall that the fringe spacing is about 420 meters, and thus much larger than the projected size of the disk.
Take a look at the portion of my diffraction document which deals with resolved disks. In the graph which appears just under the words, Again, the setup is a wide optical passband and the Moon at its average distance (reproduced below), the effect of resolved disks of several sizes on the diffraction fringes is shown.
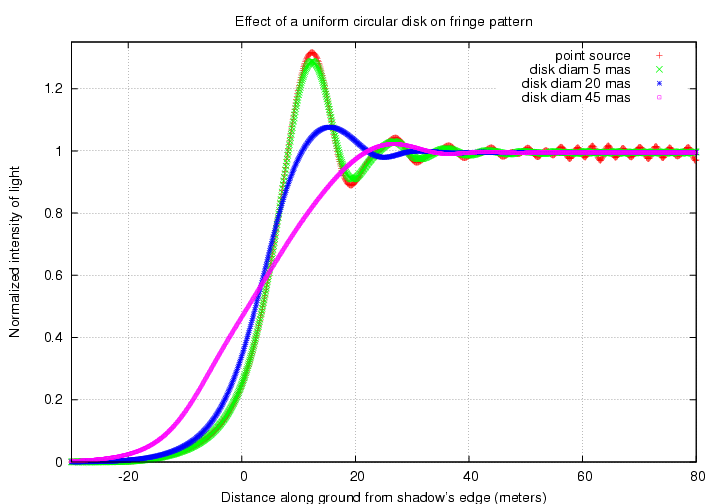
In this figure, the red crosses represent an unperturbed diffraction fringe pattern. The green crosses show the effect on that pattern of a uniform disk, the projected size of which is about 2/3 of the fringe spacing. The result is very close to the original fringe pattern. In our case, the projected disk of TYC 2436-00333-1 is even smaller relative to the fringe spacing: a bit less than 1/2 of the fringe spacing. It seems clear to me that in this particular event, the star will be indisinguishable from a point source; we can learn nothing about it from the observations.
 Copyright © Michael Richmond.
This work is licensed under a Creative Commons License.