 Copyright © Michael Richmond.
This work is licensed under a Creative Commons License.
Copyright © Michael Richmond.
This work is licensed under a Creative Commons License.
Four methods of predicting a baseball team's final record
Michael Richmond
July 8, 2007
Can we predict the final record of a team based upon its performance
at some intermediate point in the season?
Sure -- but we might not be right.
In this brief document, I compare four methods for
making predictions.
I use historical records from the American League,
1961 - 2007, excluding the strike-shortened
years of 1972, 1981, 1994, 1995.
For background information and a detailed description
of some of the models, see
The four methods I'll consider are
- naive extrapolation
-
Take the current winning percentage and multiply by
162 games.
Example: after 50 games into the season,
the 2006 Boston Red Sox had a record of
30 wins and 20 losses, for a winning percentage
of 0.600. This method predicts
naive extrapolation 162 * (0.600) = 97 wins
- linear model to current winning percentage
-
Use historical records to derive a linear relationship
between current winning percentage and final winning percentage;
apply that linear model.
Example:
as shown in this report,
after 50 games, the best-fit model is
  final winning percentage  =  0.207  +  0.599 * (current win percentage)

                            =  0.207  +  0.599 * (0.600)

                            =  0.566

         model to winning perc      162 * (0.566)  =  92  wins
- linear model to current Pythagorean percentage
-
Use historical records to derive a linear relationship
between current Pythagorean percentage and final Pythagorean percentage;
apply that linear model.
After 50 games, the 2006 Red Sox had scored 276 runs and
allowed 244 runs, for a Pythogorean percentage of
0.561.
Using historical team records, a model connecting
the current Pythagorean percentage to final Pythagorean percentage is
  final Pythag percentage   =  0.187  +  0.624 * (current Pyth percentage)

                            =  0.187  +  0.624 * (0.561)

                            =  0.537

         model to Pythag perc      162 * (0.537)  =  87  wins
- linear model to runs, then apply Pythagorean theorem
-
Use historical records to derive linear relationships
between current runs scored and final runs scored,
and between current runs allowed and final runs allowed;
in other words, predict the final runs scored and allowed.
Then apply the Pythagorean theorem with those predictions.
After 50 games, the 2006 Red Sox had scored 276 runs and
allowed 244 runs;
as shown in this report,
we can first predict that the team would score
846 runs and allow 769 runs.
Then we can compute a final winning percentage:
  final winning percentage  =  (846*846) /  (846*846 + 769*769)

                            =  0.548

    model to runs, apply Pyth      162 * (0.548)  =  89  wins
What I did to compare these methods was
- look at the records and runs scored and allowed
for each team during the study period,
after 1 game, 2 games, 3 games, ..., 162 games
into each season
- use each method to predict the number of wins
after 1 game, 2 games, 3 games, ..., 162 games
- compare each prediction with the teams actual number of wins
- compute the error in each prediction
using all teams and all seasons,
after 1 game, 2 games, 3 games, ..., 162 games
- calculate mean and stdev of these errors
The results can be shown in a single graph.
On the x-axis is the number of games played into the season,
and on the y-axis is the standard deviation of the
difference between predicted and actual number of wins at the
end of the season.
The smaller the standard deviation, the better the prediction.
Take just a quick glance at this figure -- the one you'll
want to study closely is the next one.
All this does is show how poorly "naive extrapolation"
does at early times.
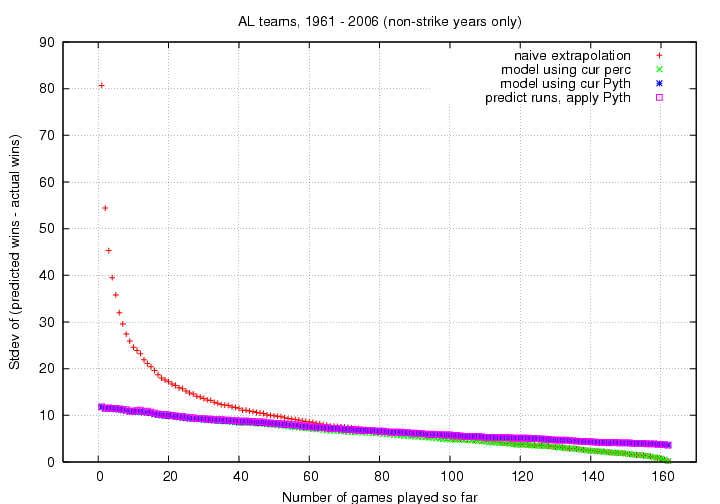
Pay attention to the graph below, which just zooms in on the
interesting region.
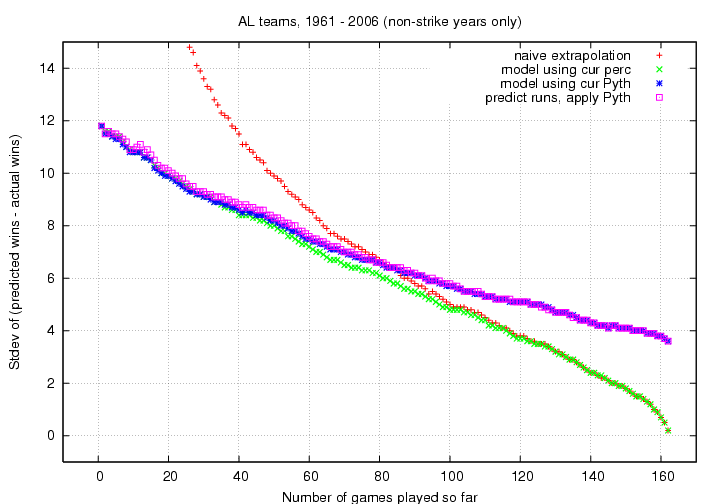
The results are easy to summarize, to a fair degree:
- Before the All-Star Break, naive extrapolation
of a team's current record is worse than
more sophisticated methods
- after the All-Star Break,
naive extrapolation is about as good
as more sophisticated methods
- a model which starts with a team's current record
is as good as or better
a model with starts with runs scored or allowed
- simply Pythagorean methods yield
a standard deviation of around 4 wins,
even at the very end of a season
Copyright © Michael Richmond.
This work is licensed under a Creative Commons License.