 Copyright © Michael Richmond.
This work is licensed under a Creative Commons License.
Can we predict the final record of a team based upon its performance at some intermediate point in the season? Of course we CAN ... but the result might not be very accurate. Let's look at some of the issues involved in predicting the final record. As an example, I'll use the 2007 Boston Red Sox, which had a record of 23 wins and 10 losses after the first N=33 games.
The simplest method is to extrapolate using the current winning percentage. So, for example, the 2007 Red Sox had a winning percentage of 23/33 = 0.697 (yes, this is really the winning fraction, not percentage -- get over it). Projecting this forward to N=162 games, we might predict
  final winning percentage  =  current winning percentage

                            =  0.697


  final number of wins  W   =  0.697 * 162 games

                            =  113 wins
However, this simple extrapolation does a poor job of predicting the actual performance, especially when it is still early in the season. Why? Because there are many, many factors which affect a team: injuries remove key players, trades and callups add new players, long road trips wear people down, and so forth. One consequence is that a team's performance during ANY small sample of games -- not just those at the start of a season -- varies quite a bit from its average performance.
The result is that, if one looks at small samples, one sees large variations: some teams might win all 10 games during a stretch in June, while others might lose 8 of the 10. That does NOT mean, however, that the first team will have a record of 162-0 and the second team a record of 32-130. Instead, we expect the really hot teams to cool off over longer periods, and the really cold teams to do better. Statisticians call this tendency for many random factors to smooth out short-term variations regression to the mean.
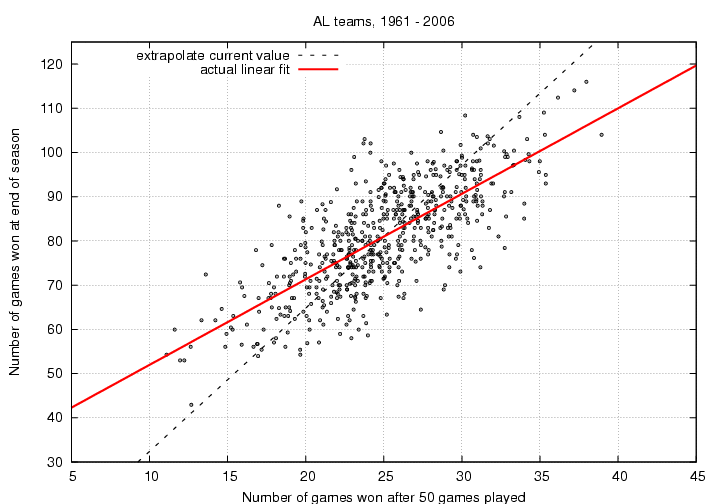
Let me provide an example. Suppose we look at the record of many teams after N=50 games have been played -- that's a bit less than one-third of the full season. I'll compare the number of wins at this point to the number of games they won by the end of their season.

The dashed black line shows the relationship we would expect to see if each team continued to play at the same level all season long. As you can see, it does a poor job of predicting the performance of teams, especially those at each end of the pack. The best teams after 50 games were unable to maintain their excellent play for the entire season: their points lie below the dashed line. The worst teams after 50 games, on the other hand, improved as the season continued (with the exception of the 2003 Detroit Tigers), so their points line above the dashed line.
Of course, the longer we wait, the better this simple extrapolation becomes. Let's look at the predictions after N=100 games have been played.
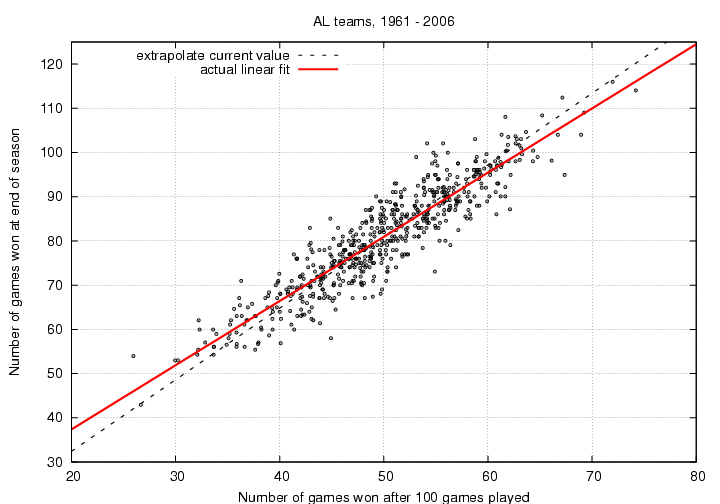
Once again, the dashed black line shows the simple extrapolation from the current record. As you can see, it now does a better job of matching the actual final record. There is still a slight trend for the extrapolation to overestimate the performance of the best teams, and underestimate the performance of the worst, but the differences are smaller now.
This suggests a better way to predict the performance of a team: look at the historical records for many baseball teams, find a relationship between the record after N games, and the record at the end of the season, and use THAT relationship to project the team's future.
Mathematically, we can make a linear fit of the team's current winning percentage to predict its final winning percentage. In other words,
final winning percentage = A + B * (current winning percentage)
In a diagrams above, this best-fitting linear relationship is shown as a red line. I used the records for American League teams during the period 1961-2006 to compute the linear relationships between current winning percentage and final winning percentage after N=1, N=2, N=3, ..., N=161 games. The results can be shown in a compact manner in the following graph:
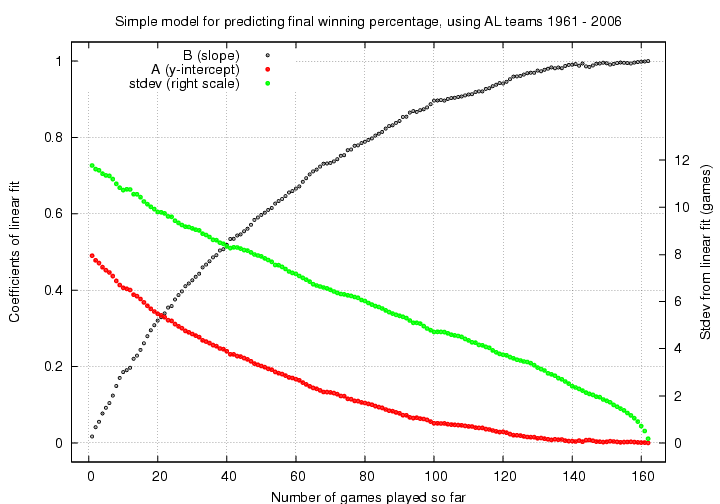
It's a bit confusing, so let me walk through one example. Again, I'll pick the 2007 Red Sox. After N=33 games, they had a record of 23-10, and a winning percentage of 0.697. So, to predict their final record, I look at this graph near the position N=33 games played so far.
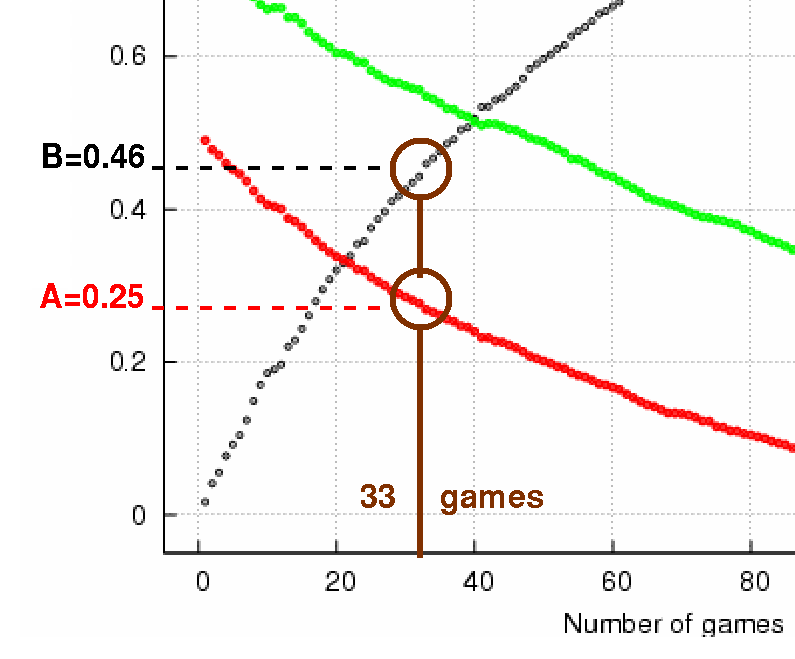
I read in red a value of A = 0.25, and in black a value of B = 0.46. I can now predict the final winning percentage of the 2007 Red Sox ...
  final winning percentage  =   A     +   B   * (current winning percentage)

                            =  0.25   +  0.46 * (0.697)

                            =  0.570
... and therefore the number of wins they will have at the end of the season:
  final number of wins  W   =  0.570 * 162 games

                            =   92 wins
Now, just how good is my prediction? Well, it's hard to say, since in real life, all sorts of unpredictable events might occur. One estimate of the precision of this prediction is given by one particular mathematical property of the linear fit. The scatter from the linear fit corresponds to the degree to which my prediction agrees with the final records. In graphical terms, the scatter corresponds to the vertical spread of points above and below the linear fit. For example, the linear fit to records after N=50 games

has a scatter (formally speaking, one standard deviation) of +/- 0.055 in winning percentage. That corresponds to a scatter of about 9 games. If we draw a pair of lines on this diagram, parallel to the best linear fit, we will find that about two-thirds of all the points lie between the lines.
You can determine the scatter from the linear prediction by looking at the green dots in the prediction graph: look at the scale on the right-hand side to read the standard deviation of the actual records from the prediction.
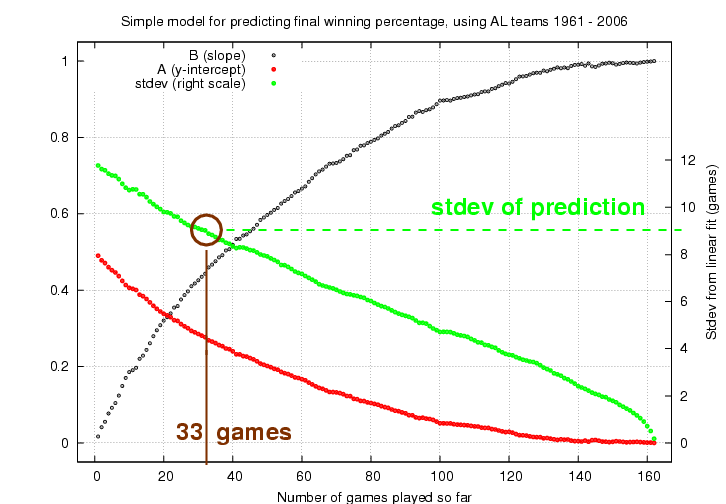
So, we could predict that the 2007 Red Sox will win 92 games; but a better statement to make would be "the 2007 Red Sox will win between 83 and 101 games." If we were speaking to a statistician, we might add "at a 67 percent confidence level."
Reading numbers from a graph can be difficult. If you'd like to make more accurate predictions, feel free to read numbers from a big text file. The graph above is based on some calculations which are stored in an ASCII text file with format like this:
1 4.901898e-01 1.689044e-02 syx = 0.072664 bconf = 1.1687e-02 r = 0.115636where the columns of numbers are
 Copyright © Michael Richmond.
This work is licensed under a Creative Commons License.