 Copyright © Michael Richmond.
This work is licensed under a Creative Commons License.
How well can we use a team's performance through part of a season to predict its final statistics? Earlier, I investigated how well we can predict final winning percentage. Today, I'll look at two other measures of a team's performance: runs scored and runs allowed.
As before, I'll restrict the analysis to American League teams which played a full season of 162 games. That means the years from 1961 to 2006, discarding the strike-shortened 1972, 1981, 1994 and 1995 seasons.
Suppose that we beging with the simple assumption that a team will continue to score runs (or allow them) at the same rate it has done so far; in other words, we simply extrapolate from a team's current statistics to a full season of 162 games. So, for example, if a team has played 50 games and scored 250 runs, we would predict
                                          162 games
     final runs scored  =  (250 runs) * (----------)
                                           50 games

                        =  (250 runs) *    3.24


                        =   810 runs
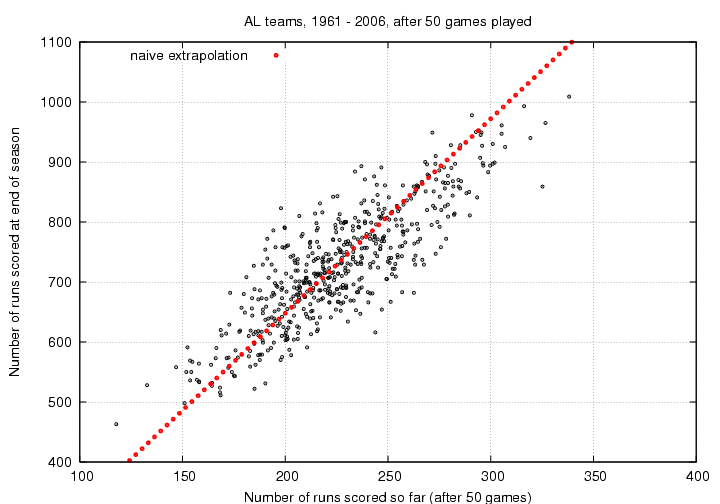
While this method does produce a reasonable guess, it suffers from a systematic error: it over-predicts the performance of high-scoring teams, and under-predicts the performance of low-scoring teams. In other words, it fails to account for the almost universal regression to the mean. You can find a more detailed description of this error in the winning percentage document , but the error is easy to recognize. In a graph comparing the REAL final number of runs scored to the naive prediction after 50 games,

we see that the best teams fall under the naive prediction, while the worst teams fall above it. If we allow more time to pass, then our prediction does improve:
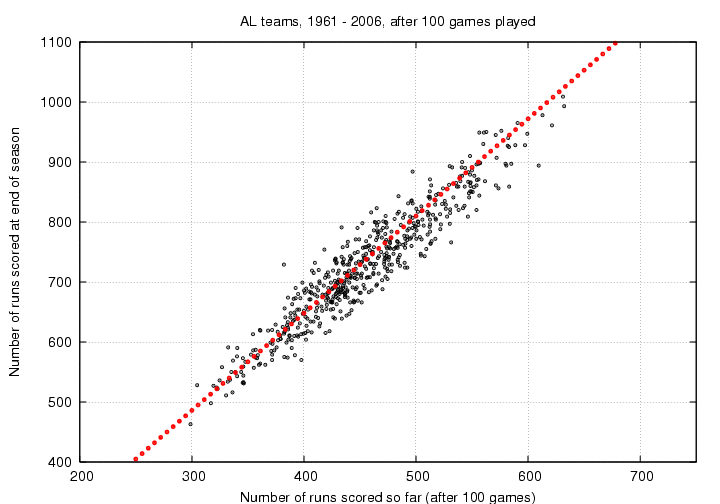
Hmmmm. Looking at this graph, it appears that the worst teams at scoring don't improve much: the simple extrapolation does a good job of predicting their final performance. The best teams, on the other hand, do appear to fall back a bit by the end of the season. One might perform a more sophisticated statistical analysis to see if this impression holds up ....
Better than simple extrapolation is to look at the actual ratio of current runs scored to final runs scored, over a period of many years, and make a model which matches the data. I settled on a linear model like this:
final runs scored = A + B * (runs scored so far)
After 50 games have been played, for example, the historical data yields
final runs scored = 194 + 2.362 * (runs scored so far)
which is indeed a better fit than the naive extrapolation.
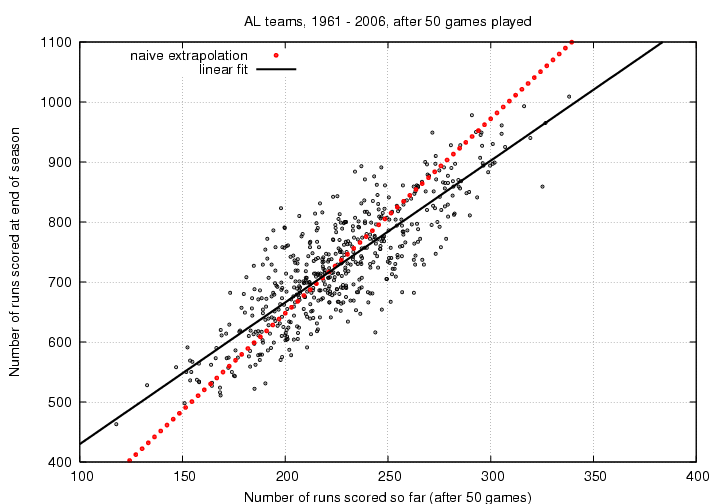
If we set aside the systematic error for a moment, we see that there is still a large scatter around this extrapolation. Two teams which both scored 500 runs after 100 games do not typically end up with the same number of runs scored at the end of the season. We can quantify this lack of precision by the standard deviation from some model. For example, using my linear fit described above to teams which have played 50 games, I find a standard deviation of 52 runs. That means that about two-thirds of the teams will end up with a final number of runs scored at the end of the season which is within +/- 52 runs of the prediction after 50 games.
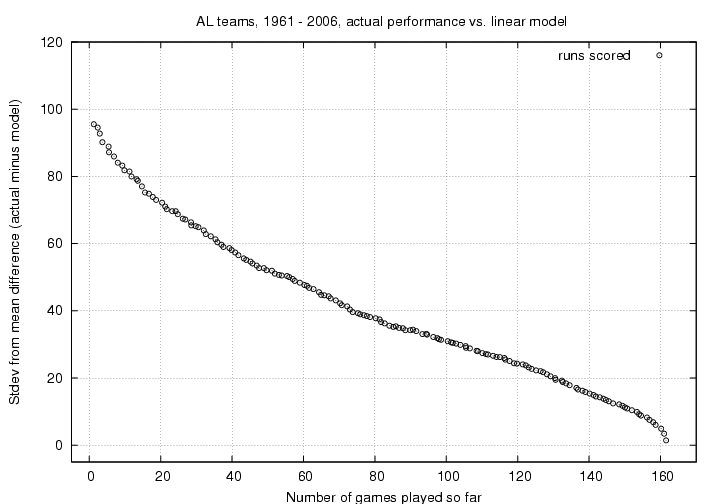
Of course, the longer we wait throughout the season, the better any prediction will become. Below is a graph showing the standard deviation to a linear fit; note how it steadily shrinks as the season progresses.
Now, we can do exactly the same sort of analysis for runs allowed (rather than scored) by a team. The results are very, very similar, so I'll skip the details. In the end, our ability to predict the number of runs allowed by some particular team is -- to my eyes -- just as good, or bad, as our ability to predict the number of runs scored. Compare for yourself:
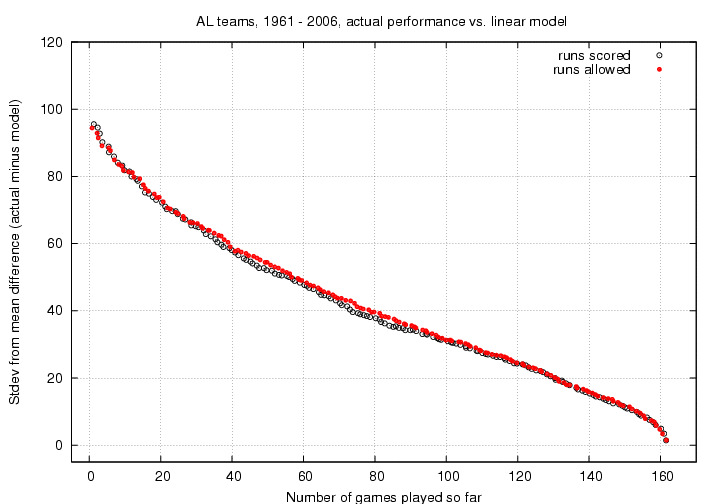
You can find the results of my linear models applied to the historical data at the links below. Each file has lines that look something like this:
1 7.063273e+02 5.034960e+00 syx = 95.524000 bconf = 2.7217e+00 r = 0.154445
where the columns of numbers are
Let me work through one example. The 2007 Boston Red Sox, as of today, have played 86 games. They have scored 430 runs and allowed 340 runs. Using my linear models, I find
  final runs scored   =  87.56  +  1.634*(430 runs)

                      =   790  runs   +/-   35 runs

  final runs allowed  =  92.70  +  1.631*(340 runs)

                      =   647  runs   +/-   37 runs
 Copyright © Michael Richmond.
This work is licensed under a Creative Commons License.