 Copyright © Michael Richmond.
This work is licensed under a Creative Commons License.
Copyright © Michael Richmond.
This work is licensed under a Creative Commons License.
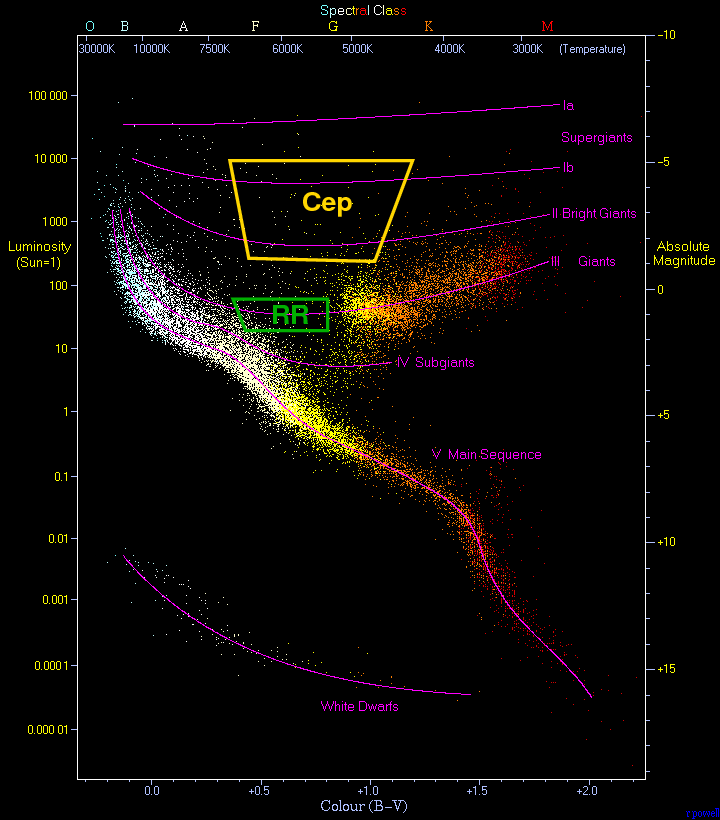
Today, we'll look at two types of pulsing stars: RR Lyrae stars, and Cepheid stars. Both can be used to help astronomers estimate the distance to other galaxies.
RR Lyrae stars have evolved off the main sequence. They lie in a region of the HR diagram which has roughly yellow color, in a sort of gap between the main sequence and red giant branch.
Background image of HR diagram courtesy of
www.anzwers.org
Finding RR Lyrae isn't all that difficult. Since the periods of these stars is typically 10 to 15 hours, a series of images over the course of one long night will show them changing in brightness quite clearly.
Image courtesy of
Joel Hartman and Kristoff Stanek
See also the
2007 Apr 15 Astronomy Picture of the Day.
The light curves of these stars usually show a pattern of "sharp rise, gradual decline," although there are some variations in shape.
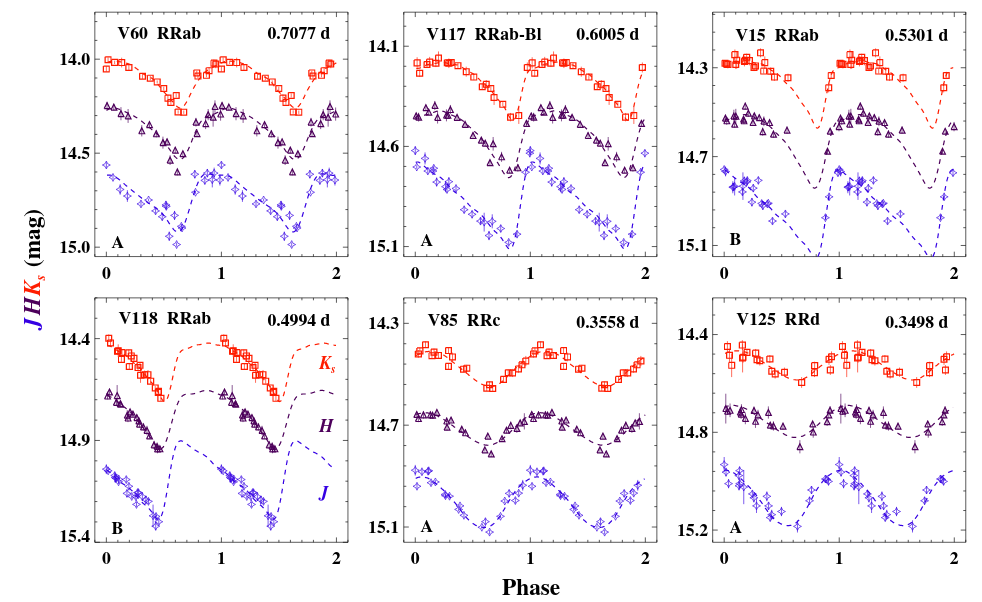
Figure 4 taken from
Bhardwaj et al., AJ 160, 220 (2020)
Let's look at one particular group of stars: the globular cluster M3. That's the cluster shown in this animation.
Image courtesy of
Joel Hartman and Kristoff Stanek
See also the
2007 Apr 15 Astronomy Picture of the Day.
We can treat all the stars in this cluster as sitting at the same distance from the Earth. Suppose we make a color-magnitude diagram, which shows the color of each star on the horizontal axis (blue on the left, red on the right) and the apparent magnitude on the vertical axis (bright at top, faint at bottom). The diagram below shows magnitudes measured through the near-infrared K filter. The main sequence originally ran diagonally from lower right to middle left, when the cluster was young, but all the hot, luminous stars have run out of fuel and left the main sequence. The RR Lyrae stars are identified by colored symbols.
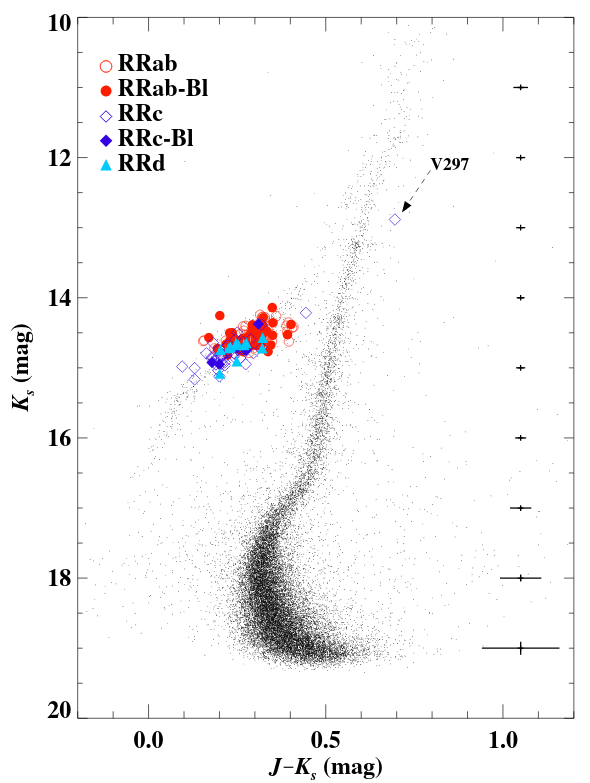
Figure 3 taken from
Bhardwaj et al., AJ 160, 220 (2020)
  Q:  Do the RR Lyrae stars cover a wide range of apparent magnitudes,
            or do they all have roughly the same apparent magnitude?


  Q:  What does that imply about the range of ABSOLUTE magnitudes
            for these RR Lyrae stars?
Right. To a decent approximation, all RR Lyrae stars have the same absolute magnitude. That means that once we know the value of that absolute magnitude, we can compute the distance to each star. Remember this formula?
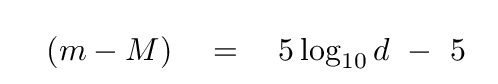
Here,
Now, if you want to achieve the highest possible accuracy, you have to do a little more work. If one looks closely at the RR Lyr stars in this cluster, and plots the apparent magnitude of each one as a function of its period, one finds that there is a slight trend:
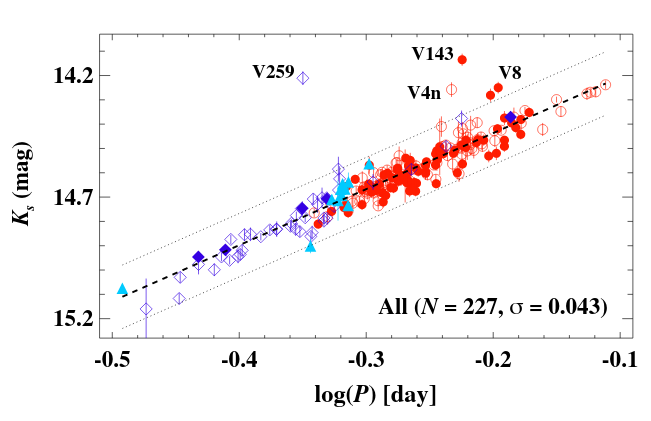
Figure 10 (slightly modified) taken from
Bhardwaj et al., AJ 160, 220 (2020)
The stars with longer periods are a bit brighter; that agrees with our analysis from the previous lecture, which showed that there is likely to be a connection between the period of a pulsing star and its luminosity. However, one can still achieve decent results by using the average apparent magnitude of all the RR Lyrae stars in a cluster, and comparing that to some average of the absolute magnitude in the corresponding filter.
  Q:  What is the average apparent magnitude in the K filter for
              RR Lyrae stars in the cluster M3?


  Q:  The absolute magnitude of RR Lyrae stars in the K filter is approximately
              MK = -0.35

              What is the distance to the cluster M3?
Okay, now that we understand how to use RR Lyrae stars to determine distances, let's put them to work. Our target will be the Draco dwarf spheroidal galaxy, which is one of the small satellite galaxies that orbit our own Milky Way Galaxy.
Here's a picture of the region of the sky around the Draco dwarf galaxy. Can you spot it?
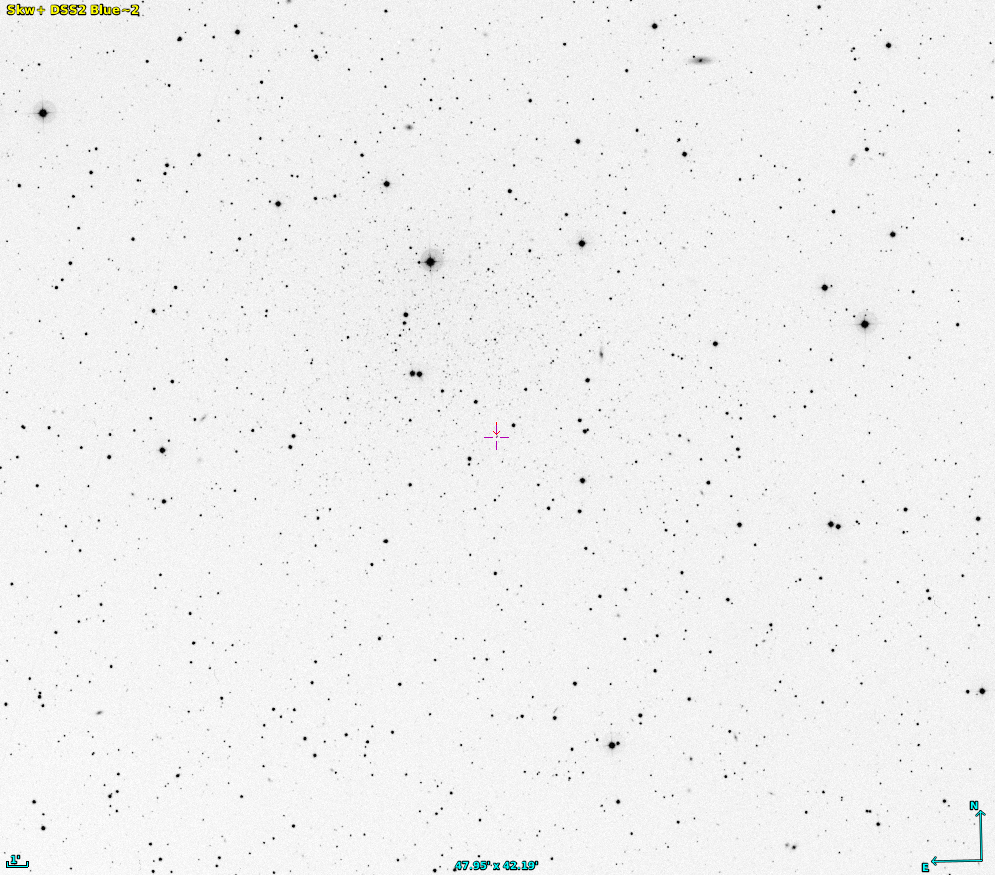
Well, it's subtle -- this is a DWARF galaxy, after all. Here, let me increase the contrast in the image. Can you find it now?
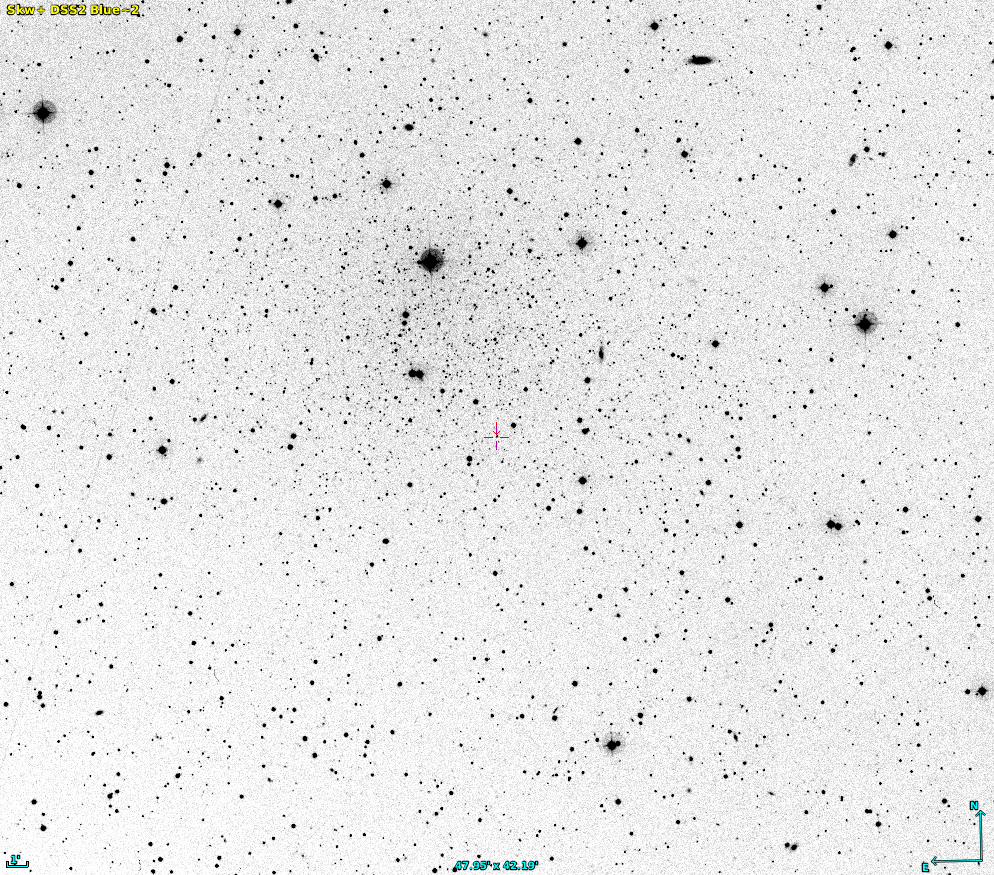
Yes, it's rather subtle, isn't it? Still, if one looks VERY closely, one can find a group of faint stars that have similar motions. And among those stars are a few which show regular variations in brightness. Below are the light curves of four such variable stars, measured in the V passband. The vertical scale in each light curve shows the apparent V-band magnitude.
Light curves taken from Fig 1 of
Bonanos et al., AJ 127, 861 (2004)
Light curves taken from Fig 1 of
Bonanos et al., AJ 127, 861 (2004)
  Q:  What is the average apparent magnitude in the V filter for
              RR Lyrae stars in the Draco dwarf galaxy?


  Q:  The absolute magnitude of RR Lyrae stars in the V filter is approximately
              MV = +0.77

              What is the distance to the Draco dwarf galaxy?
Great! RR Lyrae stars make it easy to determine the distance to another galaxy. Just measure the average apparent magnitude of the variables, and compare the known absolute magnitude.
There's just one problem: RR Lyrae stars aren't really that powerful. Take a look again at this HR diagram:
Background image of HR diagram courtesy of
www.anzwers.org
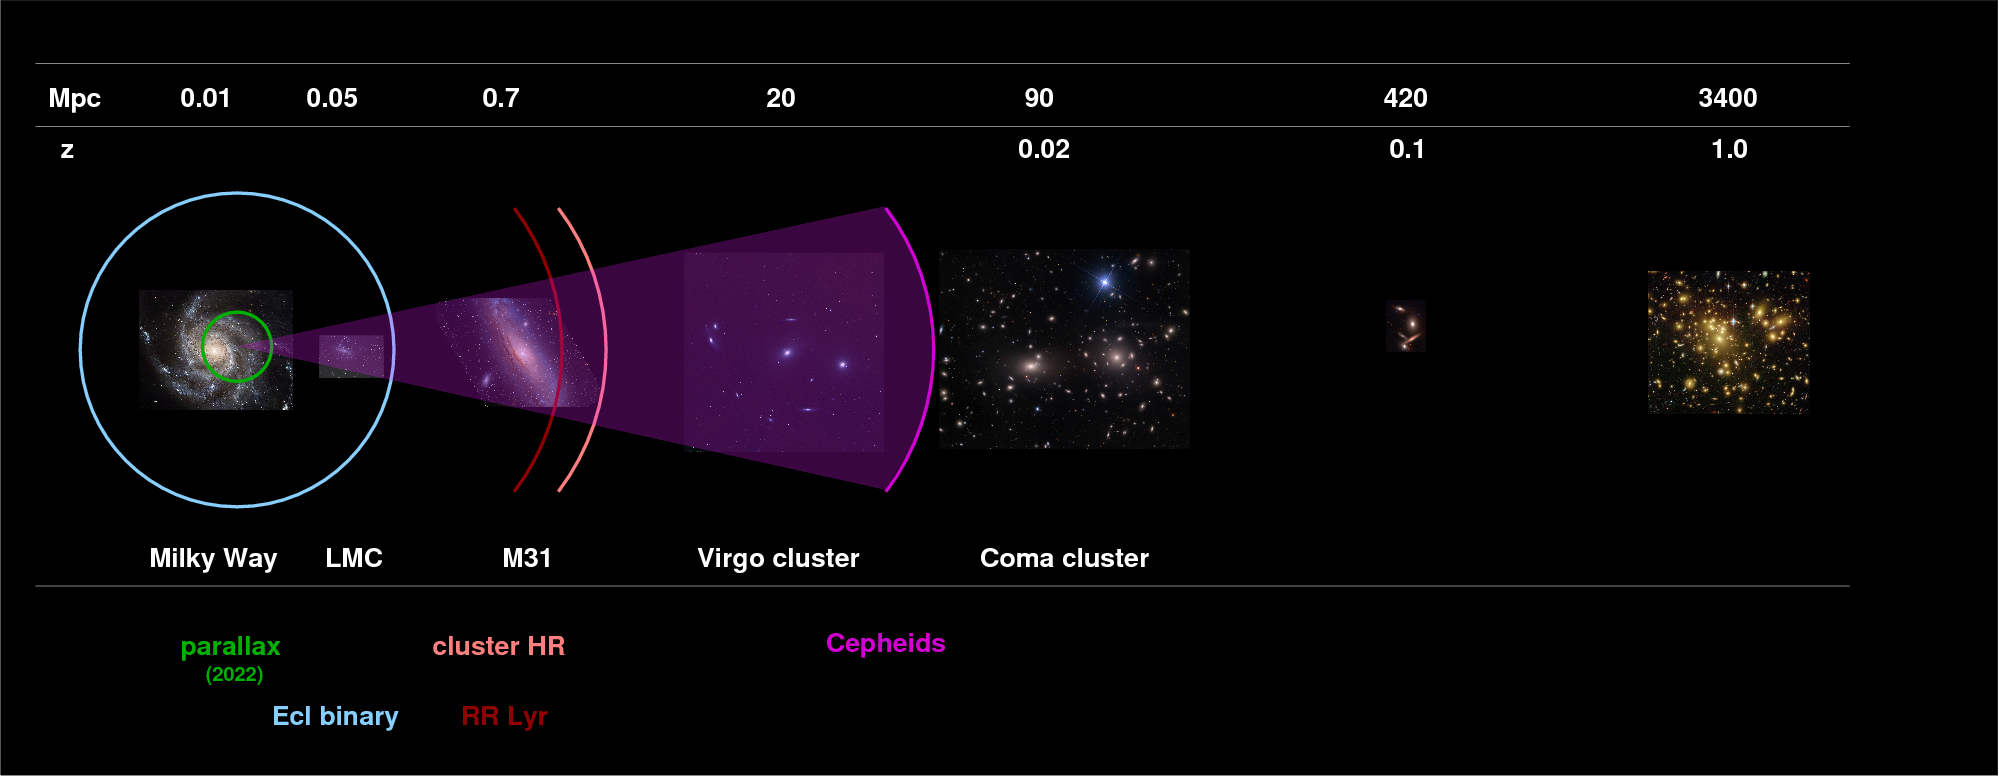
A typical RR Lyrae has a luminosity perhaps 50 times greater than the Sun. That's nice, but it's not powerful enough for us to see these stars in distant galaxies. In fact, we can use RR Lyrae to measure distances only to the very closest galaxies -- members of our own Local Group.
So, RR Lyrae stars make very convenient distance indicators -- but they just aren't luminous enough to be seen in distant galaxies. Rats.
But don't worry! If you look on the diagram below, you'll see that a different class of pulsing variable star, the Cepheids, lies far above the RR Lyrae on the luminosity scale. Cepheids may be 100 times more luminous than RR Lyr stars, which means that astronomers can detect and measure them in much more distant galaxies. Hooray!
Background image of HR diagram courtesy of
www.anzwers.org
Cepheids are more luminous than RR Lyr -- that's the Good News. But there's also a bit of Bad News: they aren't quite so simple to use.
As you may recall, we could treat all RR Lyr as identical in absolute magnitude and achieve decent results. The difference between the average and the extreme (brightest or faintest) RR Lyr stars in any system is only about 0.2 or 0.3 magnitudes, so assuming that they are all identical is not a terrible approximation. But the same is NOT true of Cepheids.
In the diagram below, RR Lyr stars in the LMC are shown as pink symbols. They all cluster together in the lower-left corner, indicating that both their periods and their magnitudes have very little variation. The Cepheids, on the other hand, are shown by the purple and red symbols, which stretch all the way across the diagram.
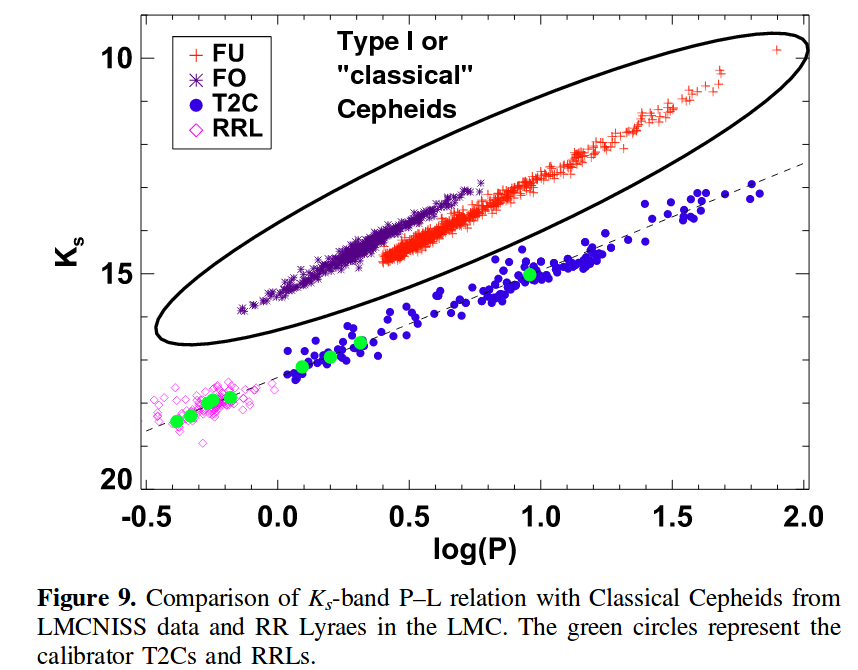
Modified from Figure 9 of
Bhardwaj et al., AJ 153, 154 (2017)
  Q:  What is the range of periods of these Cepheids?


  Q:  What is the range of magnitudes of these Cepheids?
Goodness gracious. We can't possible pretend that all Cepheids are identical in magnitude! No, we need to create a period-luminosity relationship. The idea is that in order to measure the distance to a Cepheid, we need to carry out four steps:
We only needed to use the first and step steps in order to determine the (approximate) distance to an RR Lyr star, because it was (mostly) safe to assume that all of them had the same absolute magnitude. But we can't make that assumption for Cepheids.
We need an equation which will allow us to convert the period of a Cepheid into its absolute magnitude. Hmmm. There are plenty of equations listed in papers in the technical literature, but let's try to derive one ourselves.
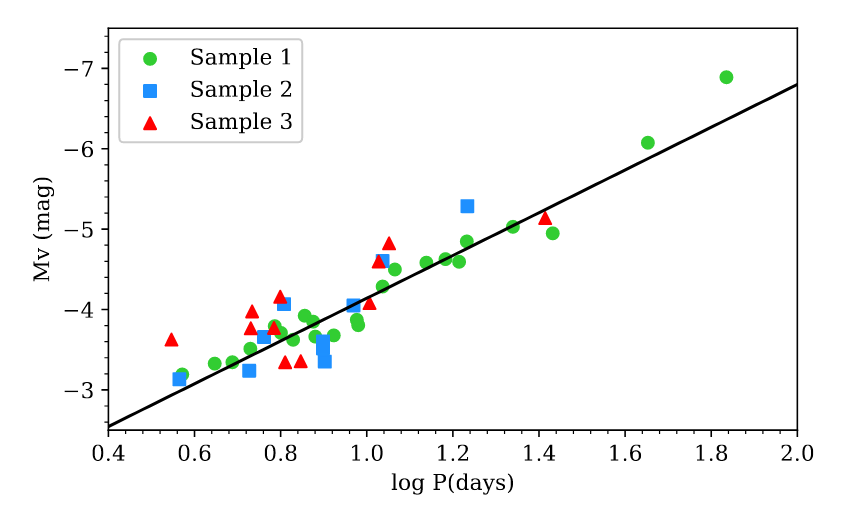
A portion of Figure 7 taken from
Lazovik and Rastorguev, AJ, 160, 136 (2020)
  Q:  Write an equation of the form

                M(V)  =   _________ * log(P)   +    ___________

         which is consistent with the data in the graph.
Now, let's apply this relationship to measurements of Cepheid variable stars in a relatively nearby galaxy: M100.
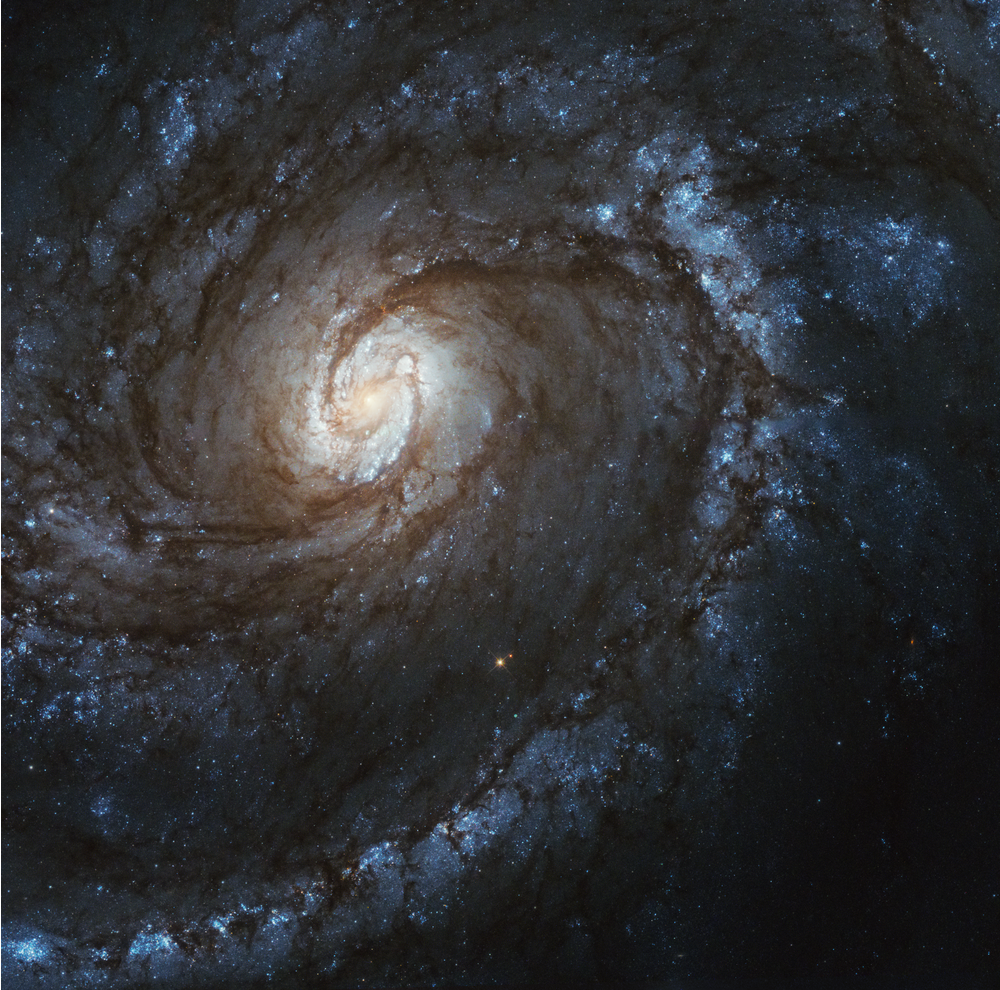
Image of M100 courtesy of
NASA, ESA and Judy Schmidt
Way back in 1994, the Hubble Space Telescope observed this galaxy repeatedly over a period of several months.
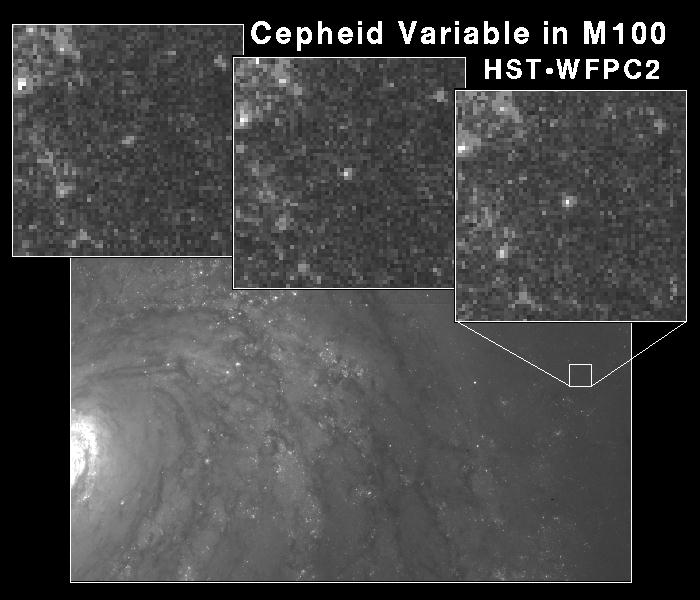
Image courtesy of
Wendy L. Freedman, Observatories of the Carnegie
Institution of Washington and NASA
Astronomers scanned the images and identified stars that changed in brightness in a periodic manner, with the "fast rise, gradual decline" shape characteristic of pulsing stars.
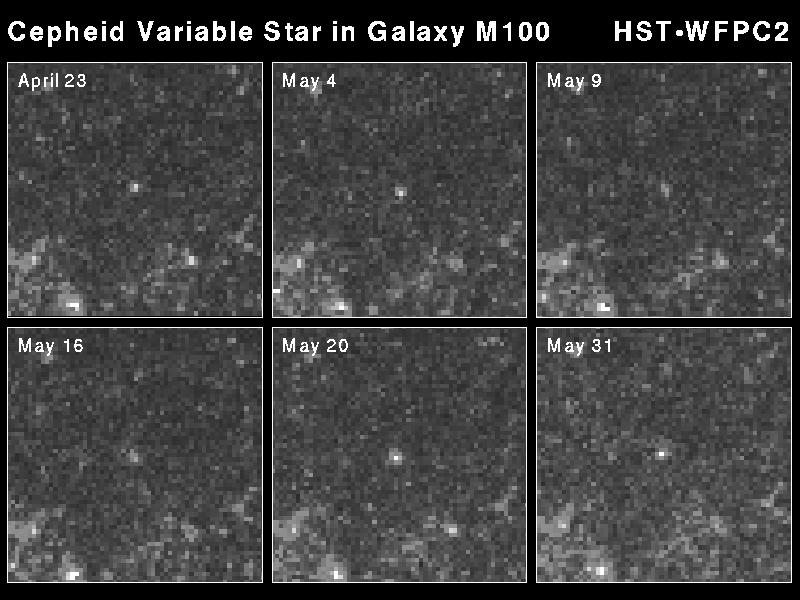
Image courtesy of
Wendy L. Freedman, Observatories of the Carnegie
Institution of Washington and NASA
Let's use their measurements to determine the period and apparent magnitude of a few Cepheids in this galaxy. In the figure below, use the symbols marked with filled black circles, which are V-band measurements.
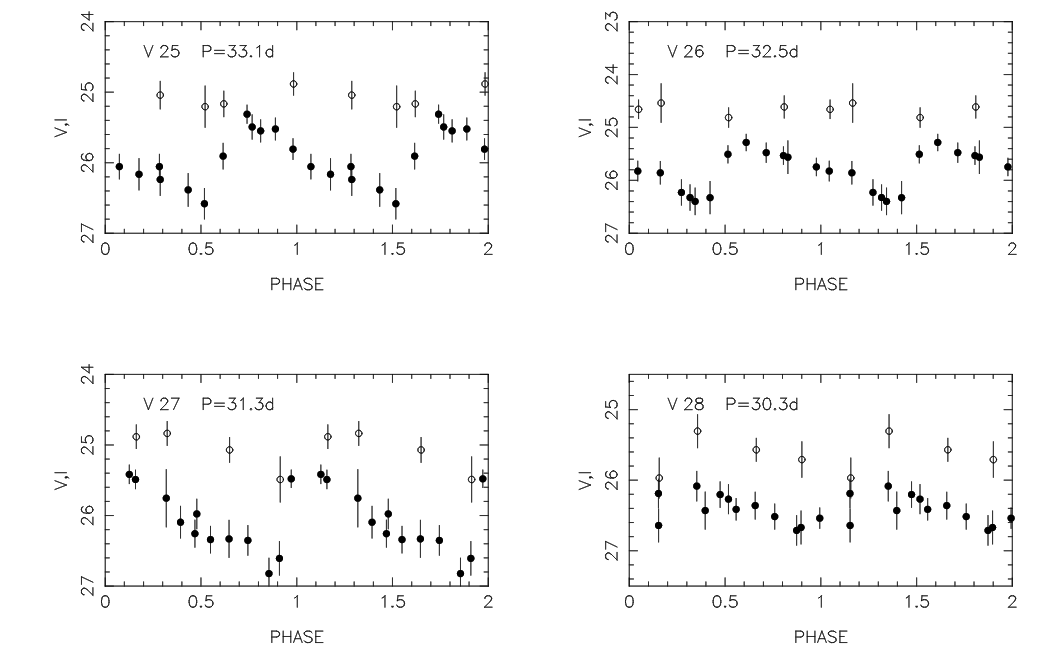
  1.   Pick one variable star.  Measure its average V-band
            apparent magnitude, m

  2.   Use its period to determine its absolute magnitude M

  3.   Compute the distance modulus (m - M)

  4.   Compute the distance to this galaxy, in Mpc
How does you answer compare to that of the authors of the paper from which this data was taken?
  Q:  Was your distance smaller or larger than the authors' value?


  Q:  What could explain that difference?
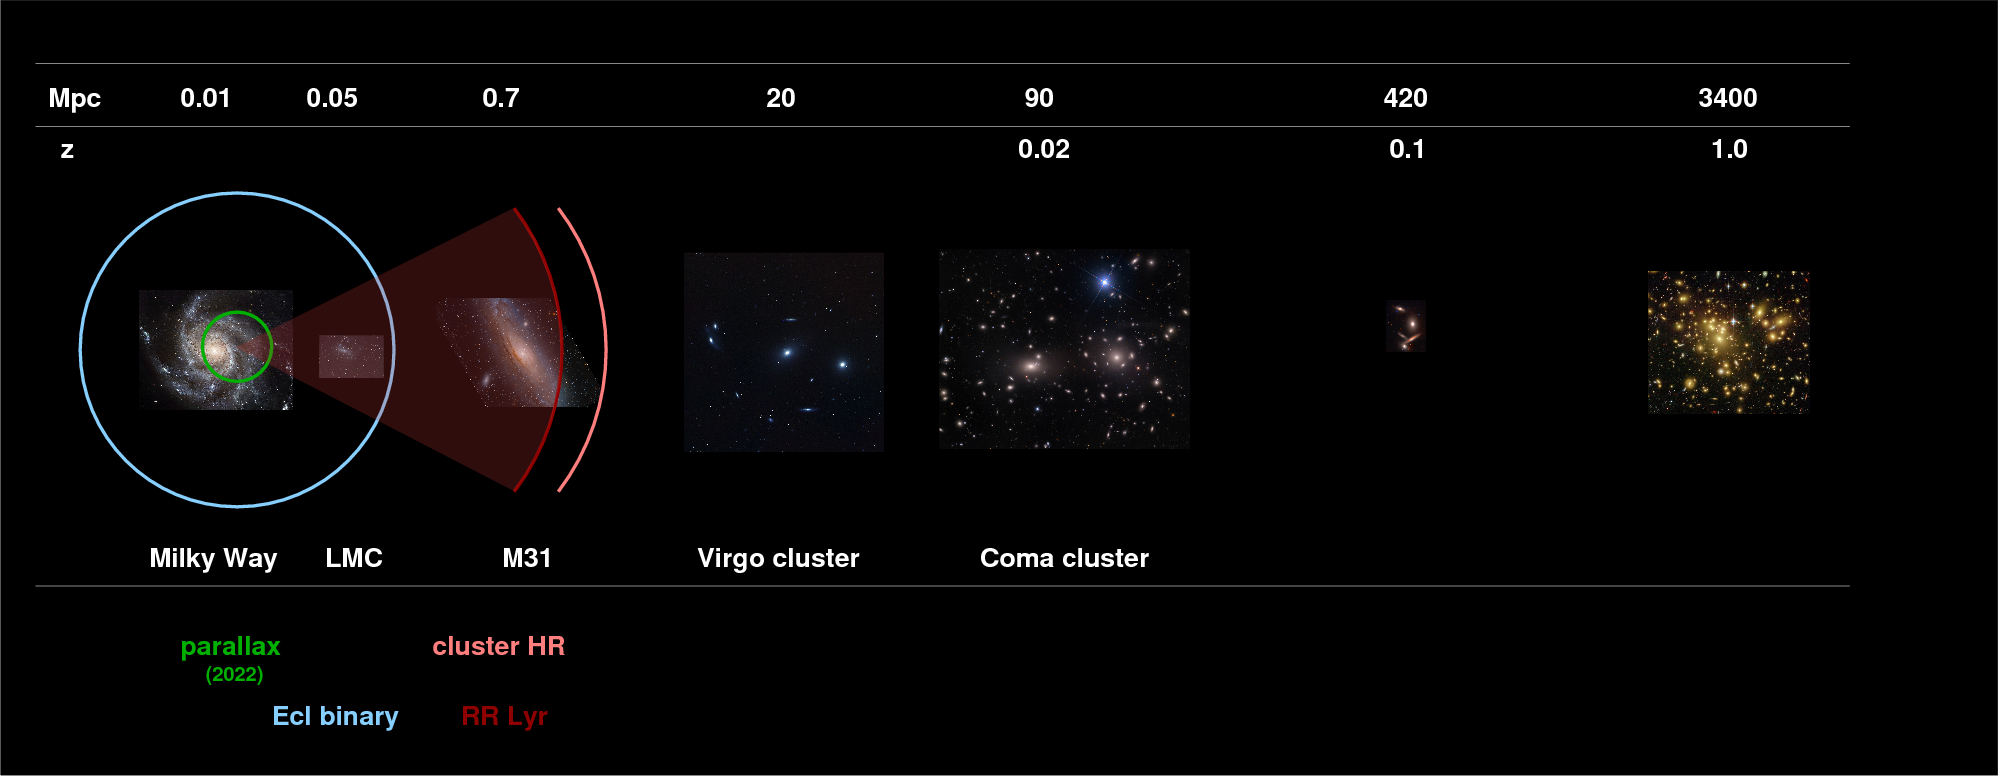
Because Cepheids are more luminous than RR Lyrae, we can use them to extend our reach farther into the depths of space, reaching more distant galaxies. In particular, Cepheids allow us to measure the distance to the nearest big cluster of galaxies, known as the Virgo Cluster.
Copyright © Michael Richmond.
This work is licensed under a Creative Commons License.