 Copyright © Michael Richmond.
This work is licensed under a Creative Commons License.
Copyright © Michael Richmond.
This work is licensed under a Creative Commons License.
For the next three class meetings, we will focus our attention on a special class of stars: those which are observed to undergo periodic oscillations. They grow larger and smaller, hotter and cooler, brighter and dimmer. Today we'll look at WHY the stars behave in this manner; in later lectures, we'll see how clever astronomers can use these special stars as powerful tools to determine the distances to other galaxies.
When we measure the brightness of most stars in the night sky, we find that they remain the same, night after night. But every now and then, we find one which appears to change over time. You've already seen that some stars show brief dips in brightness, like this:
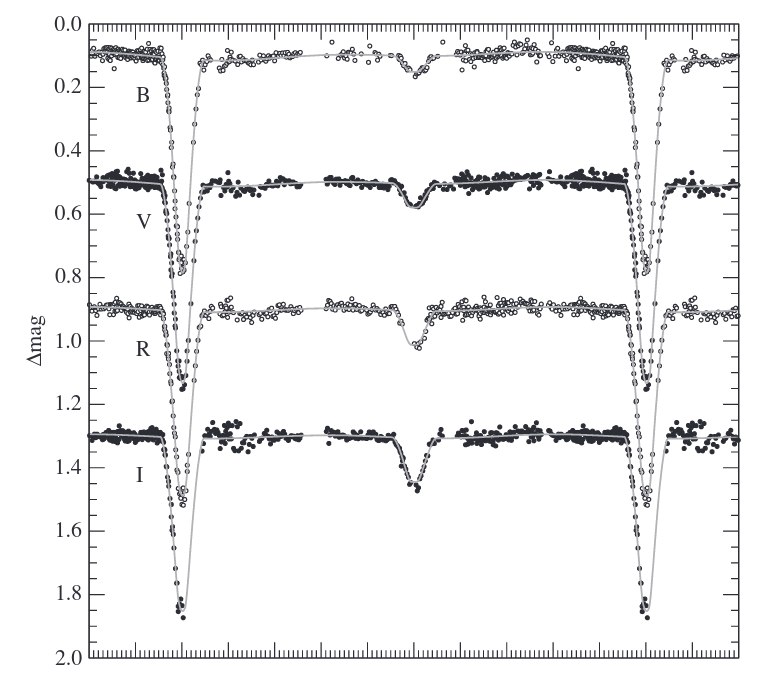
Taken from Figure 3 in
Morales et al., ApJ 707, 671 (2009)
Q: What causes those changes in brightness?
Eclipses by stars in an edge-on binary system, of course.
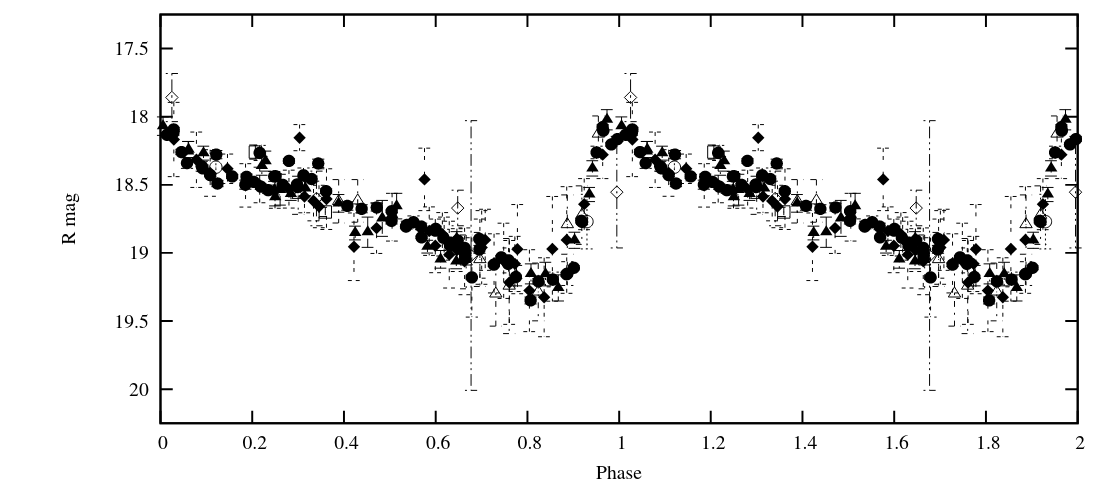
But there are other stars which show regular variations in brightness that look quite different. These aren't short dips:
Light curves of RR Lyrae stars taken from
Bonanos et al. AJ 127, 861 (2004)
Instead, the common theme is a "quick rise, gradual fall."
Light curve of Cepheid M31-V1 taken from Fig 1 of
Templeton et al., PASP 123, 1374 (2011)
Measurements of the radial velocity of these stars show clearly that their outer layers are PULSING: expanding, then contracting, expanding, then contracting.
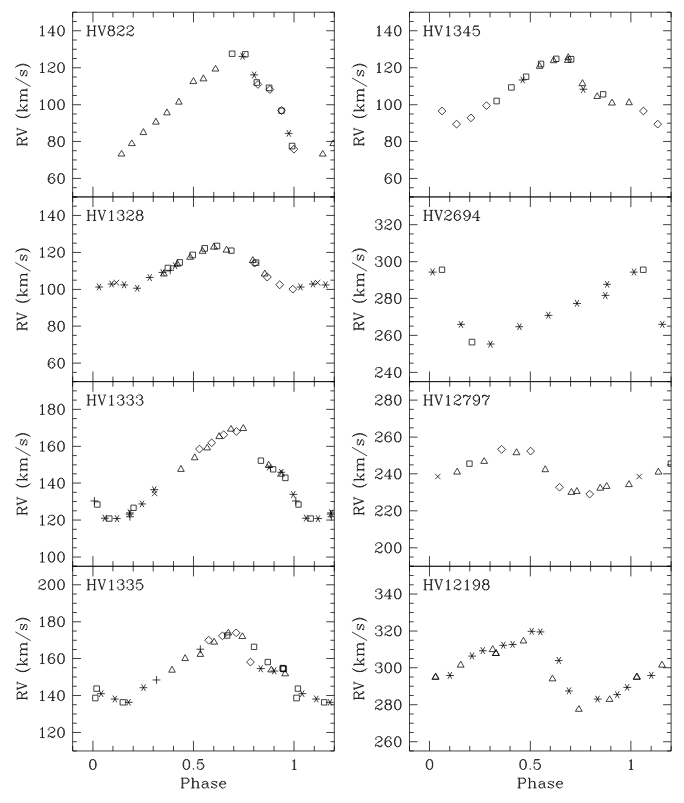
Taken from Fig 9 of
Storm et al., A&A 415, 521 (2004)
Hmmm. What could cause stars to behave in this manner?
One clue is the position of these stars in the HR diagram. We find pulsing stars only in a few narrow regions: always above the main sequence, and always within a narrow range of temperatures.
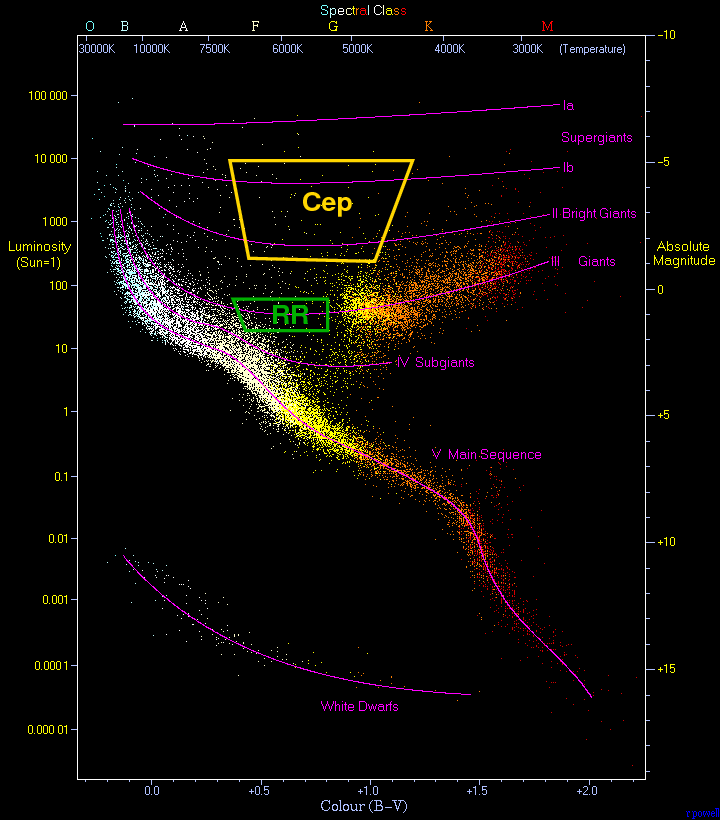
Background image of HR diagram courtesy of
www.anzwers.org
What's going on inside these stars? What causes them to expand and contract on a regular basis? One key, as we will see, is the nature of opacity within certain layers of the stars.
But before we get into the physics of stellar interiors, let's examine briefly a more familiar example of the instability: a pot of boiling water on the stovetop.
What happens if one places a lid onto a pot of boiling water on the stove?
(Click on the image to find out)
Keep this cycle in mind as we examine the behavior of one shell of gas within a star.
Let's consider some location inside an ordinary star, and mark one shell in our stellar model. All the material in this shell has uniform properties. It lies below the outer atmosphere of the star, and above the deep interior and the core.
What would happen if the layers just above this shell happen to press down a bit harder than usual?
Suppose that the gas within this shell behaves like an ideal gas. In that case, its behavior is governed by the ideal gas law:
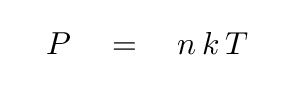
Q: What happens if the Pressure (on left side) increases?
Right. Two things can occur (and often, both do):
Now, what are the consequences of this changes? Specifically, what happens to the opacity κ of the gas in this shell? If the opacity should happen to INCREASE, then the gas might trap energy trying to rise from below. That could push the shell outward -- perhaps starting some sort of oscillation.
As you may recall, the opacity of a gas is due to many different mechanisms; therefore, in general, there is no simple way to describe its behavior. However, models show that the opacity does tend to decrease if the temperature increases.
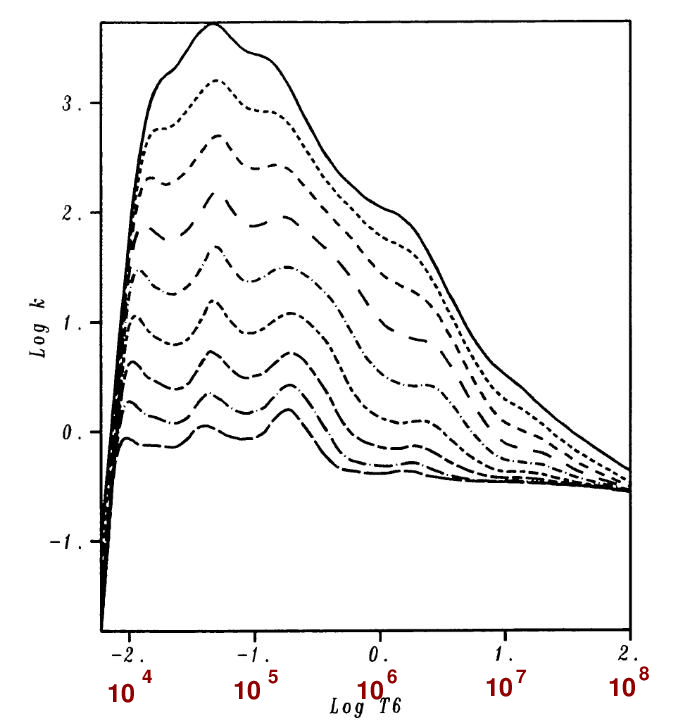
Figure 2a taken from
Rogers, F. J., and Iglesias, C. A., ApJS 79, 507 (1992)
and slightly modified
Under many circumstances, one can express the opacity at least approximately using the so-called Kramers' opacity law:

Let's see how this sort of opacity would react to the changes caused by the upper layers pushing down.
   Q:  Since the density increases, the opacity should  __________  ?

   Q:  Since the temperature increases, the opacity should  __________  ?

   Q:  Which effect is more important?
The change in density tends to increase opacity, but the increase in temperature tends to decrease it. Under most circumstances, the temperature effect is more important (due to the large exponent of 3.5), and so the usual result is for the opacity to DECREASE.
That means that energy from below has an easy time passing through the compressed shell. The shell will NOT trap energy, and so it will NOT be pushed upward to start a cycle of oscillation.
Rats.
However, not all shells of gas are the same. Let us consider some very particular layers of gas, those which have the right combination of density, temperature, and chemical composition to create a zone of partial ionization. This might mean that the hydrogen atoms are partially ionized, or, deeper down in the star, that the helium atoms are partially ionized.
In these regions, gas in the shell which is being compressed has one more mode of reacting to the stress.
So, in this case, some of the energy added to the shell by the compression goes into ionizing atoms -- and NOT into raising the temperature of the gas; or, at least, not raising the temperature quite so much.
If this should happen, then the consequences on the opacity of the shell become
The net result can be that the INCREASE in opacity due to the increased density outweights the decrease due to the slightly higher temperature.
In other words, inside an ionization zone, a shell of gas may grow more opaque if it is compressed. That can set up a cycle just like that of the pot on the stove.
There is another effect which can take place inside this same partially-ionized layer, which might also contribute to the trapping of energy. In certain circumstances, neutral atoms of H or He can grab onto a passing electron to produce a negatively-charged ion (yes, that sounds really strange; we don't see this happen on Earth very often). These ions are fragile, but they have an important feature while they last: they absorb photons very effectively. If a shell should build up enough of these negative ions, its opacity can rise significantly.
Okay, suppose that the conditions inside a star are just right to put a partially-ionized zone at the proper location to trigger a pulsational instability. Those layers trap energy, are pushed outward -- causing all the layers above them to expand, too -- then release the trapped energy and fall back down -- causing all the layers above them to fall back, too.
How long will this process take? What will be the period of these oscillations?
A warning up front: through the remainder of this section (and following sections), I will make a big, big simplification which is contrary to fact. I will assume that the density of the star is uniform from center to photosphere. This is, of course, not true.
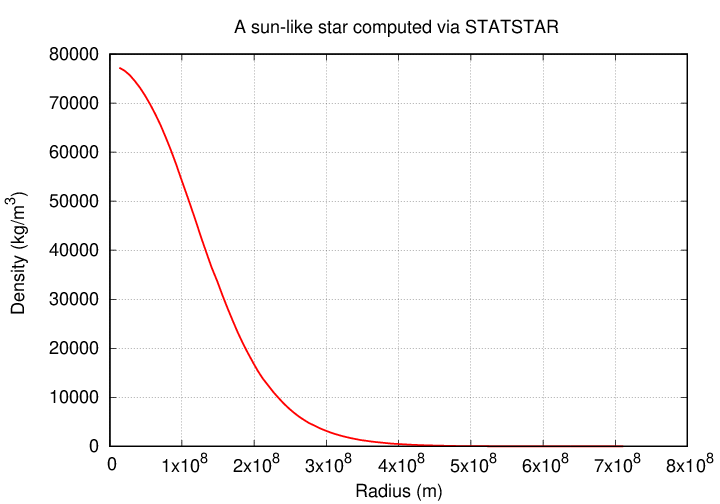
Therefore, all the calculations below will not be very accurate. Don't expect the examples to match reality very well.
Okay, let's suppose that the star has a uniform density ρ, and let's start by asking a simpler question. Instead of "What is the period of pulsation?", let's ask "how long would it take the shell to fall inward to the center of the star?" (and ignore the second half of the cycle, the outward expansion).
  Q:   Do you recall any examples of clouds of gas falling inward
            on themselves, driven by gravity?
I certainly hope so!
In the case of a uniform-density cloud of gas which collapses due to its own self-gravity, the time required is independent of size or mass; all that matters is the initial density.
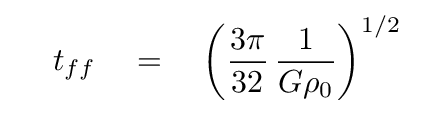
This suggests that maybe, just maybe, the time required to oscillate might also depend on the average density of a star.
But that was only half of the story. What we need to explain is not just a collapse, but then a subsequent expansion back to the original size. In fact, what we need to explain is a long cycle of repeated motion, in which a gaseous material oscillates back and forth in a periodic fashion. Hmmm. That sounds like a WAVE -- maybe even a sound wave.
Remember, if you will, the topic of sound waves inside a cylindrical tube, such as a flute or an organ pipe.

Animation
thanks to
Daniel A. Russell
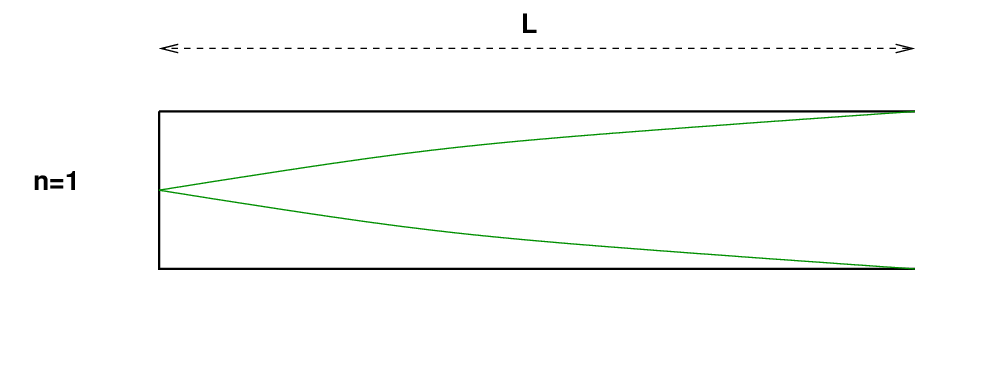
If one end of the tube is closed, the molecules can't move; they are fixed in place, and the oscillation must have a node at the closed end. If one end of the tube is open, then the molecules must move with their maximum possible amplitude: the oscillations must have an anti-node at the open end.
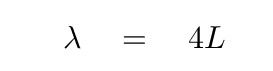
Suppose we have a tube of length L open at one end and closed at the other. In the simplest case, the fundamental mode of oscillation, a standing wave in the tube must have a wavelength
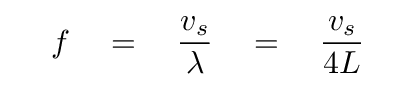
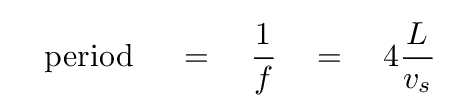
We can derive the frequency and the period of the oscillations, too.
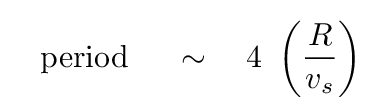
What does all this have to do with oscillations inside a star? We can pretend, if we squint hard enough, that a star is a sort of tube:
Putting all that together, we can estimate that the period of oscillations of a (mythical) star of uniform density would be
Phew. We're almost there. All we need is some approximate expression for the speed of sound waves inside a star of uniform density, and we'll have a guess at the period of radial oscillations.
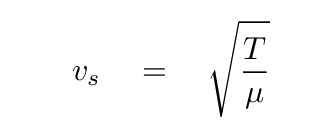
If you can recall the discussion of waves travelling on a 1-D string from your intro physics classes, you may remember that the speed of the waves depends on two terms: one describes the force restoring a string to its original position (tension T), and the other the resistance of the string to being moved (linear mass density μ).
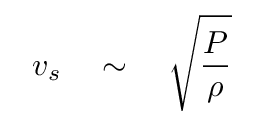
In a three-dimensional container of gas, the speed of waves is again a balance between the restoring force (related to the pressure P), and the resistance to motion (the density ρ). To a fair approximation, we can write
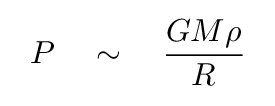
Now, the pressure P in this strange, one-shell model of a star can be computed, and turns out to be
  Q:  Substitute this value of P into the equation for sound speed
            of a uniform density star.
You should find that the sound speed is

Phew. That was a lot of work, but now we can finally estimate a value for the period of a stellar oscillation. If we combine the expression for sound speed, above, with the expression for the period of a standing wave in a "star tube" with one closed and one open end, below,
we end up with a formula which provides a very approximate guess for the period of oscillation of an entire star.
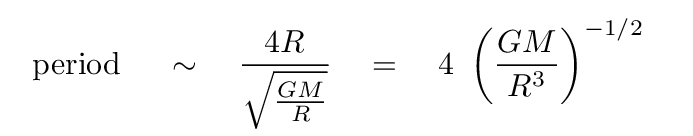
Hey, look at that term inside the parentheses. There's mass on the top, and radius cubed on the bottom. That reminds me of DENSITY. In fact, it looks like the period must be related to DENSITY to the negative one-half power.
Hmmmm.
Well, let's try it out! The star SZ Tau has the following values:
And, of course, G = 6.67 x 10⁻¹¹ N*m2/kg2.
  Q:  What is the period of oscillation of SZ Tau?  Express your answer
               in days (1 day = 86400 seconds).
The actual period of this star is about 3.1 days. Remember, our analysis made lots and lots of approximations and simplications, and yet we still end up within a factor of three. Not bad!
Take another look at the HR diagram, and focus on the regions in which pulsing stars are found.
Background image of HR diagram courtesy of
www.anzwers.org
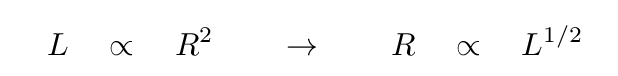
Both Cepheids and RR Lyrae fall within a pretty narrow range of temperatures. Let's simplify a bit and pretend that the temperature of all these pulsing stars is a constant value. That would mean that the luminosity of each star should depend only on its size.
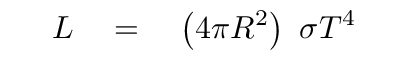
And that implies a simple relationship between size and luminosity.
Just a few minutes ago, we found that the period of oscillation of a star depends on its mass and radius.
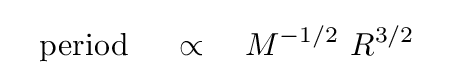
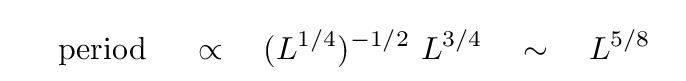
If we substitute the connection between radius and luminosity into this equation, we see that there ought to be relatioship between the PERIOD of a pulsing star and its LUMINOSITY.
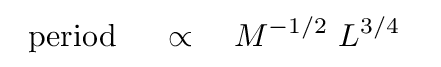
We can do even better. In homework set 4, you found some approximate power-law relationships between the mass of a star on the main sequence and its luminosity, radius, temperature, and other properties. If we pretend that these pulsing stars obey the same relationships (hint: they don't, really, so this is even more of a stretch), we can write
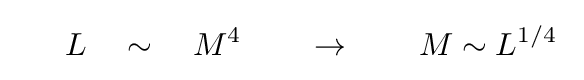
and so we can replace the mass with another expression for luminosity.
Hmmm. This has been a lot of approximations and simplications, but at least it seems plausible that there might be some connection between the period of a pulsing star and its luminosity.
But enough of theory! Let's look at some real, cold, measurements. Pietrzynski and Udalski, AcA, 49, 543 (1999) report photometry of many Cepheids in the Small and Large Magellanic Clouds. The graph below shows the period of the Cepheids in the LMC, and the luminosity of each one in the I-band. I've plotted the values in a log-log diagram.
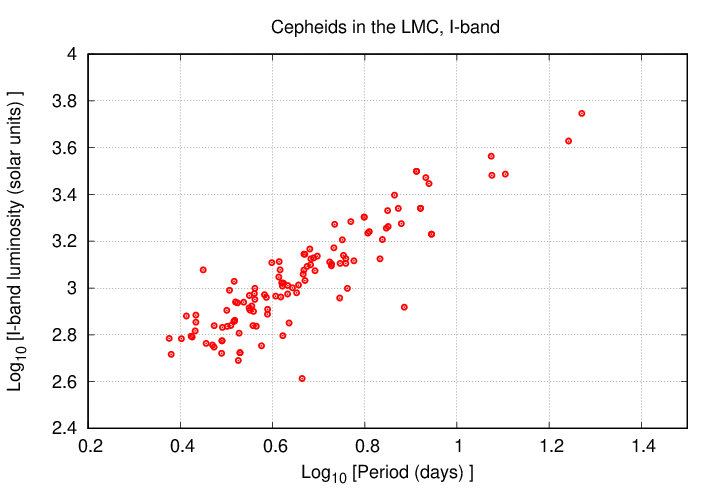
Q: Is there a power-law relationship between period and luminosity?
How can you tell just by looking at the graph?
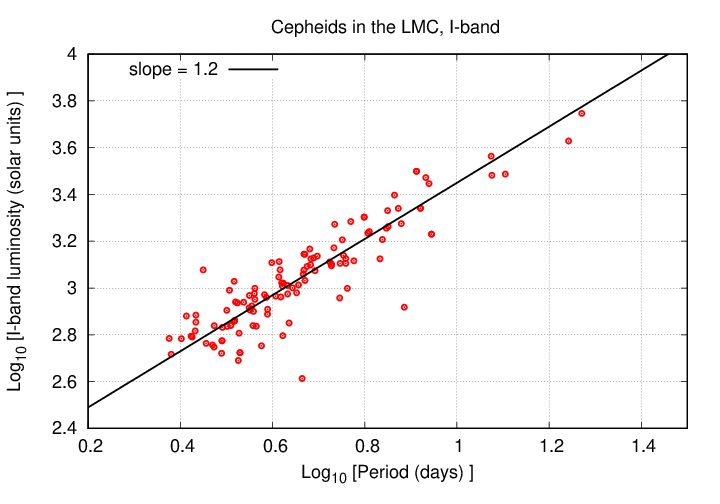
Q: The slope of a line on this graph corresponds to the RECIPROCAL
of the exponent in our equation (because this graph shows
period on the x-axis, not luminosity).
Does (1/slope) equal our prediction of the exponent?
Copyright © Michael Richmond.
This work is licensed under a Creative Commons License.