 Copyright © Michael Richmond.
This work is licensed under a Creative Commons License.
Copyright © Michael Richmond.
This work is licensed under a Creative Commons License.
Cepheid variable stars are luminous, so we can see them in some galaxies beyond the Milky Way. However, even the most luminous Cepheids, with absolute magnitudes of about M = -6, fall below the detection limits of our current technology at some point.
  Q:  Astronomers can measure variations
      accurately in stars down to apparent
      magnitude roughly m=27.  How far away
      can we use Cepheids to measure distance?
If we want to estimate distances to galaxies beyond this limit, we need to find a set of secondary distance indicators: objects which are significantly more luminous than Cepheids -- so that they are visible at greater distances -- yet still have uniform and well-understood properties. The idea is
By analogy, imagine having nothing but an ordinary ruler and a long piece of string.
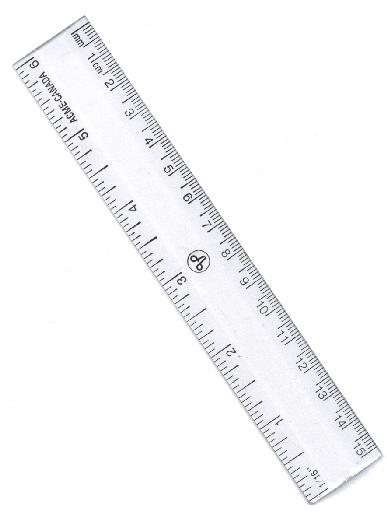

If I ask you to measure the distance across my desk, you can simply use the ruler: you may have to pick it up and move it several times, but it still does the job. But what if I ask you to measure the distance from one side of campus to the other? The ruler is NOT the right tool for that job. What you can do is
In this case, the ruler is a primary distance indicator -- like Cepheids -- in which you have confidence. The string is a secondary distance indicator: it provides a less accurate measurement over longer distances.
You can read about several different secondary distance indicators in a lecture for another course.
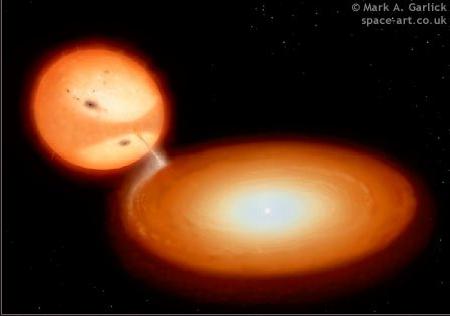
One of the most powerful of these secondary methods employs Type Ia supernovae. These titanic explosions occur when a white dwarf in a close binary system accretes material from an ordinary stellar companion:
Copyright
Mark A. Garlick -- see
http://space-art.co.uk
If the white dwarf accretes enough material to push its mass beyond a particular value called the Chandrasekhar limit (about 1.4 solar masses), a runaway nuclear fusion reaction can convert much of the white dwarf's mass into energy, creating a very, very, VERY luminous fireball which lasts for several weeks. At their peak, Type Ia supernovae can reach absolute magnitude roughly M = -19. Because they are so much more luminous than Cepheid stars, we can use them to probe the universe to much greater depths.
Last fall, the brightest type Ia supernovae in decades appeared in the sky. An automated telescope called the Palomar Transient Factory , and a computer-controlled image processing pipeline, alerted human scientists to an object in the nearby galaxy called M101:
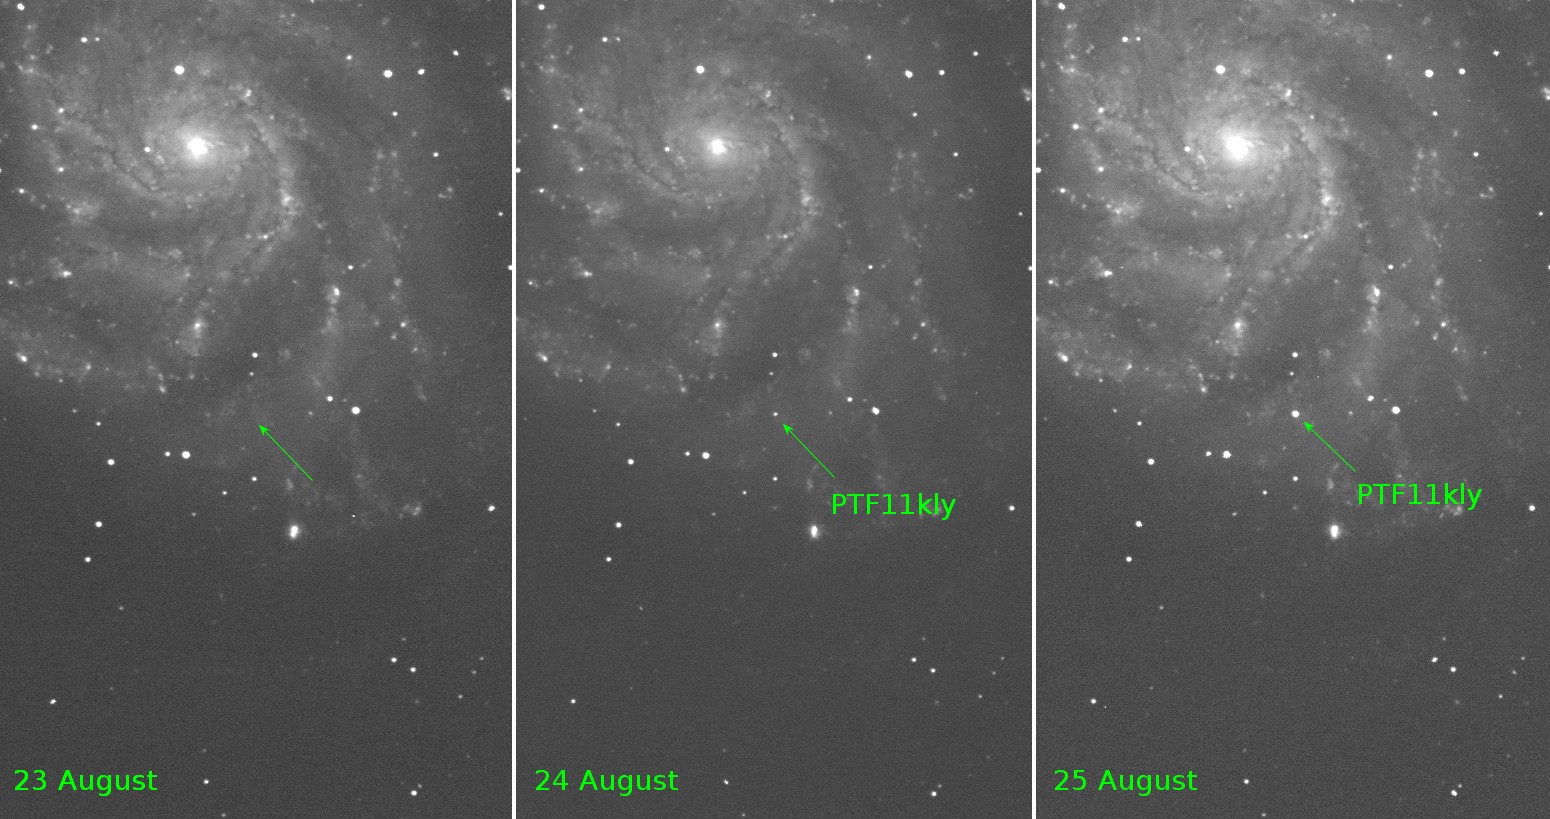
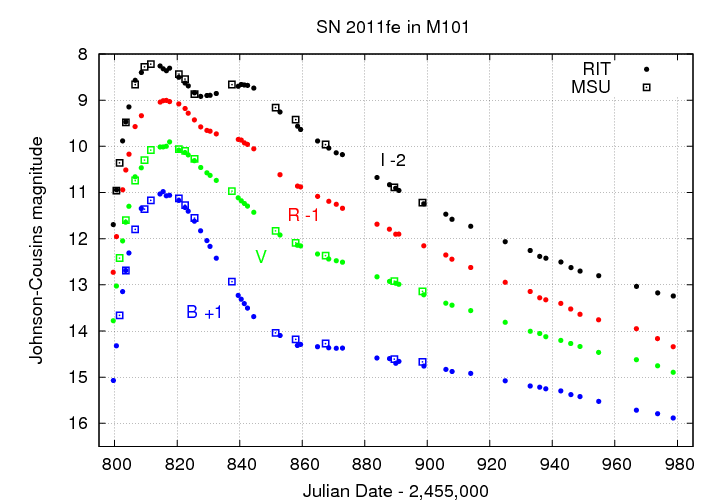
We observed this supernova right here on campus with telescopes at the RIT Observatory, following it as it grew brighter over several weeks, then slowly following it as it grew brighter over several weeks, then slowly faded away. You can read a technical paper for more details.
It would make our job easier if all Type Ia supernovae were identical, with exactly the same absolute magnitude. After decades of study, it appears that this is not the case: some SNe Ia are more powerful than others, by factors of 5 or 6. However, there are several other properties of SNe Ia which appear to correlate with their luminosity, so that we can correct for this variation in luminosity reasonably well.
Recall that the current limit of detection for Cepheid variables corresponds to a distance of about 40 Mpc. Note how much farther away we can measure Type Ia SNe:
Diagram from Reindl et al., ApJ 624, 532 (2005) ,
with assumption that Mv = -19.
So, using these secondary distance indicators, we can continue to investigate the expansion of the universe on larger and larger scales. Many different scientists have performed the calculation in many different ways, but to a rough approximation, the current (May, 2005) value of the Hubble constant is somewhere around
H0 = 70 km/s/Mpc
Now, recall what this means:
  Q:  How fast is galaxy A moving away from us?

  Q:  How fast is galaxy B moving away from us?
We interpret this pattern to mean that the universe is expanding: distant galaxies are moving away from us.
But suppose that we run the film in reverse: in the past, each galaxy must have been closer to us (and to each other). It seems logical that there must have been a time when all the galaxies were packed close together. How long ago did that happen? We can get a very rough idea by making the (incorrect, but simplifying) assumption that as we run the film backwards, galaxies continue to move with their current speeds.
  Q:  How long would it take galaxy A to reach us
      if it were to move BACKWARDS at its current speed?
      (Hint: 1 Mpc = 3 x 10¹⁹ km)

  Q:  How long would it take galaxy B to reach us
      if it were to move BACKWARDS at its current speed?
In order to find this time, you take the current distance of a galaxy and divide by its current speed.
But -- wait a minute -- doesn't that sound a bit like something else you have seen recently?
Yes -- the Hubble constant! That's one reason astronomers are so interested in the value of the Hubble constant: it provides a clue to the age of the universe.
So, to a first approximation, the value of the current expansion rate of the universe tells us how long the universe has been expanding. But let's go beyond the first approximation and look in more detail.
When we look out at nearby galaxies, we see one at a distance of 20 Mpc moving at roughly 1400 km/s, and a galaxy at 40 Mpc moving twice as fast.
But as the galaxies move away from each other, they continually feel the force of gravity pulling them back towards each other.
That means that we should expect the speed of this expansion to decrease as gravity decelerates galaxies. In other words, if we were to travel into the future, many billions of years from now, and find another pair of galaxies which happened at that time to be at 20 Mpc and 40 Mpc from the future Earth, we might expect to see a more leisurely expansion:
Likewise, in the past, ancient astronomers might have seen galaxies at these distances to be moving much more quickly:
  Q:  How would this gradual decrease in expansion
      rate change our estimate of the age of
      the universe based on the Hubble constant?
Right. Our quick estimate of the age of the universe would be an over-estimate, since it assumes that the expansion rate has been constant. In real life, if the expansion rate was quicker in the past, then the galaxies took less time to reach their current distances.
Let's look forward to the far future of the universe. We think that gravity ought to be decelerating the expansion of the universe; does that mean that the expansion will ever stop?
Well, it depends on the strength of the gravitational force between large-scale structures in the universe.
  Q:  What factors affect the strength of the
      gravitational force between bodies?
Right, two factors
We can combine these factors into a single value, the average density of the universe. The future of the expansion depends on the exact value of this density:
but
Astronomers use the Greek letter "Omega"
to denote the average density of the universe.
The critical value of
this average density is Omega with a subscript zero,
or ![]() .
.
So, for many decades, astronomers tried very hard to measure the actual average density of the universe, and figure out its eventual fate.
We can see stars and clouds of gas, and use our observations to estimate the amount of matter within them. You may recall that when astronomers examine the motion of objects within a galaxy, they often find that stars move in their orbits at speeds which are higher than expected. There is apparently some dark matter within galaxies which exerts gravitational forces on stars, but which does not emit any light of its own.
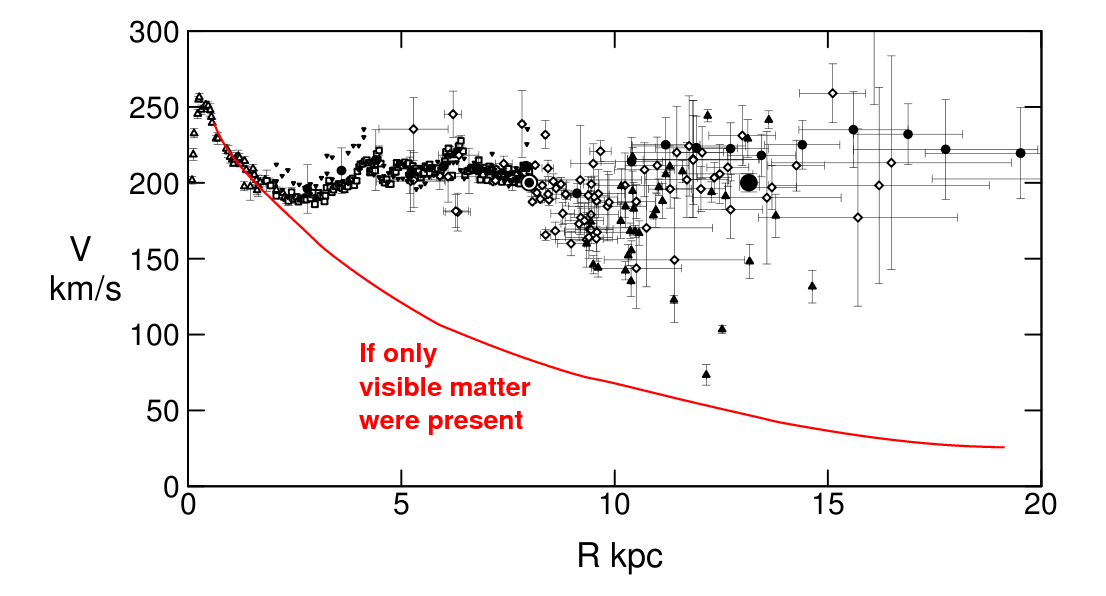
Original figure taken from
Sofue, Honma and Omodaka, PASJ 61, 227 (2009)
When we add up all the matter in the universe to compute
![]() ,
we must include the appropriate amount of dark matter inside
galaxies.
,
we must include the appropriate amount of dark matter inside
galaxies.
But wait -- there's more dark matter! When astronomers look far beyond our own Milky Way Galaxy, they find that other galaxies often clump together in groups or clusters.
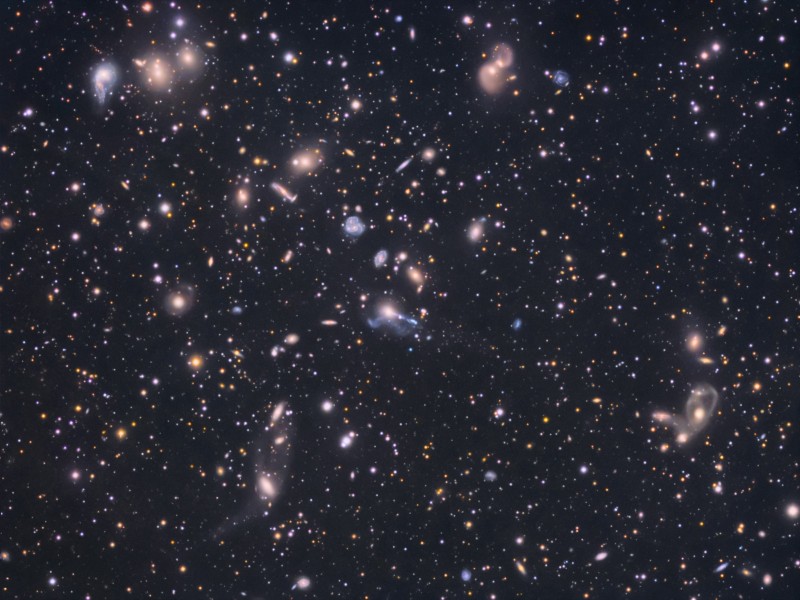
Image copyright
Tony and Daphne Hallas,
provided by
Astronomy picture of the day
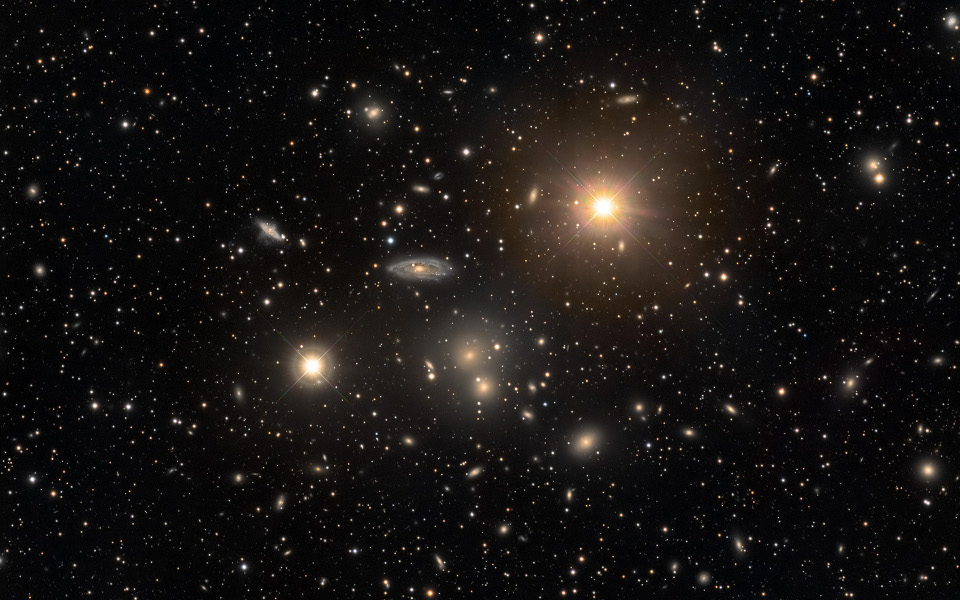
Image courtesy of Angus Lau and
Astronomy Picture of the Day
This tendency to form clusters becomes obvious if one makes a map of a very large region of space, like the one below from the Sloan Digital Sky Survey.
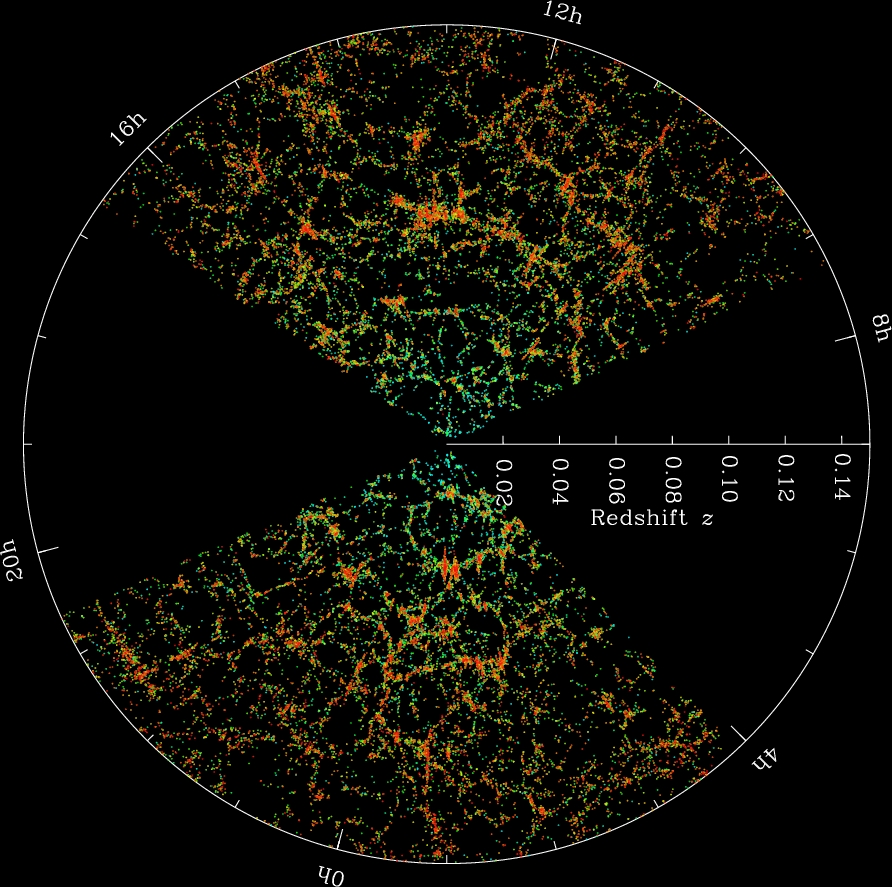
Image courtesy of
The Sloan Digital Sky Survey
We can measure the size of these galaxy clusters, and, using Doppler shifts based on spectra of the galaxies, we can also measure the velocities of the galaxies in the clusters. Although the motions of galaxies in clusters are not simple circles, we can still use Newton's laws to make a rough estimate of the mass within the cluster.
where
     M     =     total mass of material inside the cluster (kg)

     R     =     radius of the cluster (meter)

     v     =     typical speed of galaxy (meter/sec)

     G     =     6.67 x 10⁻¹¹  N-m^2/kg^2
Let's use this relationship to determine the amount of matter inside the Virgo Cluster, which is relatively close to the Milky Way. Measurements indicate
     R     =     1  Mpc     [ remember 1 Mpc = 3 x 10²² m ]

     v     =     700 km/s


  Q:   What is the mass of the Virgo Cluster in kg?


  Q:   What is the mass of the Virgo Cluster in solar masses?
We can also measure the amount of light from stars and gas in the Virgo Cluster. When we add up all the mass due to these visible objects, we get a mass of about
      M(visible)   =   1.2 x 10¹²  solar masses


  Q:   How does this visible mass compare to the total mass
       revealed by the motions of the galaxies?

  Q:   What is the ratio of dark matter to visible matter?
Clearly, the average density ![]() is dominated by dark matter.
is dominated by dark matter.
But, in recent years, it appears that things are EVEN MORE more complicated than we had thought .....
Copyright © Michael Richmond.
This work is licensed under a Creative Commons License.