 Copyright © Michael Richmond.
This work is licensed under a Creative Commons License.
Copyright © Michael Richmond.
This work is licensed under a Creative Commons License.
The basic theory of gravitational lensing is pretty easy to find. I have a few pages on it from previous courses.
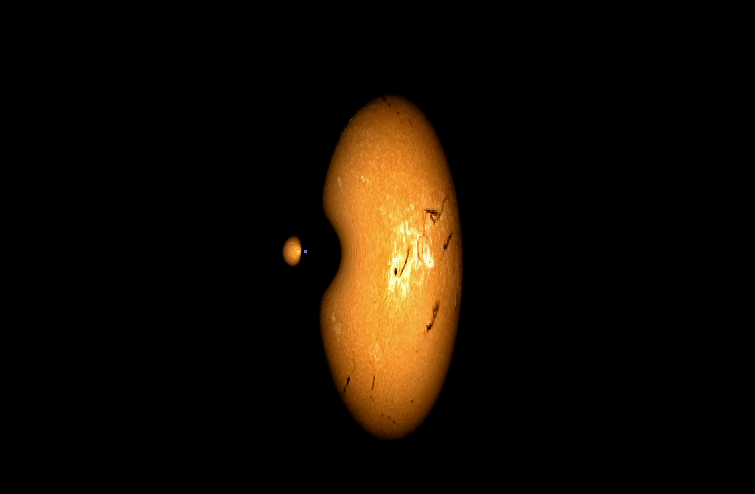
So, in the simplest case of a single star lensing a more distant single star, we can learn quite a bit about the masses and motions of the stars. We can even, sometimes, "see" details in the atmosphere of the lensed star -- such as limb darkening:
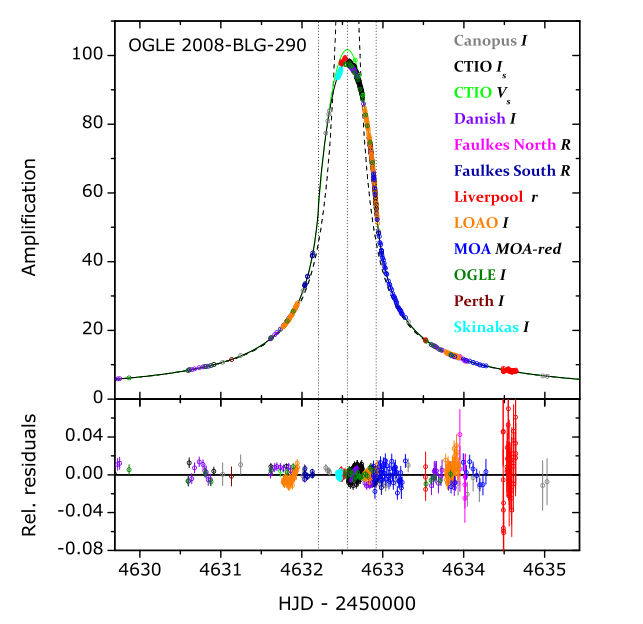
Figure 1 taken from
Fouque et al., A&A 518, 51 (2010)
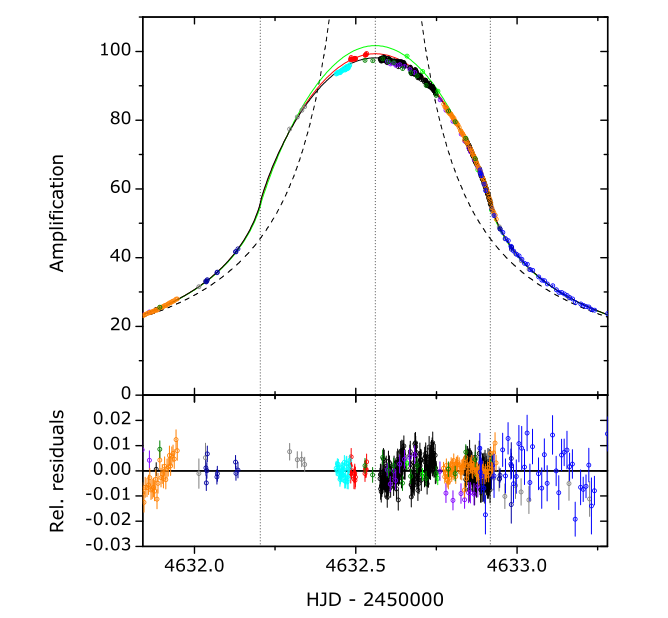
Figure 2 taken from
Fouque et al., A&A 518, 51 (2010)
But how can lensing help us to find planets?
Let's summarize the basic properties of gravitational lensing, as they pertain to finding planets around other stars using this technique.
              The Good                            The Bad
  ------------------------------------------------------------------

          can reveal very low-mass           rare, requires millions
               objects                            of measurements

          can work on systems at             does not yield direct value
               very large distances               of mass (without additional
               from the Earth                     information from other
                                                  methods)

                                             requires teams of observers
                                                  around the world

                                             not repeatable

  ------------------------------------------------------------------
That last one is a doozy. If only one group was able to observe an event, there's no real way to check it afterwards to verify that it wasn't an artifact of some sort.
Let's take a look at the current census of exoplanets to see how many have been discovered via gravitational lensing, and what their properties might be.
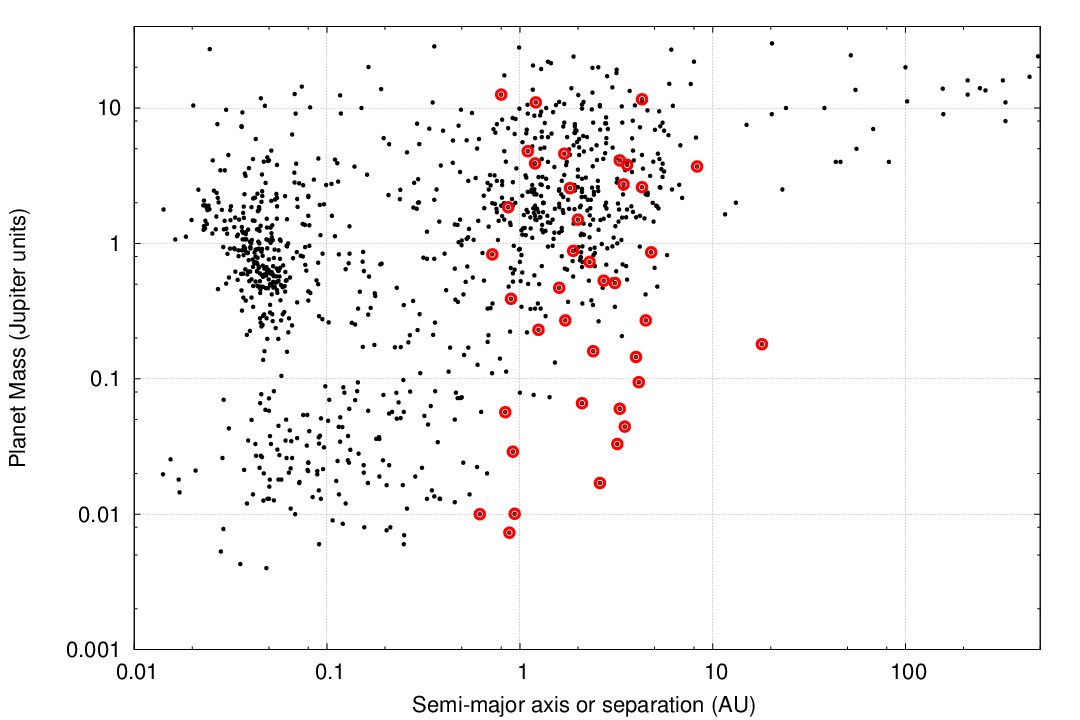
This is actually just a subset of all the exoplanets which have been detected via lensing. Some of the detections have not provided unambiguous values for the separation or mass.
In 2005, three big collaborations joined forces in order to collect very detailed measurements of a microlensing event which turned out to include a low-mass planet. Let's look at this in some detail. You can find a wealth of information at
The star is located in the direction of the bulge of the Milky Way -- hence the BLG part of its name. The Optical Gravititional Lens Experiment (OGLE) team had been monitoring this field for years. It lies in a "window" near the center of the galaxy, where the dust clouds are less dense than usual.
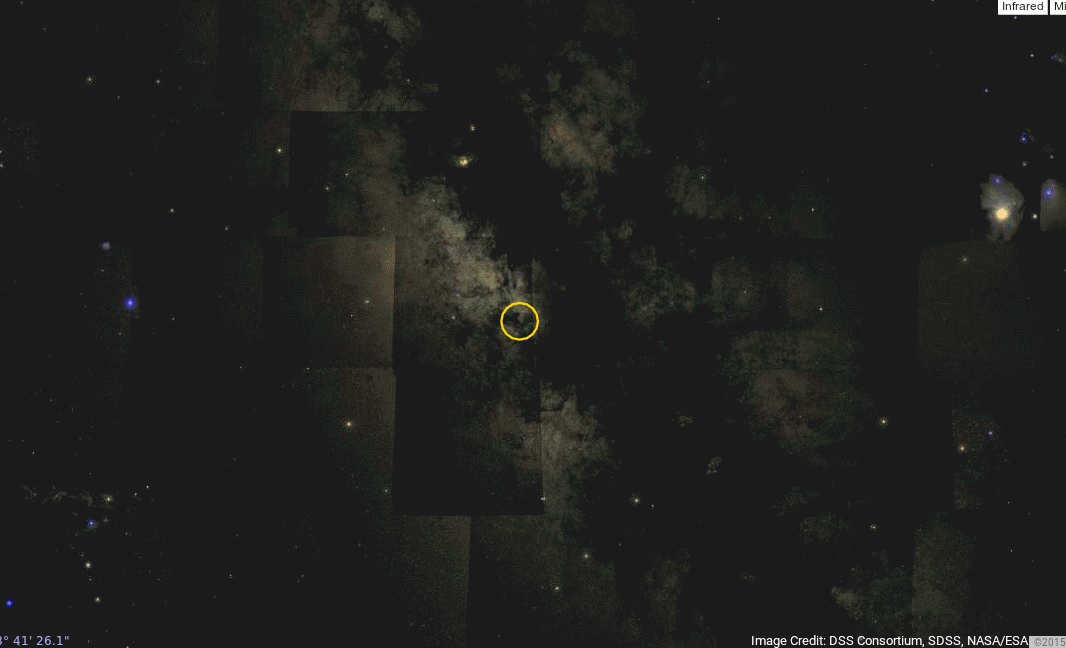
Image thanks to Google Sky
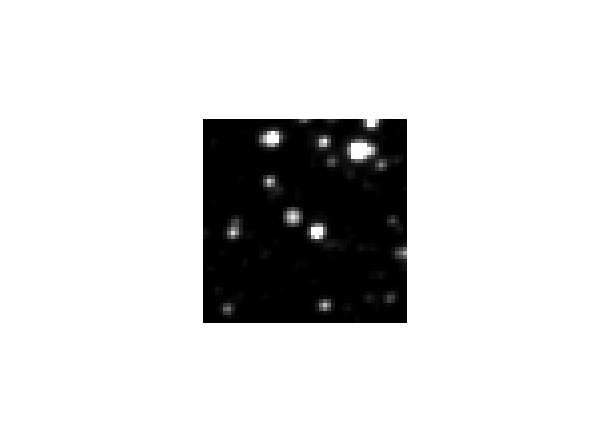
If we zoom into a region just 10x10 arcminutes on a side, we find, well, a LOT of stars. It's a good place to look for rare microlensing events, because one can see and monitor tens or hundreds of thousands of stars all at once.
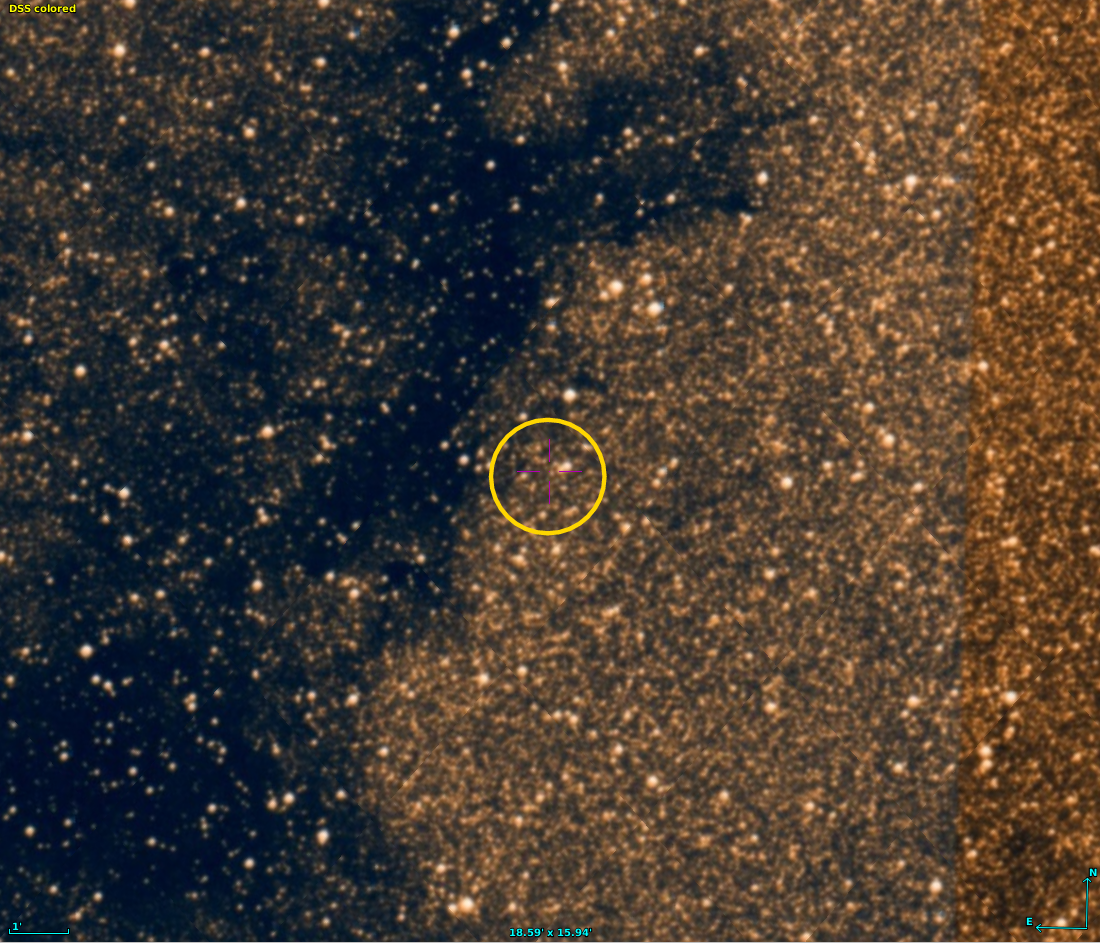
An even closer view shows the star itself clearly. It's nothing special.
Image courtesy of
the PLANET collaoration
But, early in the 2005 observing season, the OGLE team noticed that this non-descript little star was growing brighter and brighter, day after day. They sent out a message using their Early Warning System, alerting the other groups that a microlensing event was starting to take place.
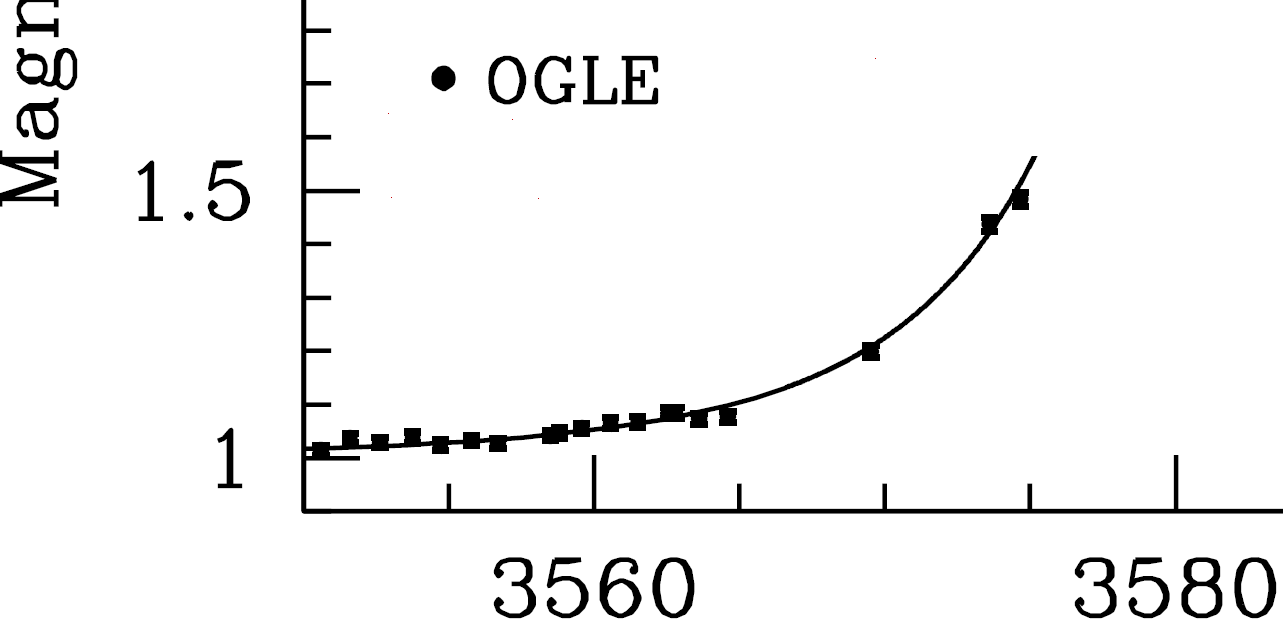
Image modified from original at
Discovery of OGLE 2005-BLG-390Lb, the first cool rocky/icy exoplanet
At this point, the other groups jumped into action. They, too, started pointing their telescopes at the field and making measurements every night, or several times a night.
Q: Why didn't we (here at RIT) join them?
The star reached a peak brightness of about 3 times its usual intensity, then started to fade. So far, it looked like a garden-variety microlensing event: a foreground lens star was passing in front of a background source star.
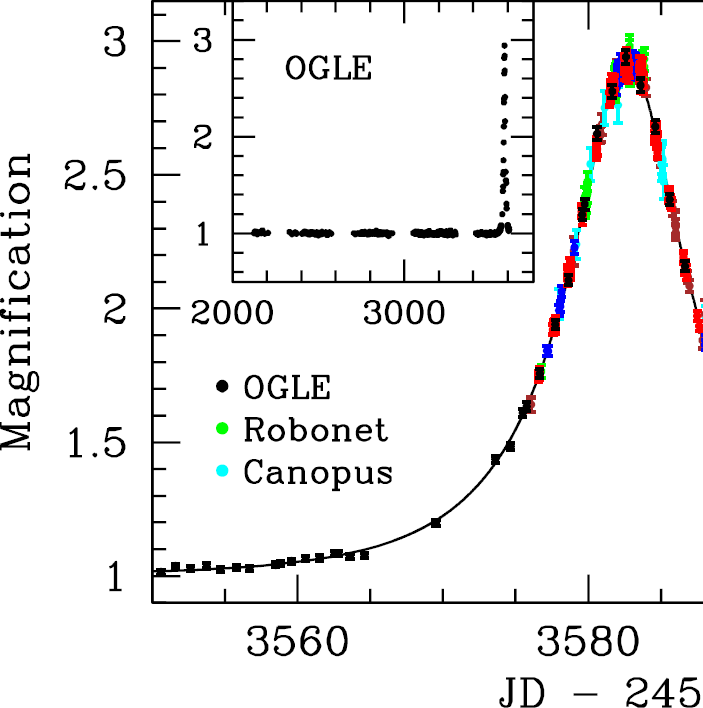
Image modified from original at
Discovery of OGLE 2005-BLG-390Lb, the first cool rocky/icy exoplanet
Let's watch a movie of the star, made some time after all the excitement was over. Click on the image to watch the movie play.
A-HA! Did you catch it? As it was fading back to its ordinary level, the star very briefly flashed out light.
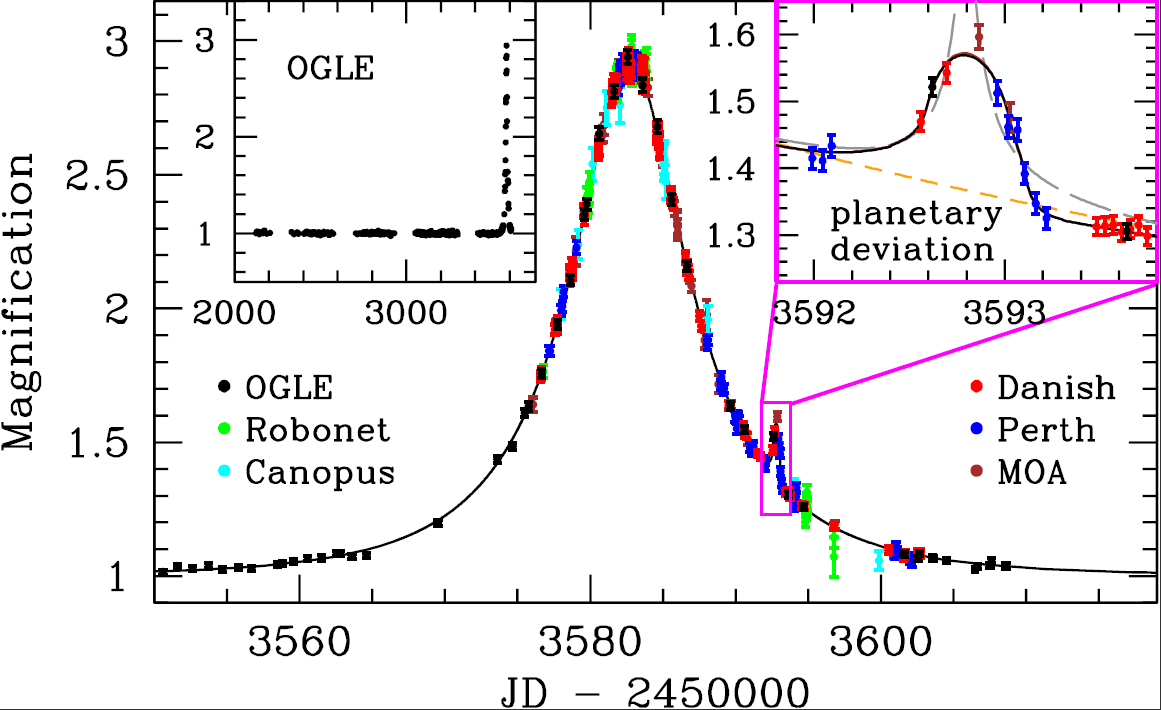
Image at
Discovery of OGLE 2005-BLG-390Lb, the first cool rocky/icy exoplanet
What happened was that there was a planet orbiting the lensing star, and as the source star drifted past the lensing star, it went directly behind a caustic of the star-planet lens. Click on the image to see a movie of the event.
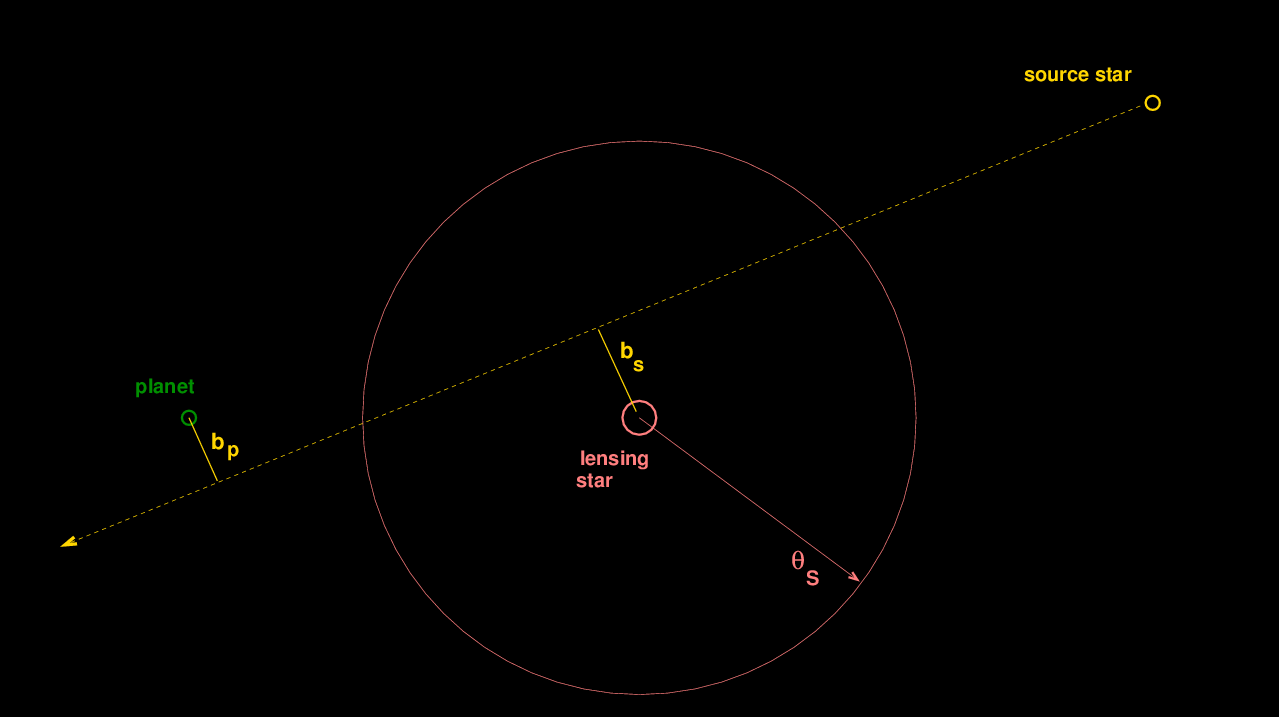
In this system, the star is roughly 13,000 times more
massive than the planet.
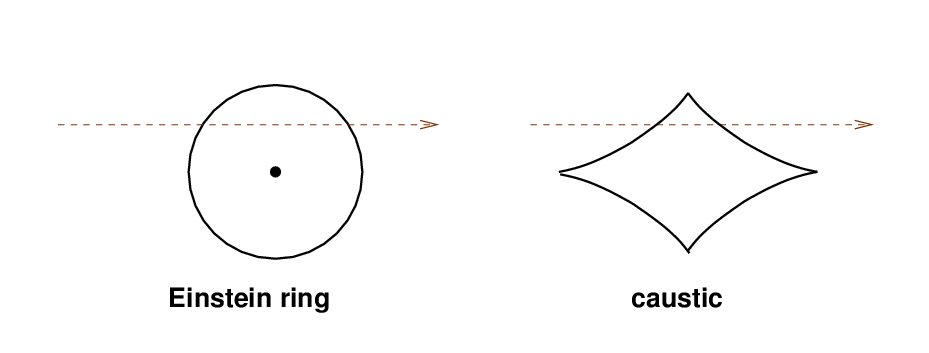
Q: What is the ratio of the Einstein-ring radius of the planet
to that of the star?
Q: Could you see the Einstein ring of the planet on this diagram?
Q: What is the impact parameter bs of the
background source, measured in terms of the STAR's
Einstein ring radius?
Q: Do you expect to see any significant lensing due to the
lensing star in this case?
Q: What is the impact parameter bp of the
background source, measured in terms of the PLANET's
Einstein ring radius?
Q: Do you expect to see any significant lensing due to the
lensing planet in this case?
What's a caustic? It's, uh, rather complicated mathematically to compute. The basic idea is that the interaction of the gravitational bending due to the lensing star, and the lensing planet nearby, produces a small region in which the lensing effect is very powerful.
For example, in the case of OGLE-BLG-390, Kubas et al., A&A 483, 317 (2008) have calculated that the caustic region looks like this:
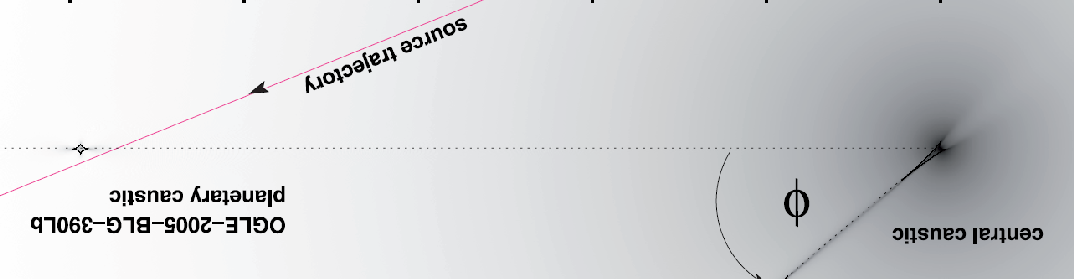
Image taken and mangled from
Kubas et al., A&A 483, 317 (2008)
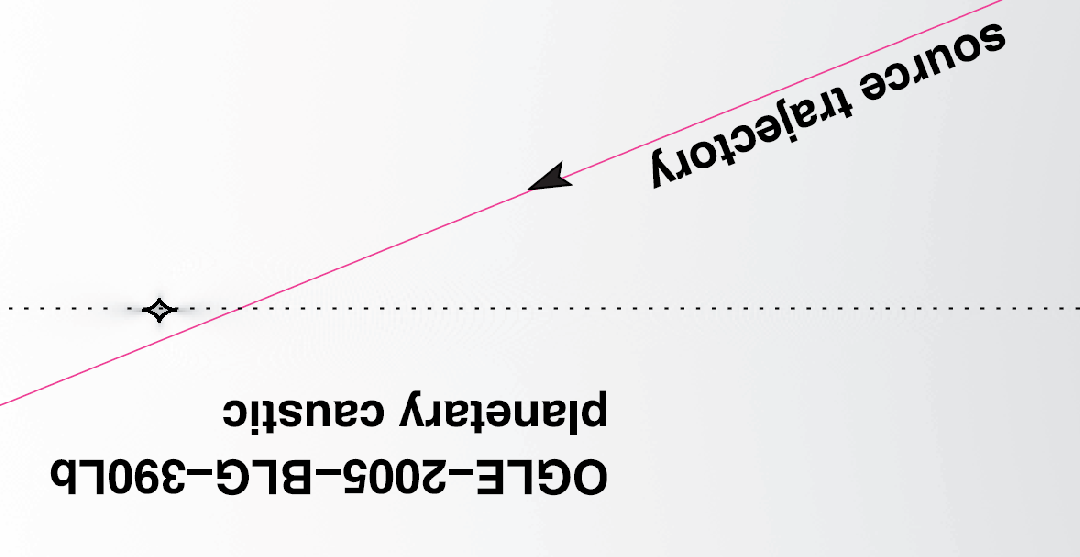
Image taken and mangled from
Kubas et al., A&A 483, 317 (2008)
That funny diamond-shaped region is the caustic. It lies directly on the line between the lensing star and the lensing planet; in this particular case, it happens to be roughly at the Einstein radius of the star, but that's a coincidence (I think).
Now, here's the important thing about caustics.
     Q:     Does this increase the chances of seeing an event due
            to the planet?
     Q:     Does this increase the chances of seeing an event due
            to the planet?
Okay, back to the case of OGLE-BLG-390. Let's watch the lensing effects in action in this nice movie made by Andrew Williams and David Bennett. Click on the picture to start the movie.
So, what did we learn in this case? It turns out that the planet's mass was much smaller than the star's mass. Gravitational lensing analysis doesn't directly yield the mass of either object, but it can tell us the ratio:
                                             -5
         mass(planet)            =   7.6 x 10      mass(star)


    Q:   The statistics of stellar populations in the bulge
             suggest that the lensing star is a red dwarf
             with mass of about 0.2 solar.


         What is the mass of the planet?
We don't know the distance to the lensing system, either, but an analysis of the relative motion of the lensing system to the background star, taking into account the typical galactic motions of objects in that direction, yields an estimate that D ~ 6 kpc.
Pretty good, huh? Detecting a planet not much more massive than the Earth, more than halfway to the center of the Milky Way ....
The experts have derived many other likely properties for the planet and its star. Take a look at Oodles of detailed information on the event OGLE 2005-BLG-390 and references therein for all the details.
Let's look again at the properties of all the planets which have been discovered by microlensing, now that we know a bit more about how the process works.
In 2004, An et al., ApJ 601, 845 (2004) noticed a small anomaly in the light curve of a microlensing event in the Andromeda Galaxy. They were monitoring M31 because it, like the center of the Milky Way, is a good place to find lots and lots of stars, all close together.
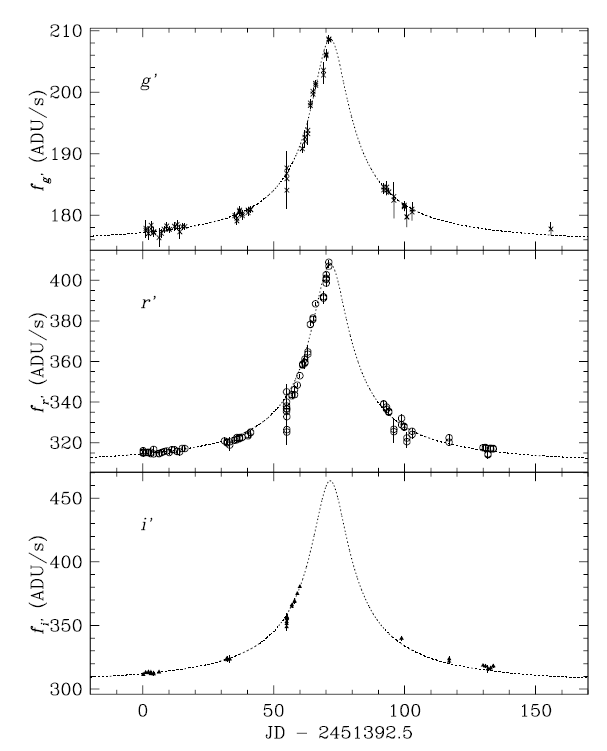
Figure 1 from
An et al., ApJ 601, 845 (2004)
Note the little "notch" near the start of the event. If you fit a simple point-lens model to the light curve and subtract it from the data, you are left with a residual which looks like this:
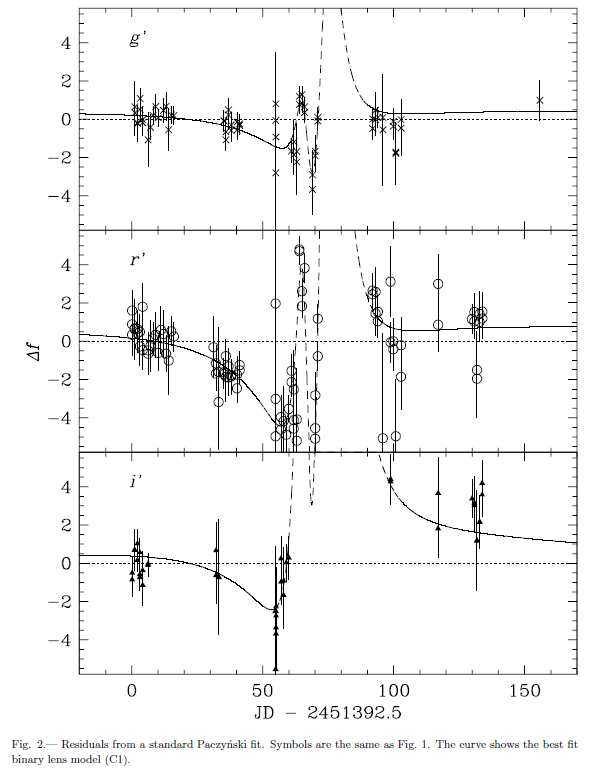
Figure 2 from
An et al., ApJ 601, 845 (2004)
If one fits a binary lens model -- star plus less-massive-object -- to the residuals, one finds that the second object must be considerably less massive than the first. It's all rather ambiguous, since we don't know WHERE the lensing system really is.
The ambiguity in distance leads to a large range of possible masses for the lensing star and the secondary lensing object. It is possible that the secondary object might be as little as 6 times the mass of Jupiter.
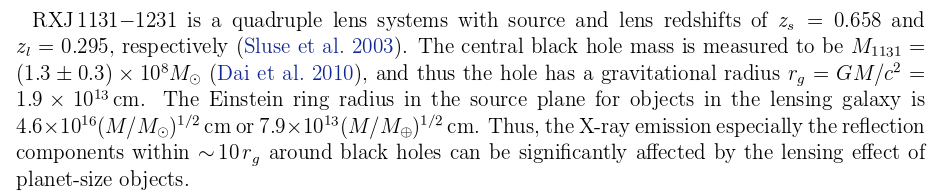
All the examples we've discussed so far have involved one, specific planet, lensing the light of one, specific star. But a recent paper by Dai and Guerras (ApJ 853, 27 (2018)) presents a very different situation: measurements of light from a distant galaxy which is being lensed by a population of billions of objects, stars and planets, in an intervening galaxy. In this case, we deduce from many, many fluctuations in the light of the background source some statistical properties of the lensing objects in the foreground galaxy ... and find out that some of those objects are probably planets.
How does this work? Well, it starts with X-ray observations of the light from an AGN in a distant galaxy, at z(source) = 0.658. This galaxy, called 1RXS J113155.4−123155 (or RXJ 1131-1231 for short), has a peculiar appearance in the optical:
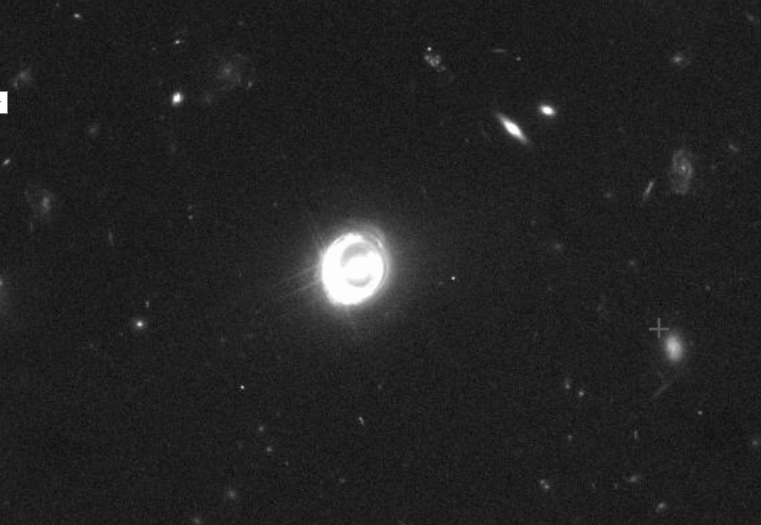
Image generated by the
Hubble Legacy Archive
If one modifies the contrast, one can see that there are four images of a background AGN, all the result of gravitational lensing by a foreground galaxy, which turns out to have redshift z(lens) = 0.295.
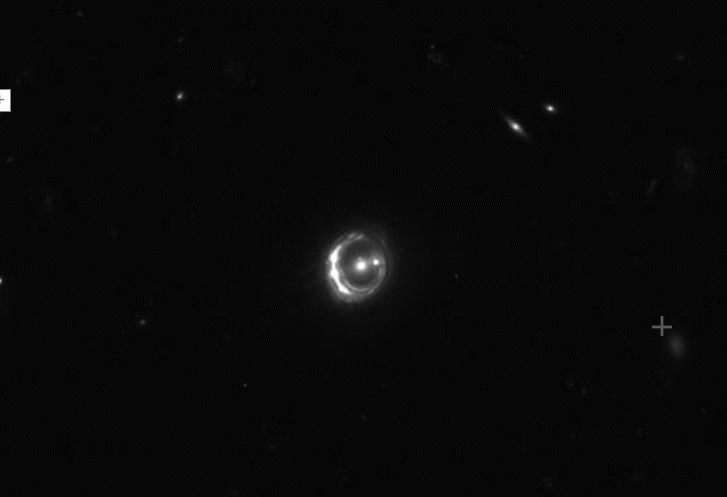
Image generated by the
Hubble Legacy Archive
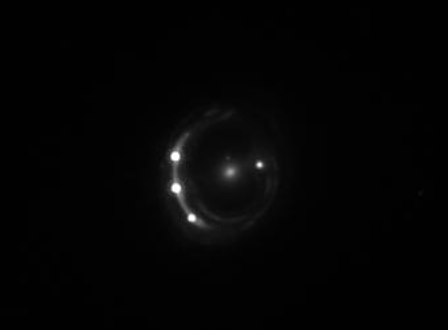
Image generated by the
Hubble Legacy Archive
Over time, the OPTICAL light of these four images has varied considerably. If you look closely, you can see evidence for lags between some of the images ...
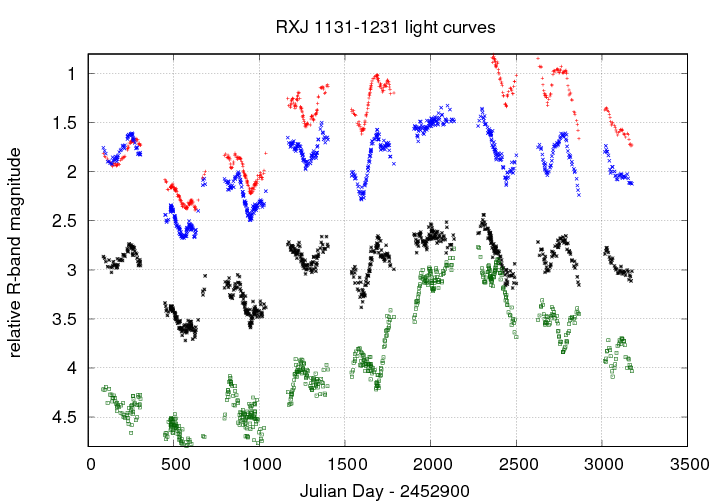
Data taken from
Vizier and Tewes et al., A&A 556, A22 (2013)
But that's not important for planets. The planet connection comes in the X-RAY light curves of these images. Even though Chandra doesn't have the same high angular resolution as HST, it can, to some extent, measure the brightness of each of the images in X-rays. In the figure below, the lags between the images (measured via the better-sampled optical curves) have been removed. Clearly, the brightness of the X-ray images also varies.
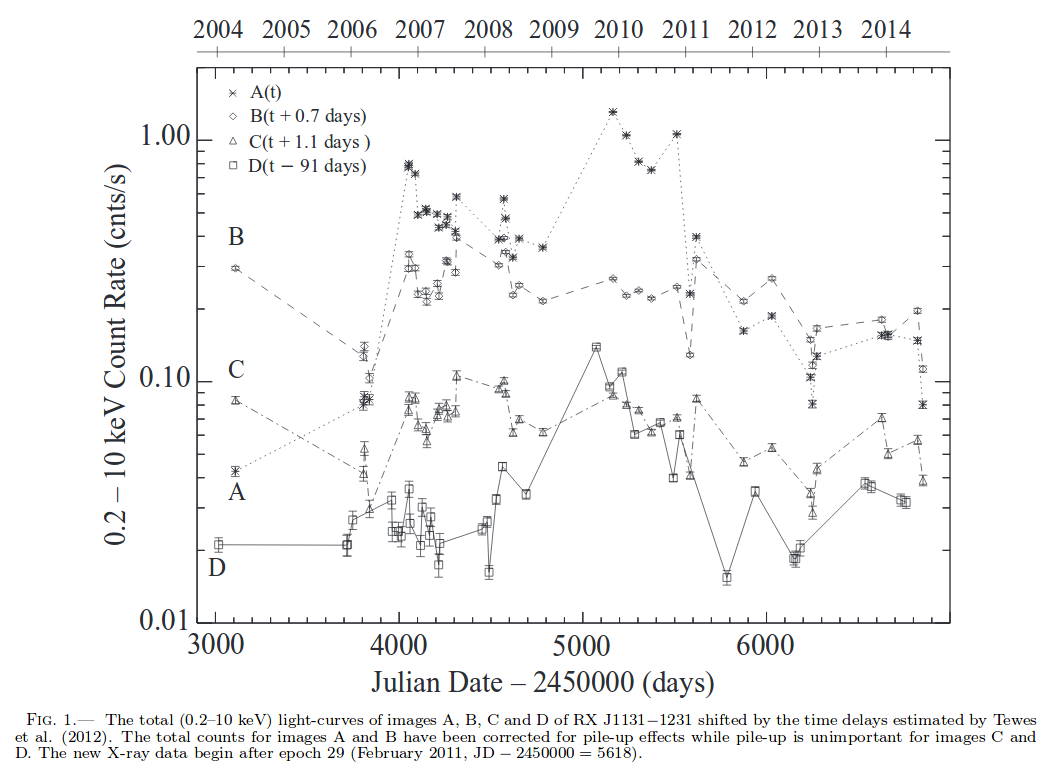
Figure 1 taken from
Chartas et al., ApJ 837, 26 (2017)
But more important for our purposes is the ENERGY of the X-ray emission. The figure below shows the spectrum of the X-rays measured from two of the four images, on two particular dates. We expect to see an emission line due to a transition in iron atoms, as an electron jumps down from the L-shell to the innermost K-shell; this "K-alpha" emission line has a rest energy of 6.4 keV. The spectra of this galaxy's images, however, can show one or two lines, with energies which are shifted somewhat above or below the rest energy.
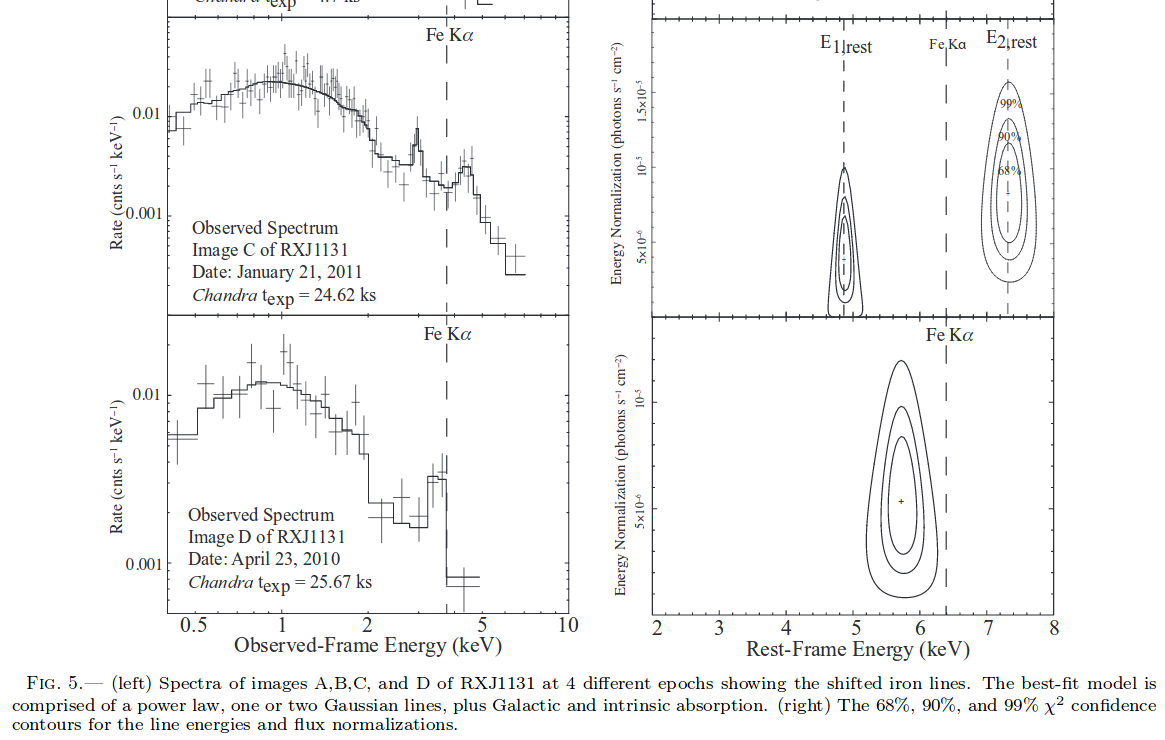
Figure 5 taken from
Chartas et al., ApJ 837, 26 (2017)
Why do we see two lines instead of one? Why does the line have a different energy? Most of the explanation lies in the geometry of the accretion disk around the supermassive black hole at the center of the source AGN. Gas circling the black hole moves at relativistic speeds, so, if the disk happens to be edge-on, we may see some gas coming towards us (shifted to higher energy), and some moving away from us (shifted to lower energy). In addition, as the X-rays travel across the accretion disk, past the black hole, their energies may be changed by the gravitational potential of the central mass. It's all rather complicated. The details depend on the exact geometry of the disk and our line of sight.
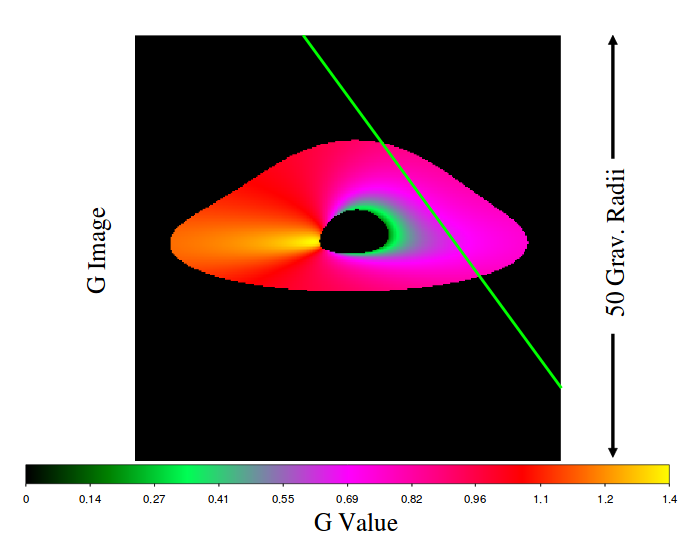
Figure 1 (left panel) taken from
Dai and Guerras, ApJ 853, 27 (2018)
However, since this geometry of the accretion disk is fixed and does not vary on timescales of a few years, if we observe a galaxy repeatedly in X-rays, we should see those lines at the same energies, time afte time. In the case of some AGN, that's exactly what happens. But in the case of 1RXS J113155.4−123155, the energies of the lines shift from epoch to epoch. Dai and Guerras, ApJ 853, 27 (2018) state that Chandra measured the X-rays of this object on 38 different occasions, and found 3-sigma shifts in the energies of the four images on 10, 13, 8, and 4 epochs, respectively.
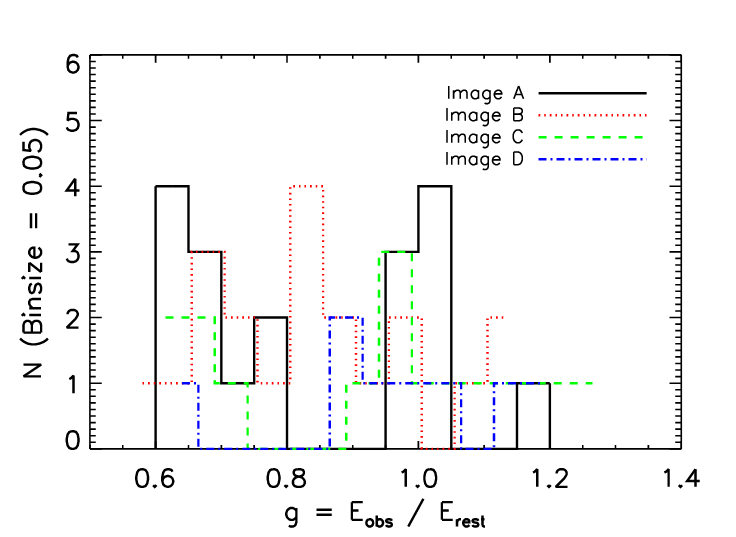
Figure 1 (right panel) taken from
Dai and Guerras, ApJ 853, 27 (2018)
So, what can cause the energy of the X-rays to shift from one day or week to the next? The authors suggest that the most likely explanation is gravitational microlensing by objects within the lensing galaxy. The basic idea is that if a low-mass object passes in front of the accretion disk, with an Einstein ring radius much smaller than the disk, only a portion of the disk will be magnified by lensing; and light from that magnified portion of the disk will have a different energy than the disk as a whole. In the figure below, the green line illustrates the path of a planet passing in front of the disk.
Figure 1 (left panel) taken from
Dai and Guerras, ApJ 853, 27 (2018)
   Q:  In this case, would the energy of the lensed X-rays
         be higher or lower than the average value?


   Q:  Overall, will random microlensing encounters produce
         shifts which yield higher energies, or lower energies?
         Why?
Why must (most of) the lensing objects be planets? Because the Einstein-ring radius of a star in the lensing galaxy will be so large that it will magnify the entire accretion disk at once, causing no significant change to the X-ray energy. But the Einstein-ring radius of a planetary-mass object is smaller than the accretion disk, allowing it to magnify only a portion of the disk.
Text taken from section 2 of
Dai and Guerras, ApJ 853, 27 (2018)
Note that since the light from each image traverses different regions of the lensing object, each image will be micro-lensed by a different group of objects; the shifts will be independent in each image.
When the authors ask "how many bodies in the lensing galaxy would it take to produce the observed frequency of microlensing?" they find an interesting result. The only way they can reproduce the observed frequency of line shifts is to add a large number of low-mass objects -- planets! In the figure below, the labels refer to the ratio of surface mass density due to planets relative to the total surface mass density in the lensing galaxy.
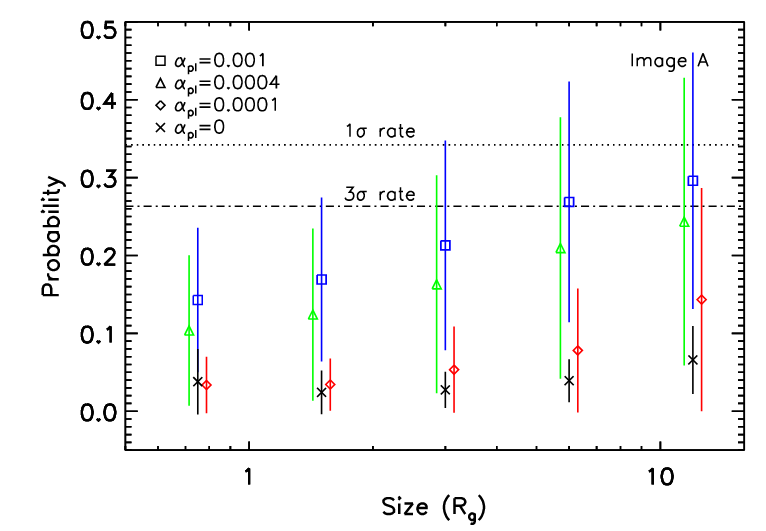
Figure 4 (top left panel) taken from
Dai and Guerras, ApJ 853, 27 (2018)
These values are roughly consistent with estimates of the planet-to-star mass ratio in the Milky Way, though of course the uncertainties in all these values are very large....
There are three big teams involved in the search for planets via microlensing:
Copyright © Michael Richmond.
This work is licensed under a Creative Commons License.