Image and movie courtesy of NASA's Jet Propulsion Laboratory
 Copyright © Michael Richmond.
This work is licensed under a Creative Commons License.
Contents
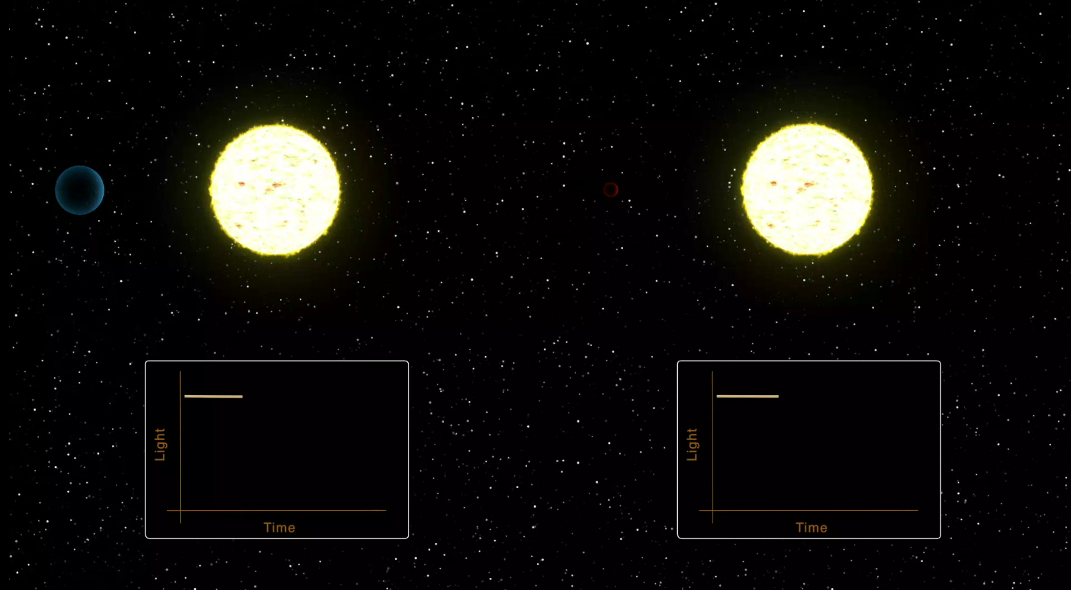
The most productive method for finding exoplanets is the one used by the Kepler spacecraft. It would stare at some spot in the sky for weeks on end, making measurement after measurement after measurement of the brightness of hundreds of thousands of stars. The great, great, great majority of those measurements showed ... nothing. Just the same brightness, over and over.
But every now and then, Kepler would detect a teeny-tiny little dip in the brightness of one star. These dips would last for just a few hours, and then the star would return to its usual intensity. (Click on image to play animation)

Image and movie courtesy of
NASA's Jet Propulsion Laboratory
The depth of the dip tells us about the size of the planet, relative to the size of its host star.
Astronomers call these events transits. You may have heard of the "Transit of Venus", which last occurred in 2012. Astronomers on Earth watched as Venus moved across the face of the Sun.
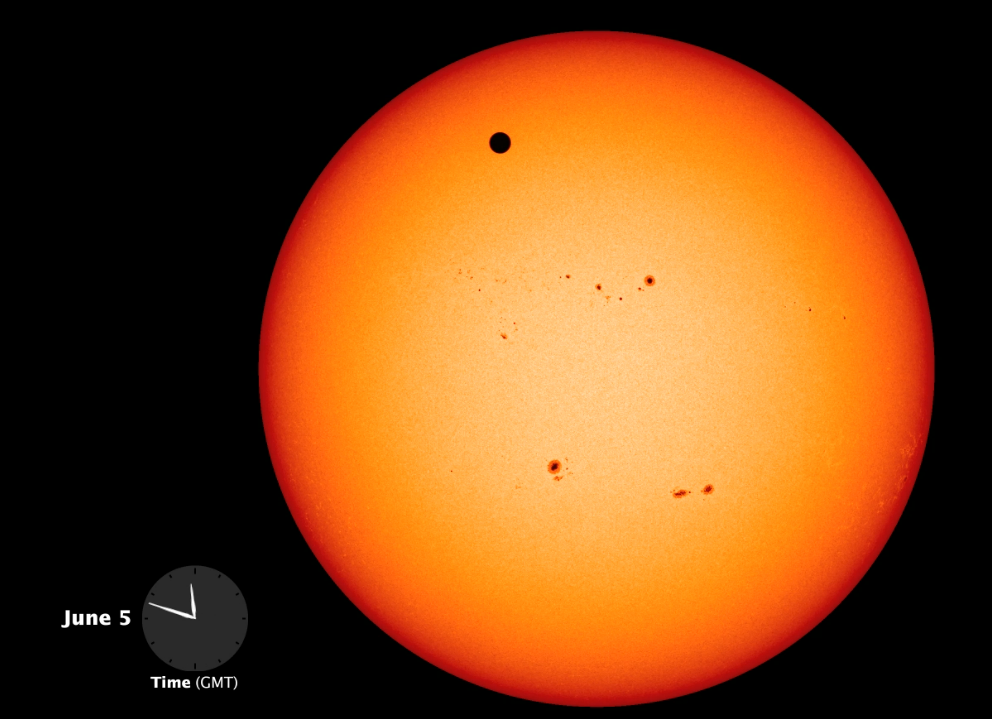
Image and movie courtesy of
NASA's Earth Observatory
  Q1:  What fraction of the Sun's light is blocked by Venus? (*) (radii)


       a) about 10      percent
       b) about  3      percent
       c) about  1      percent
       d) about  0.1    percent
(*)The answer depends a bit on who is looking. When we on the Earth look at this transit, Venus is much closer to us than the Sun, so it appears considerably larger in relative size, and blocks about 0.1 percent of the Sun's light. But if aliens in another stellar system were to observe the transit, they would see Venus at its proper size relative to the Sun; Venus would block only about 0.01 percent of the Sun's light from their point of view.
If we see a dip in the brightness of one particular star, and then, after five days, we see another dip, and five days later, another, and then another five days after THAT, we may reasonably conclude that there is a planet orbiting the star, and that the period of that planet's orbit is five days. The amount of light blocked as the planet passes in front of its star tells us the size of the planet, relative to the size of its star. So the transit method gives us quite a bit of information:
Thanks to telescopes such as Kepler and TESS, astronomers have found a LOT of exoplanets using the transit method. In fact, roughly 74 percent of all known exoplanets have been discovered in this way.
A great many of these transiting exoplanets turn out to have similar features: they are LARGE, roughly the size of Jupiter, the largest planet in our own solar system, and they circle around their host stars in very SMALL ORBITS.
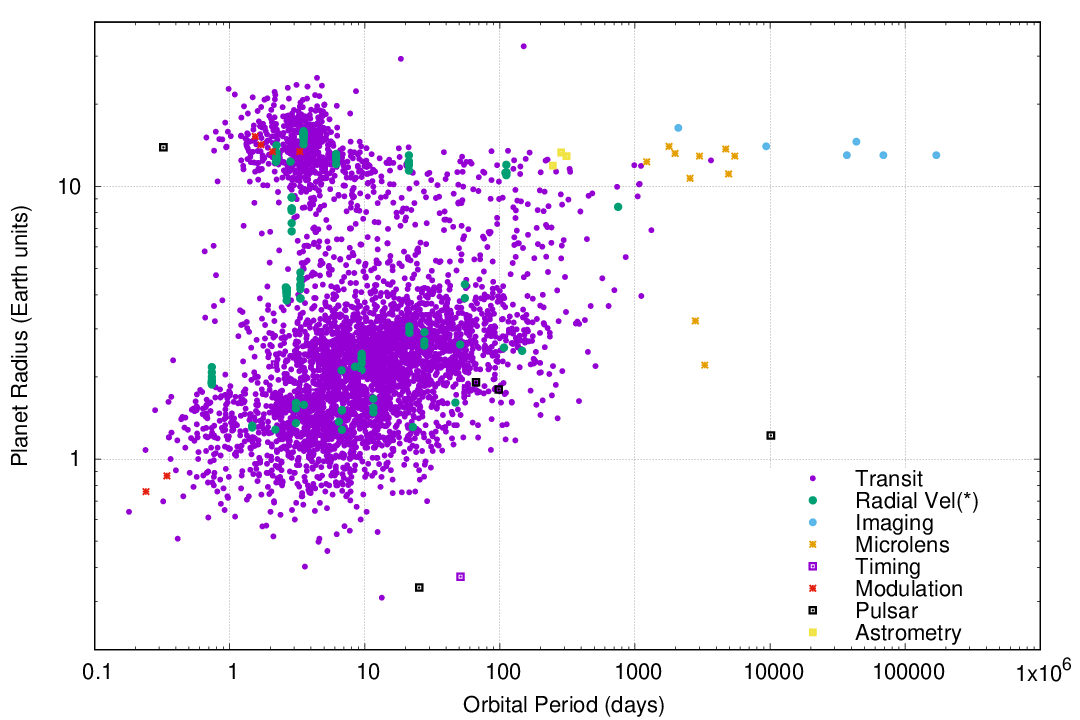
That's very strange: in our own solar system, the large planets all have very large orbits, which take decades or centuries to complete one revolution. Why do so many giant planets around other stars have such tiny orbits? The existence of hot Jupiters is indeed a puzzle that has occupied theorists for the past thirty years.
For details on the transit method, look for the
The second-most successful technique for finding exoplanets, which has produced about 19 percent of the total known so far, is based on the very, very careful measurement of features in stellar spectra. If we send the light from a star through a prism, it will break up into a rainbow; or, as astronomers call it, a spectrum.
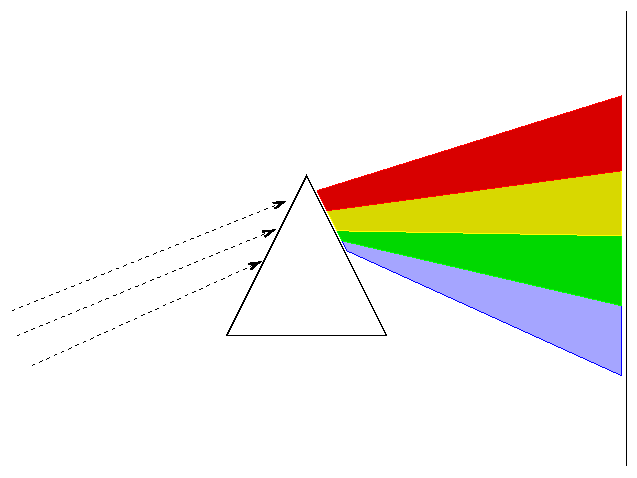
If we examine this spectrum carefully, we will see that a number of very thin, dark lines appear throughout the rainbow.

Spectrum of the Sun courtesy of
Fermilab Quarknet Center
These lines are caused by atoms in the outer layers of the Sun's atmosphere. The nuclear reactions in the center of the Sun produce light of all wavelengths, which flows outward into space; but as that light passes through the cooler gas in the outer atmosphere of the Sun, atoms absorb very specific wavelengths of that light. Each element absorbs a different set of wavelengths, allowing us to identify the chemical makeup of the solar atmosphere.
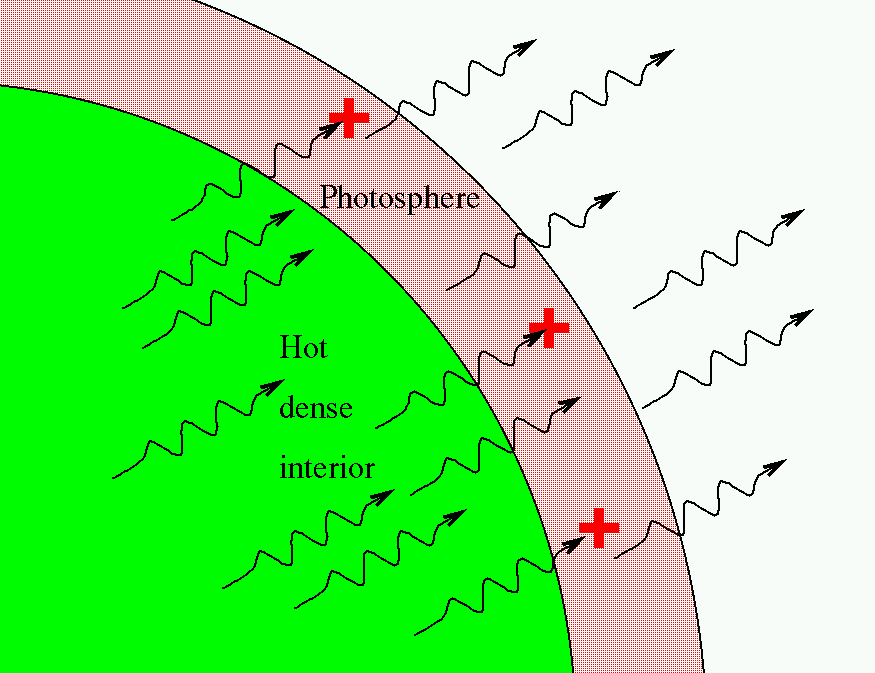
Now, it turns out that the wavelengths of these absorption lines will change if the star happens to be moving toward us or away from us, due to an effect known as the Doppler shift.
So, let's consider what happens if a planet happens to orbit around some particular star. Both the star and the planet will orbit around their common center of mass. Because the mass of a planet is small compared to the mass of a star, the center of mass will be very close to the star -- just as when a small child and her mother play on a seesaw, the child must be far from the fulcrum, and the mother must be close to it.
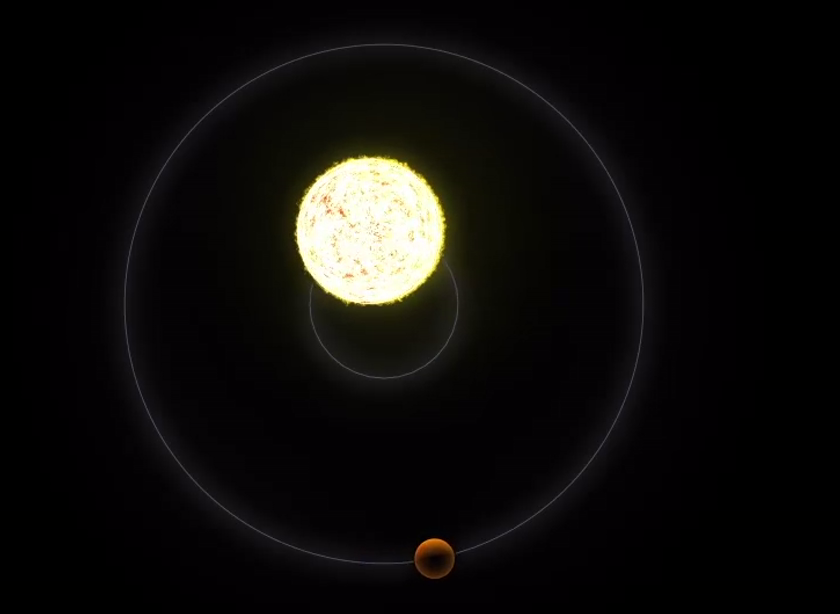
Image courtesy of
NASA Exoplanet Exploration
As the planet moves in a large orbit around this center of mass, the star will also move; its orbit will be smaller, and it will move more slowly -- but the star will move. And if the orbit happens to be edge-on from our point of view, that means that the star will comes toward the Earth, then move away from the Earth, then come toward us, then move away from us, in a periodic fashion. (Click on image to play animation)
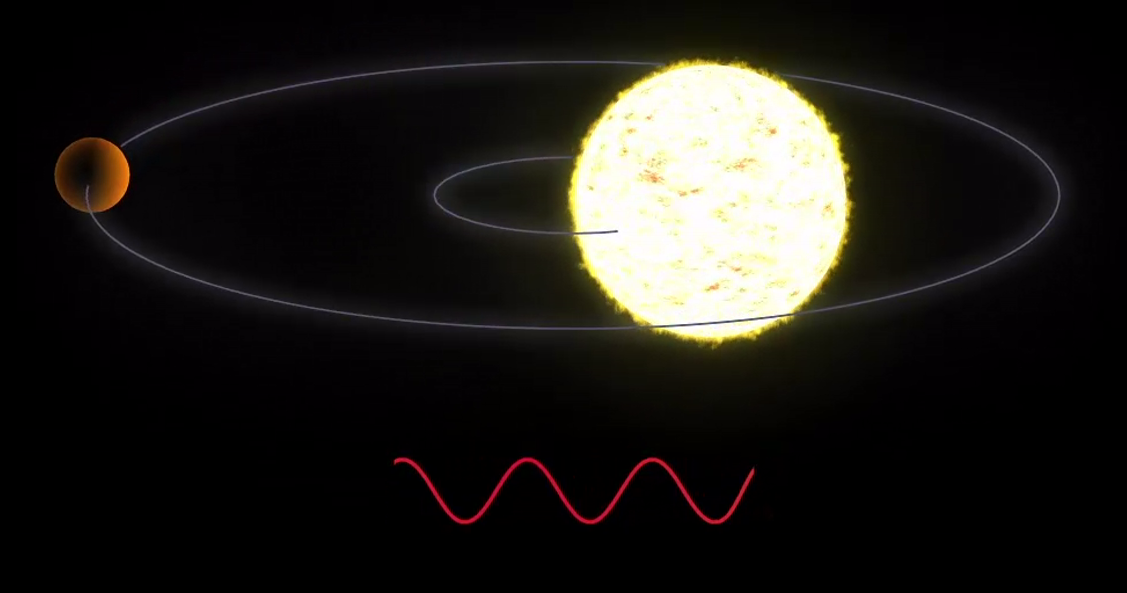
Image and movie courtesy of
NASA Exoplanet Exploration
And THAT means that if we can measure the positions of the line in the spectrum of this star, then we can deduce that it must be pulled in a circle by the gravity of some other object -- which might be an exoplanet!
Although this sounds pretty easy, it's actually very, very difficult. The trouble is that the motions of stars are very slow, because they are so massive that even the pull of a giant planet like Jupiter gives them only a tiny speed. Our Sun, for example, moves at only about 13 meters per second -- that's about 30 miles per hour -- due to the gravitational influence of all the planets in our solar system combined. The resulting Doppler shifts in the positions of its spectral lines are TINY. Trying to find low-mass planets like the Earth using this technique is almost (but not quite!) impossible.
The speed of the Earth in its orbit around the Earth-Sun center of mass is
VE = 30,000 m/s
The speed of the Sun in its orbit around the Earth-Sun center of mass
is related to the Earth's orbital speed by the ratio of masses:

As a result, if one looks at the properties of the planets found via the radial velocity technique, one will see that most of planets discovered this way tend to be massive:
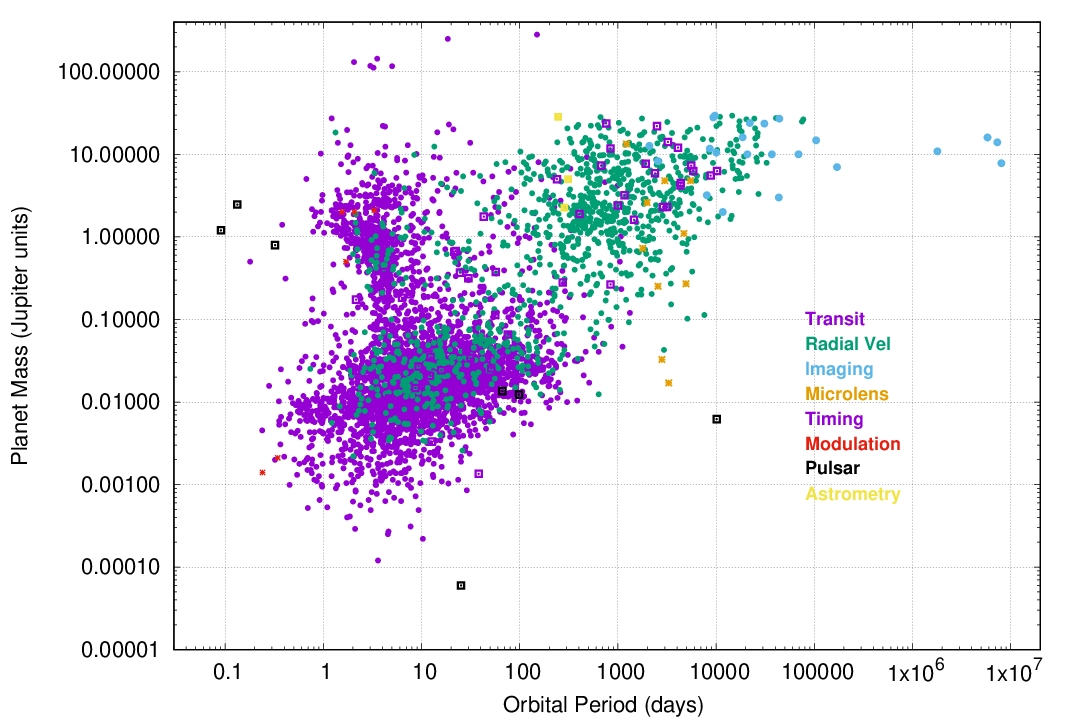
  Q:  Where would a planet similar to the Earth
         appear on this diagram?
For details on the radial velocity method, look for the
Stars are massive enough to warp the space around them slightly. Under ordinary circumstances, we don't notice the very slight distortions caused by this warping. However, if rays of light from a background star happen to pass VERY CLOSE to a star on their way to the Earth, those rays of light may be deflected significantly ... leading to some effects we can observe. We call this gravitational microlensing.
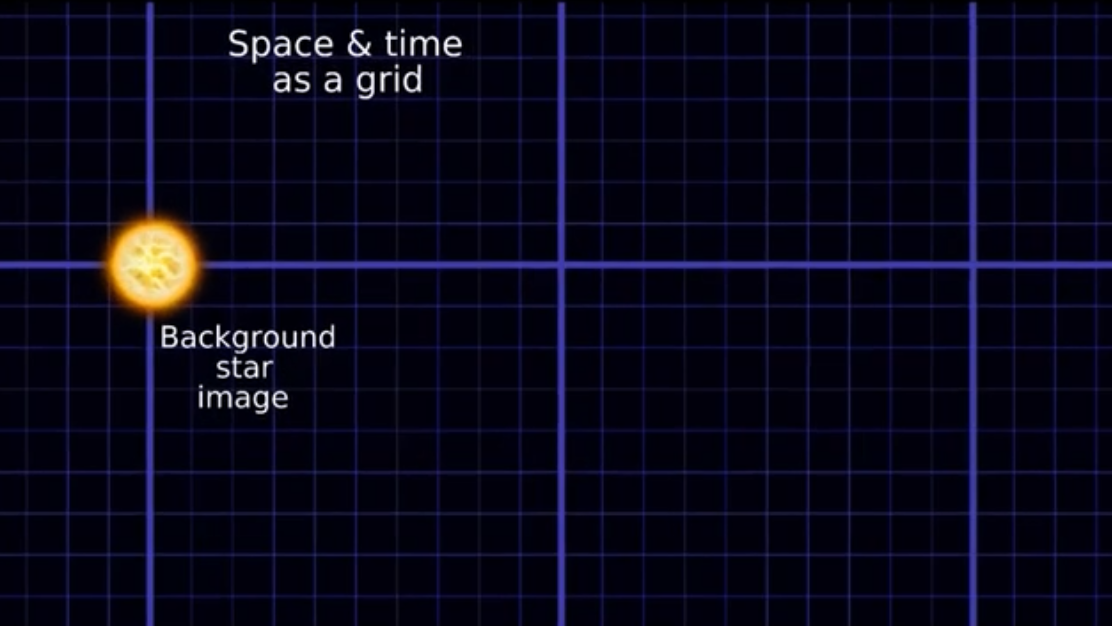
Image and movie courtesy of
David Specht / Eamonn Kerins / University of Manchester
One of the effects of this distortion is that the background star may appear LARGER when it passes behind the lensing object (in part because we see two images of it). It turns out that the surface brightness of the background star is preserved, so that the larger area of the (two) lensed images causes us to be a BRIGHTER background object.
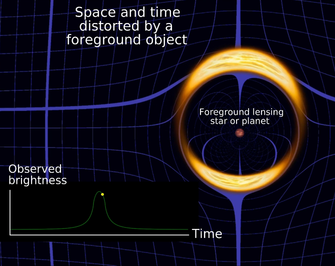
If astronomers monitor a star over and over and over again, measuring its brightness precisely, then they may notice a sharp increase in the light of a star, followed by an equally sharp decrease. This very symmetric light curve is a sign that the star has been lensed by some other object passing between it and the Earth. The shape of this microlensing light curve (see the panel at right below) is very distinctive.
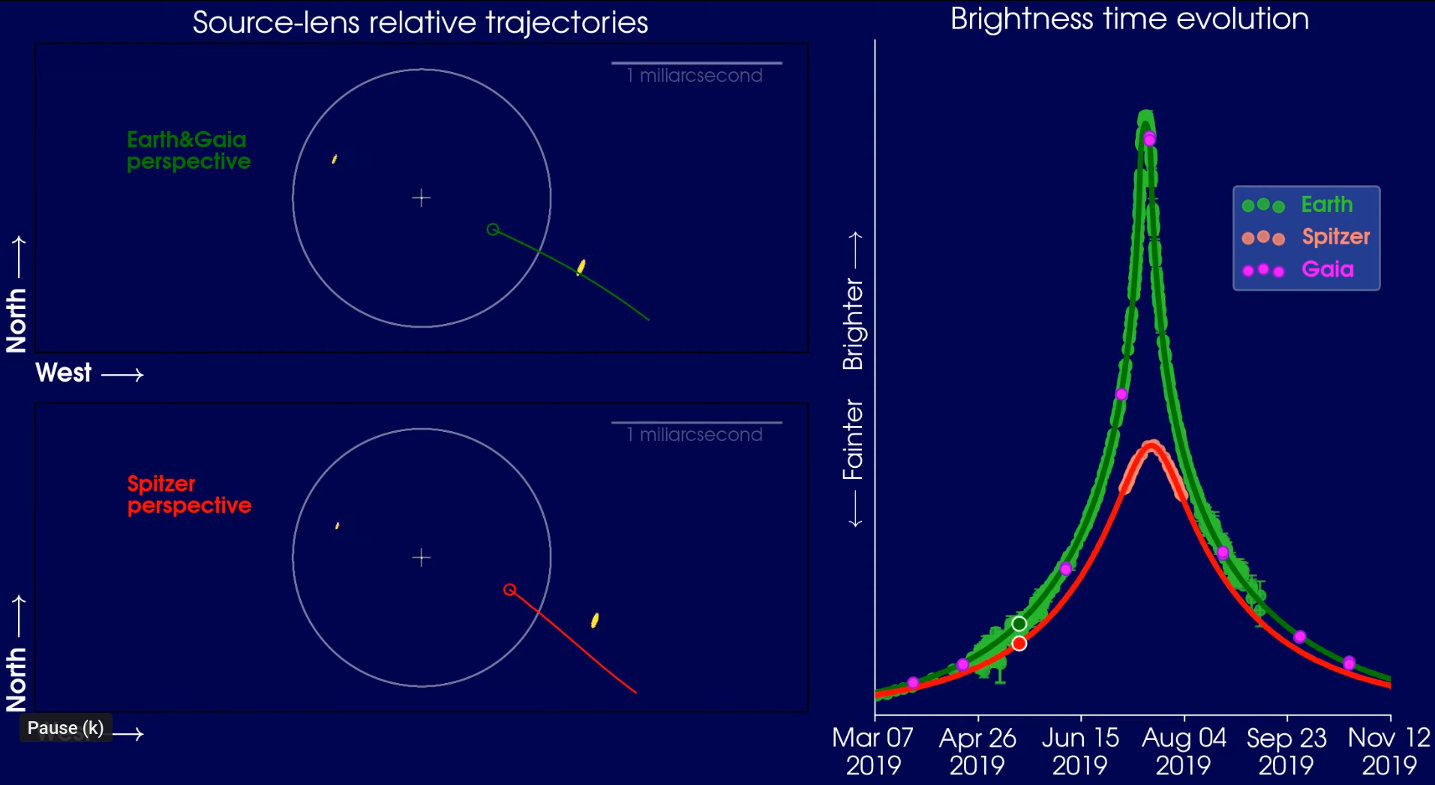
Image and animation courtesy of
Las Cumbres Observatory
What does all this have to do with exoplanets? Well,
(click on the image below to watch a video)
THEN the gravitational effect of the PLANET may cause a small distortion of the symmetric light curve.
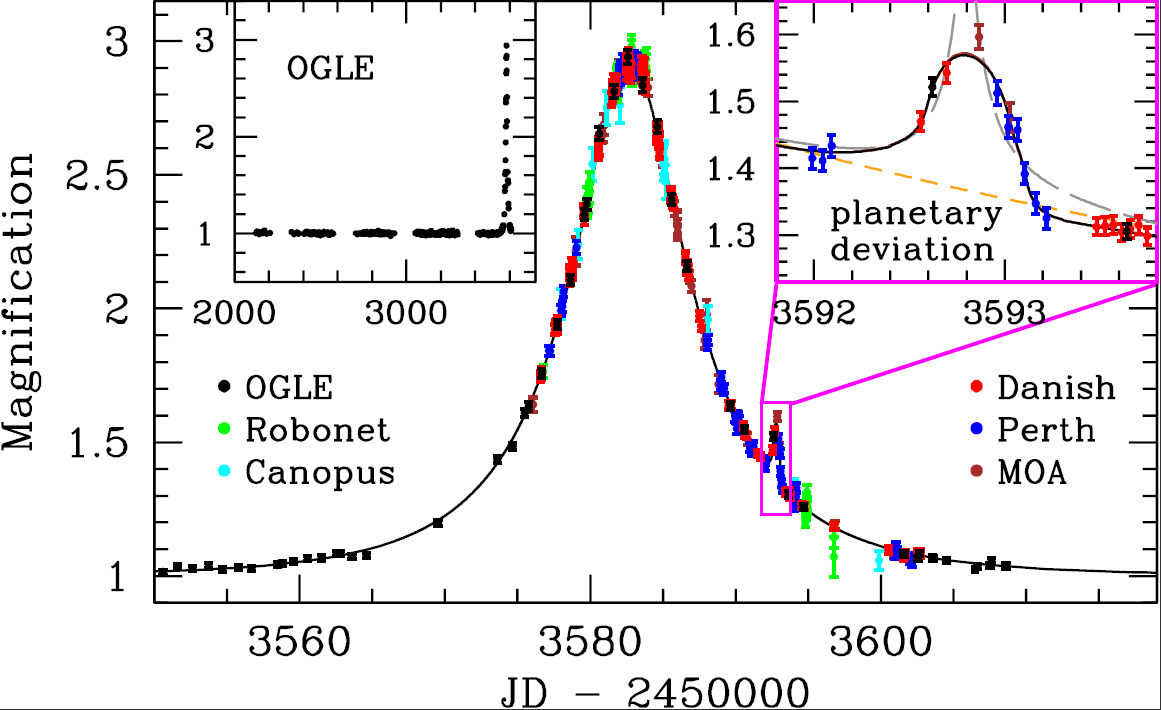
Image courtesy of
Martin Dominik and the ESO
Now, this technique of finding exoplanets has some GOOD points and some BAD points.
| Good | Bad |
| Can detect very low-mass planets | No chance for followup |
| Can determine distance to lens ... | ... if observed simultaneously from two sites |
| Is "free" with any wide-field photometry survey ... | ... but requires quick analysis to detect in time |
For details on the microlensing method, look for the
"Why do astronomers go through all these complicated strategies?" one might wonder. "Why not just take a picture of a star and look for planets around it?"
That would be simpler, but there's a problem. Two problems, really.
Let's do a quick estimate of how much fainter an exoplanet would be than the star it circles. Consider the following situation:
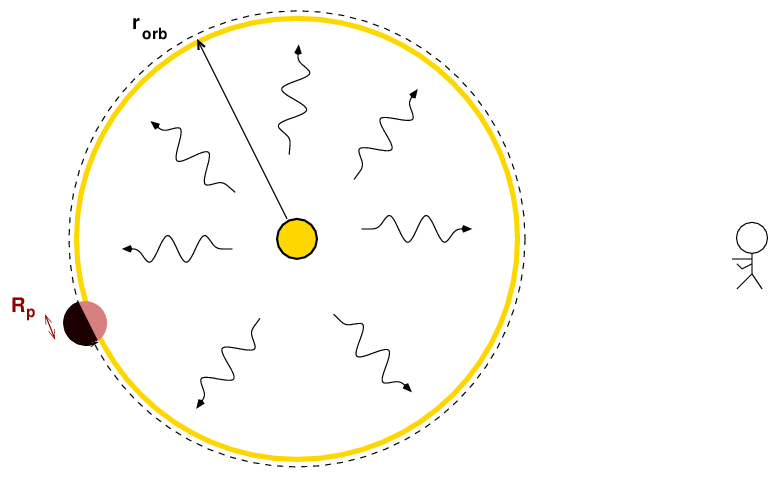
Note that the planet reflects light from the star. So, let's begin by determining the flux of light from the star which reaches the planet. If we call the star's luminosity L*,

How much of this light is reflected? The flux striking the planet depends on the cross-section area of the planet, of course. Let's define the albedo α as the fraction of the incident light which bounces off the planet back into space. Then

  Q:  Can you write an equation for the ratio of the
      luminosity of the planet to the luminosity of the star?
Good.
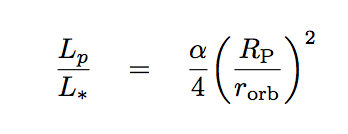
Okay, let's try putting some numbers into this equation. Let's assume that the albedo is α = 0.5.
       For the following three situations, compute the ratio
       of brightness of planet to star.


      Case               Rp           Rorb             ratio of
                        (m)           (m)              intensity
   -------------------------------------------------------------------

     real Jupiter    7.15 x 10⁷     7.78 x 10¹¹


     real Earth      6.37 x 10⁶     1.50 x 10¹¹


     hot Jupiter     7.15 x 10⁷     6.00 x 10⁹


   ---------------------------------------------------------------------
The angular separation between the host star and the exoplanet, θ, depends on the exoplanet's orbital radius rorb and the distance d to the system. If we express the orbital radius in AU and the distance in parsecs, it's very easy to compute the angular separation in arcseconds.

Let's see just how large the separation might be for an exoplanet around a nearby star at a distance of just d = 10 pc. The separations will be smaller for more distant systems, of course.
      Case           distance    Rorb         separation
                       (pc)      (AU)           (arcsec)
   -------------------------------------------------------

     real Jupiter      10         5.2


     real Earth        10         1.0


     hot Jupiter       10         0.04


   ---------------------------------------------------------------------
We can now compare those numbers to the performance of one of the best telescopes in the world (or in space), HST. The graph below shows the point-spread-function (PSF) of HST when operating in the optical or near-UV.
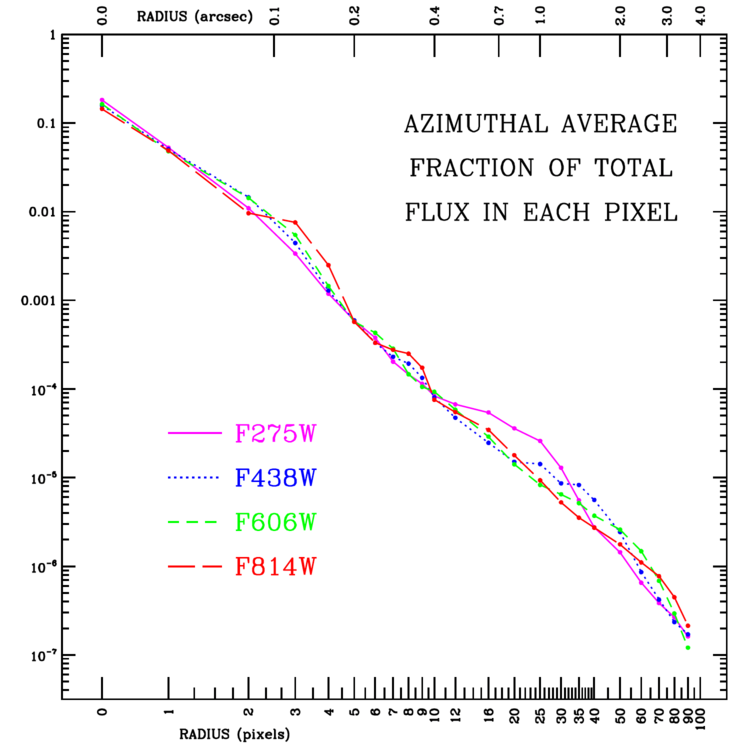
Figure 6.14 taken from the
HST WFC Instrument Handbook
The bottom line is that it's almost impossible to take a picture which shows the light from an exoplanet, clearly separated from the light of its host. The best we can do is to find the biggest exoplanets, located rather far from their hosts. Here's one recent example, showing a planet roughly three times larger than Jupiter, orbiting its host at about 8 AU.
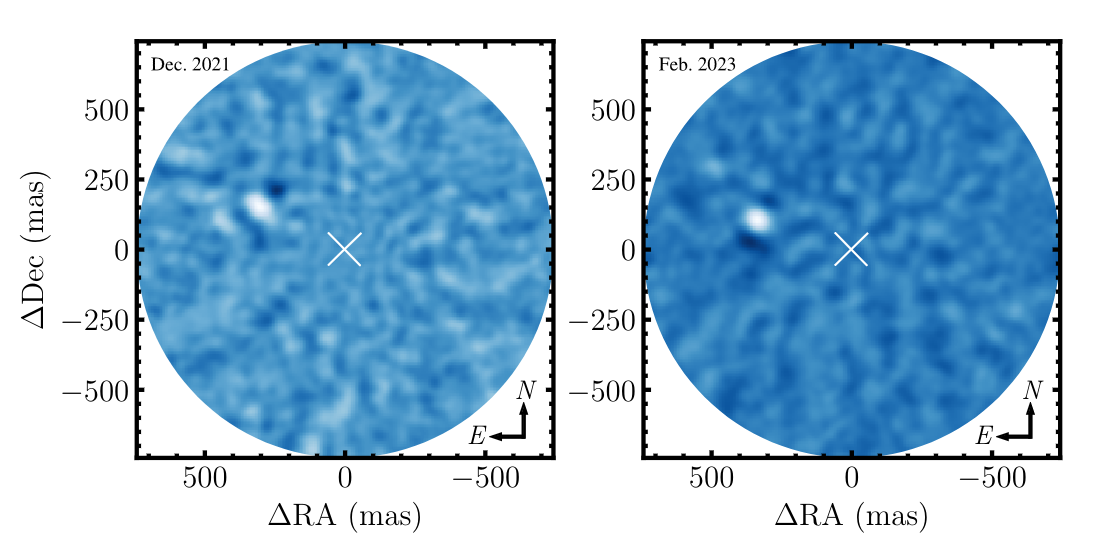
Figure 1, cropped a bit,
taken from
Franson, K., et al., ApJ, 950, 19 (2023)
For details on the direct imaging method, look for the
I've listed above the methods which are most commonly used to find exoplanets. But astronomers have devised other techniques for finding exoplanets, such as
Since these techniques have produced only a small fraction of all the exoplanets discovered so far (about 1 percent), I won't discuss them here. But please do visit my office if you'd like to talk about these methods.
One of the best resources for exoplanet researchers is the NASA Exoplanet Archive. We can use it to investigate many properties of the
A very good place to start is the overview provided by NASA at the Exoplanet and Candidate Statistics page:
Please take out an Internet browsing device, and follow along as we take a little trip. Pay careful attention: you'll have to answer some questions as we go.
If you set your browser to Planetary Systems Composite Data you should be taken to an interactive table that looks something like this:
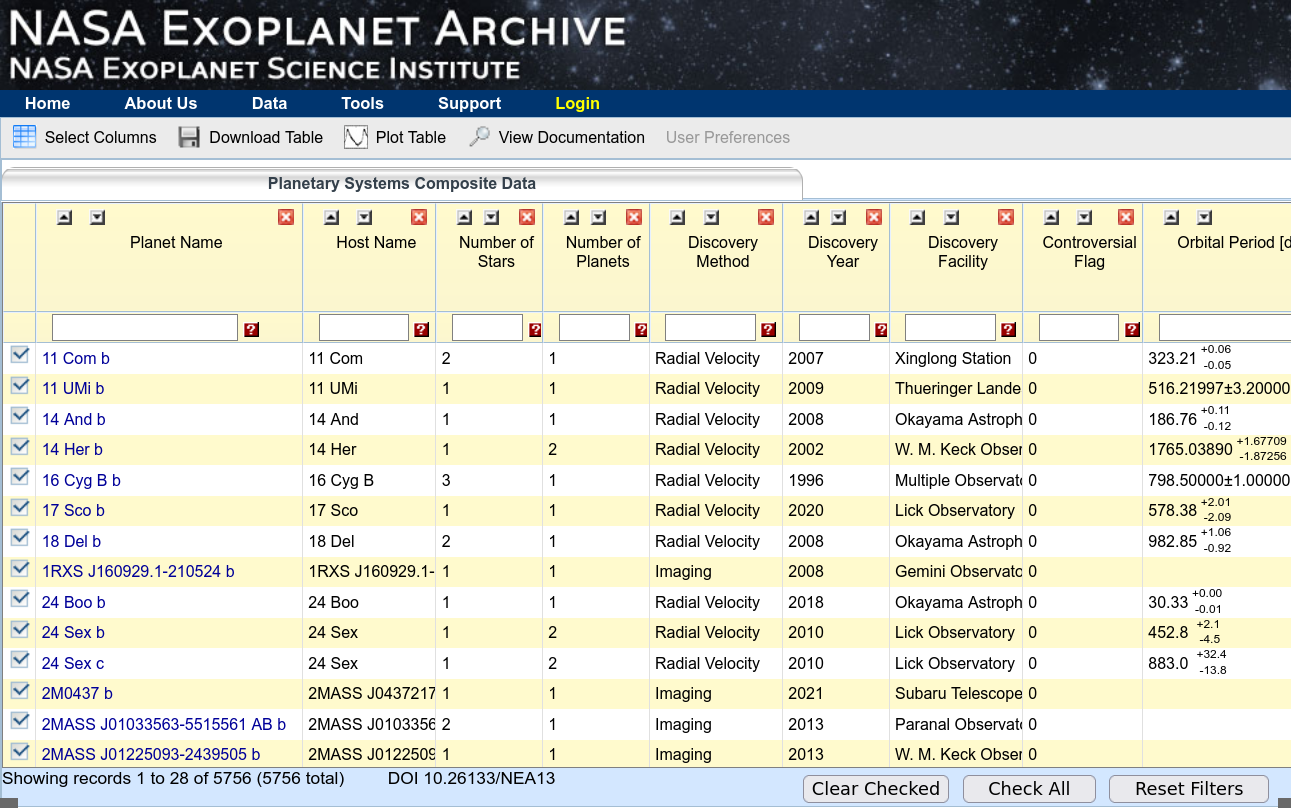
This table is interactive -- you can modify its contents by typing and clicking on various items. For example, we can select only the exoplanets which satisfy a certain numerical criterion by typing text into the boxes near the top of each column.
For example, I can choose only those exoplanets with measured periods by typing "> 0" into the box for "Orbital Period", like so:
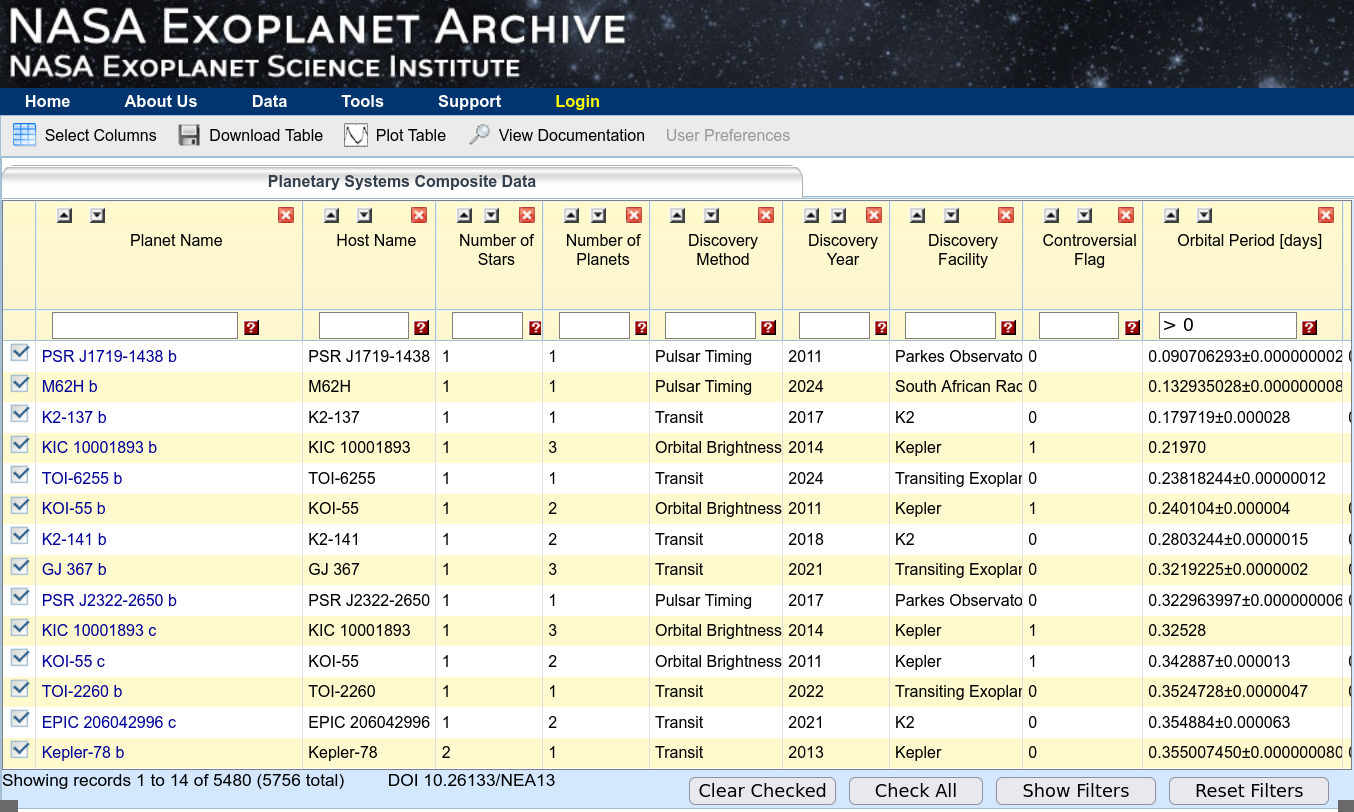
Please use this method to answer the following questions:
   Q3:    a) How many planets have a measured period?

          b) How many planets have a measured mass?
                (Look for "Mass" in the "Planet Mass or Mass*sin(i) Provenance" column)

          c) How many planets have a measured radius?
                (First, use "Select Columns" to add "Planet Radius Reference",
                 then place "not like calculated" into that column)

          d) How many planets have a measured semi-major axis?
Hmmmmm. It seems that some properties of planets are EASY to measure, but others are DIFFICULT. We will discuss some of the reasons for this over the next seven weeks -- but can you guess some of the reasons for these particular properties?
The first thing we see when we visit the page is that of the 4326 (as of Sep 18, 2024) confirmed exoplanets, the very great majority were found by the transit technique (or one of its variants):
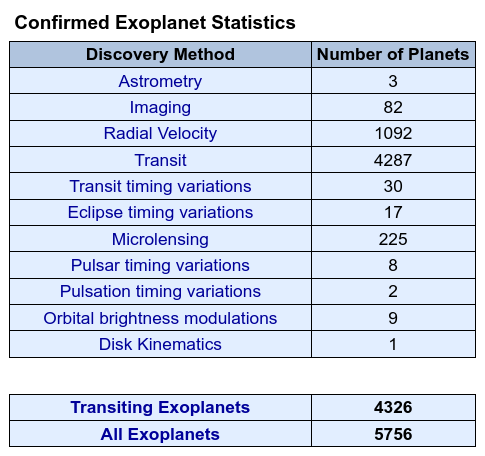
   Q4:   Why do you think that the transit method has produced
             such a large fraction -- 75% -- of the total?
             Provide any good reason.
Of the remainder, the bulk were discovered using radial velocity measurements: 19%, to be precise.
That leaves just a small amount, about 6%, for all the other techniques combined. That is one reason that we will spend more time on the transit and radial velocity techniques than on the others.
Okay, let's focus for a moment on the exoplanets found via the radial velocity method. Go to the Planetary Systems Composite Data table and type "Radial Velocity" into the "Discovery Method" column.
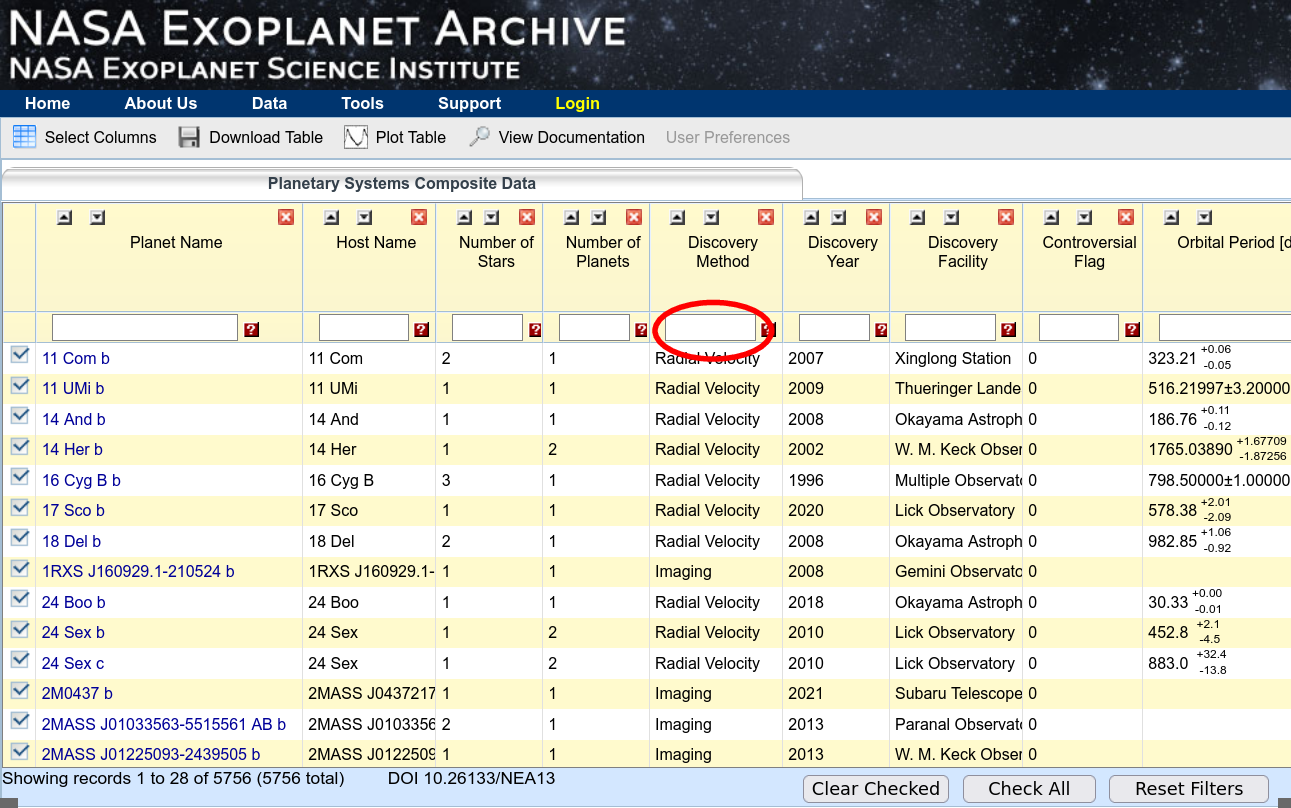
This will create an interactive table containing only exoplanets which were discovered by the radial velocity method.
Let's look at two particular entries in this table:
   Q5:    Look at the periods of these two exoplanets.  Which one
          has been measured more precisely?


   Q6:    Explain why one of them has a much less precise period.
So far, we can see that this table provides lots of useful information -- just like any ordinary table. But NASA has done a very nice job in making the table an interface into a very rich database. If you click on any planet's name, you will be taken to a new page, full of detailed information on the object -- including lots of references.
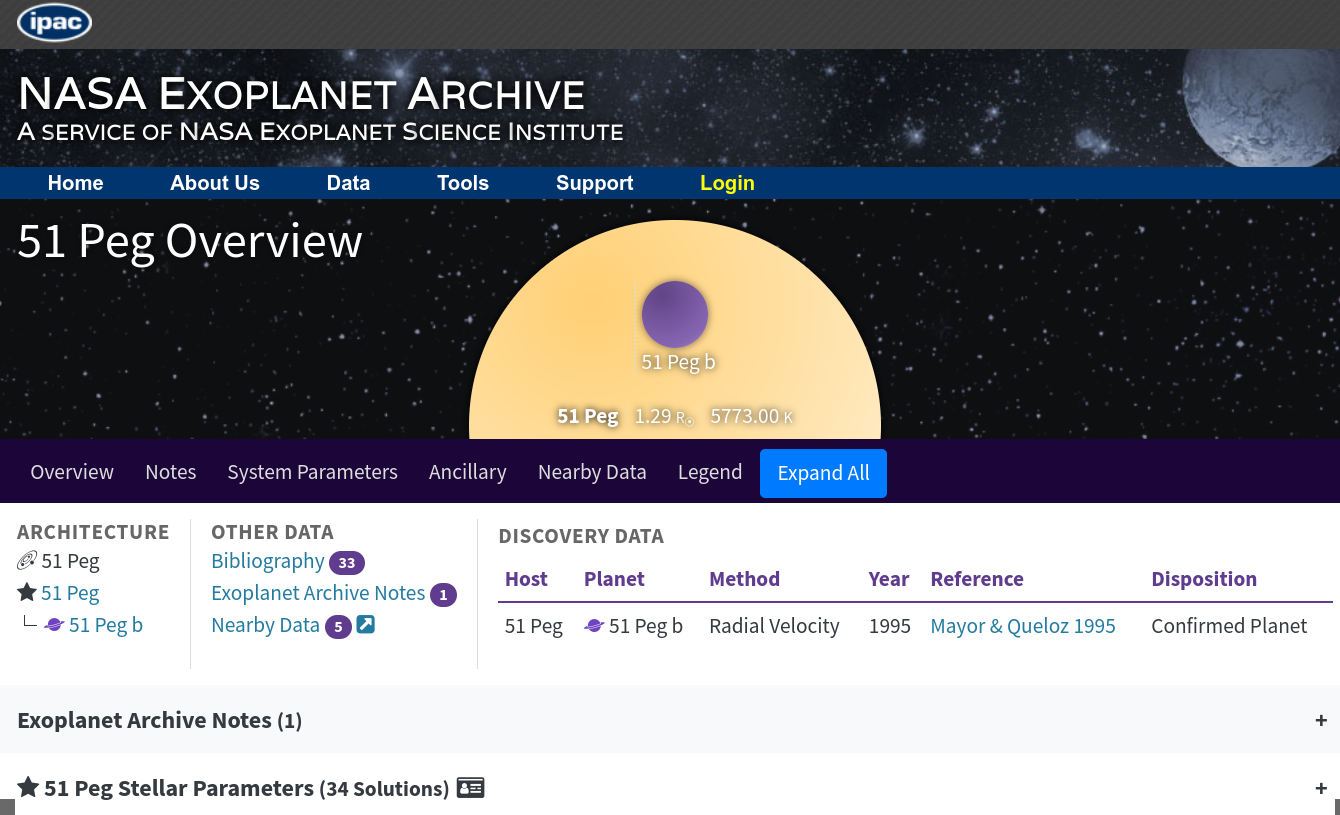
Included on this page are links to the journal articles which describe the object's discovery, and some subsequent observations as well.
Q7: What instrument did Naef et al. (2004) use to measure 51 Peg b?
Sometimes, there are even copies of the measurements themselves. Scroll down to the bottom of this page, and look for radial-velocity measurements made by Marcy et al. 1997.
  HW 1:   Make a graph showing the radial velocity of the
          host star, 51 Peg, as a function of time,
          over the period 2450000 to 2450040, using data
          from the Hamilton-Lick collection.


          _Approximately_  how big are the variations in velocity?


          _Approximately_  what is the period of the variations?
Let's try a different discovering technique: imaging, which simply means "taking a picture and seeing a tiny little dot of light next to the host star."
Go back to the Planetary Systems Composite Data table and select items discovered by the Imaging technique. It's relatively small, so you should be able to examine all the entries in short time.
     Q:   Note that most of the exoplanets in this table have
              either no measured period, or a very large
              uncertainty in the period.

          Why?
Let's pick one of these objects in particular: the exoplanet called 51 Eri b.
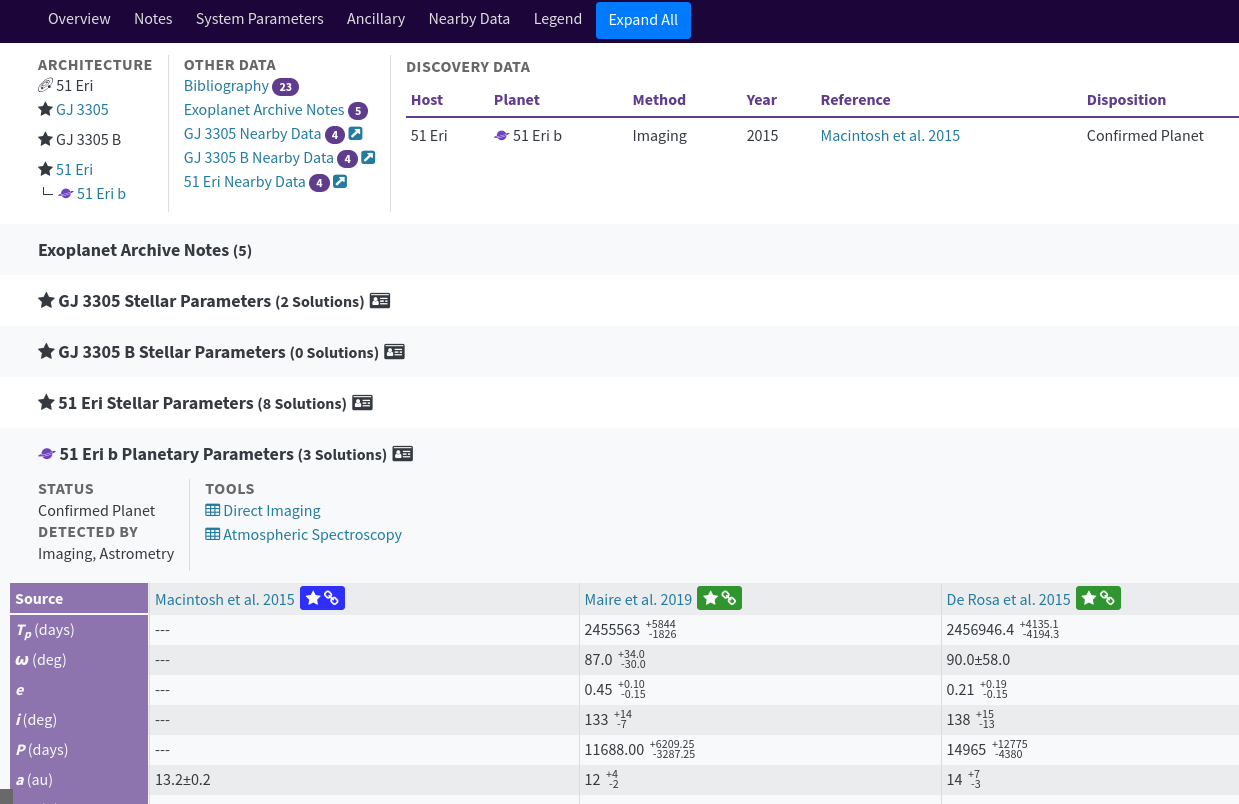
   HW 2:  Based on Macintosh et al. (2015),
             _approximately_ what was the angular separation between
             host star and exoplanet in the discovery images?


    HW 3: De Rosa et al. (2015) attempt to compute
             an orbit for this exoplanet around 51 Eri.
             The result is not very good because they
             had positions of the object at only ______
             different times.
Please turn in your answers to questions Q1 - Q7 before you leave class. Please write out answers to the homework questions before our next class meeting.
I haven't described all the methods that astronomers use to find planets around other stars. For a discussion of all those methods, in much greater detail, see the first of the references below.
 Copyright © Michael Richmond.
This work is licensed under a Creative Commons License.