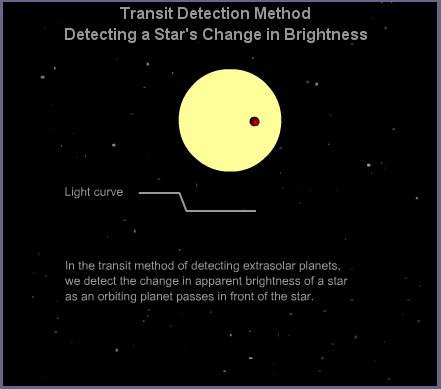
If not, use this tool to refresh your memory
 Copyright © Michael Richmond.
This work is licensed under a Creative Commons License.
You are familiar with the basic idea behind the transit method, right?

If not, use this tool to refresh your memory
The idea is pretty simple: if a star has a planetary companion, AND if a distant observer lies in the orbital plane of that planet, then ever now and then the planet will pass in front of the star. As the planet makes its transit, it will block some of the star's light, causing a brief, small dip in its brightness. Find a series of little dips, and *boom* there's the planet.
So, what's so hard about that?
Q: Really -- why is this so difficult?
Well, let's begin by seeing just how large these dips in brightness might be, and how long they last. Let's take as an example the solar system, and two of the most interesting of the planets:
    Object               Radius               Orbital speed
                          (m)                     (m/s)
 -----------------------------------------------------------------

    Sun                   6.96 x 10⁸               ------

    Earth                 6.37 x 10⁶               29,800

    Jupiter               7.15 x 10⁷               13,100

 ------------------------------------------------------------------


     Q:   What fraction of the Sun's disk will Earth block?
          How long will it take Earth to travel across the Sun?


     Q:   What fraction of the Sun's disk will Jupiter block?
          How long will it take Jupiter to travel across the Sun?
You should find results somewhat like this:
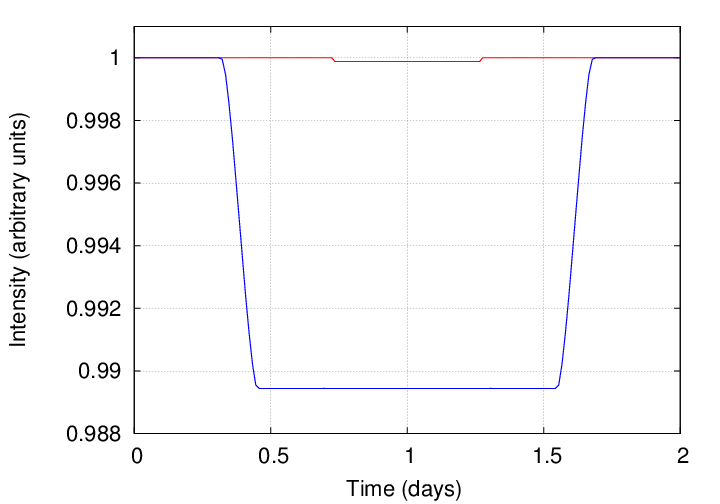
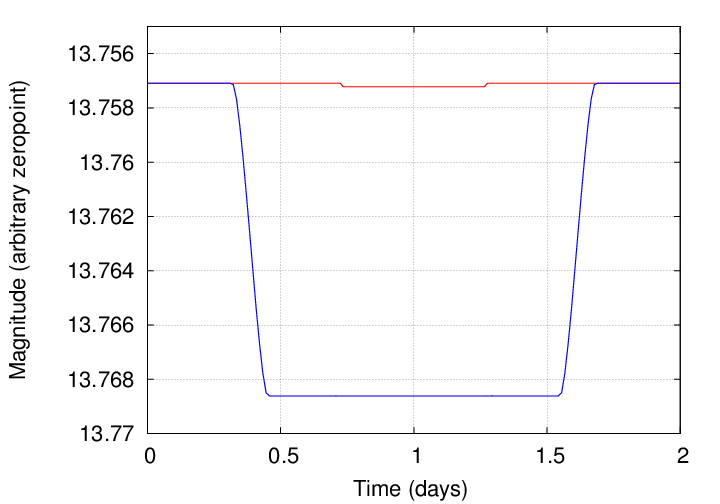
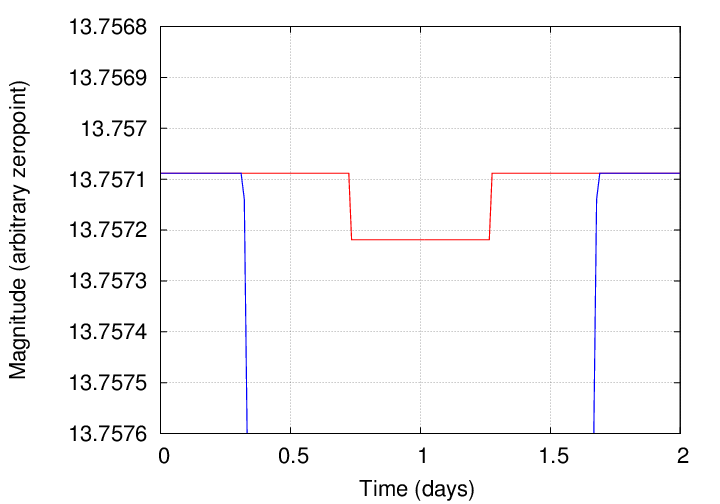
Yes, these dips in brightness are pretty darn small: Jupiter blocks about 1% of the Sun's disk, while the Earth blocks about 0.01%. For this reason, astronomers use the following terms when discussing transits:
So, if we want to find planets via the transit method, we need high precision photometry.
We also need patience. Consider a poor ground-based astronomer who is looking for new planets with this technique.
   Q:  How long does a transit from an Earth-like planet last?


   Q:  How often will a transit occur?


   Q:  What fraction of the time will one particular system
          be in transit?

          (Compare this to the fraction of time one particular
           system shows radial velocity variations)


   Q:  How many transits must one observe in order to be sure
          that the dip is due to a planet, and not to some
          other effect, or due to noise?
For example, suppose that you and your friend decide to study a star which may host an exoplanet.
Each person makes one measurement per night. Let's see what each of you can learn as time passes.
Day 1 - 80 Click on the graph to see what happens.
  Q:  After 80 days, what do the radial velocity measurements
           reveal to us?

  Q:  After 80 days, what do the transit measurements reveal to us?
Day 81 - 130 Click on the graph to see what happens.
  Q:  After 130 days, what do the radial velocity measurements
           reveal to us?

  Q:  After 130 days, what do the transit measurements reveal to us?
Day 131 - 400 Click on the graph to see what happens.
  Q:  After 400 days, what do the radial velocity measurements
           reveal to us?

  Q:  After 400 days, what do the transit measurements reveal to us?
Day 401 - 500 Click on the graph to see what happens.
  Q:  After 500 days, what do the radial velocity measurements
           reveal to us?

  Q:  After 500 days, what do the transit measurements reveal to us?


  Q:  What would happen if the weather was bad, so that
           it was only possible to make one measurement
           every week or so?
Well, okay, the signals are small -- maybe very small -- and they are rare. Fine. We have marvelous detectors, such as CCDs, and we have lots of time. Surely it can't be so hard to find these transits?
In one sense, no, it isn't. After all, the first transit ever observed was measured with the 4-inch STARE telescope:
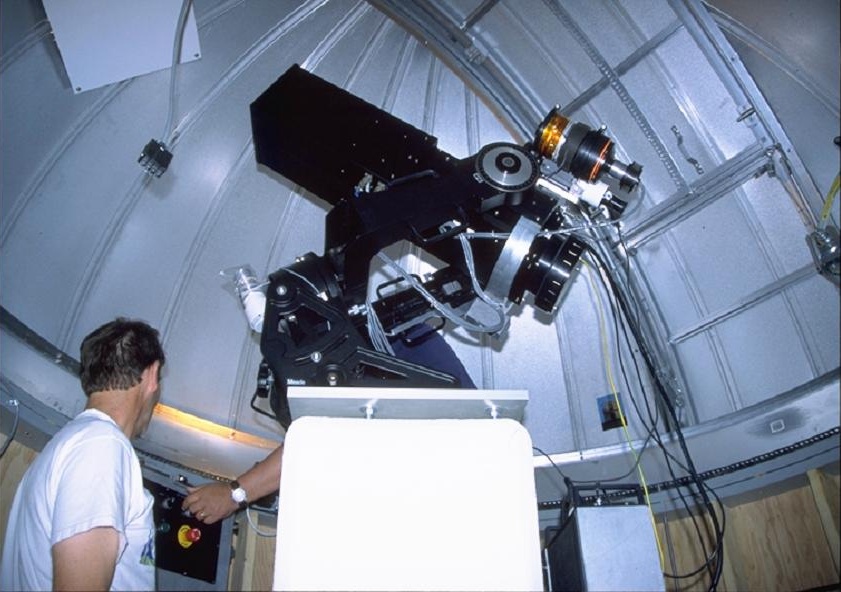
Image courtesy of
the STARE project
But, in practice, there are a number of complications which make the detection of transits a lot harder than one might think at first.
For example, during the course of a long run on WZ Sge on July 27, 2001 at the RIT Observatory, I measured the following raw instrumental magnitudes for a reference star:
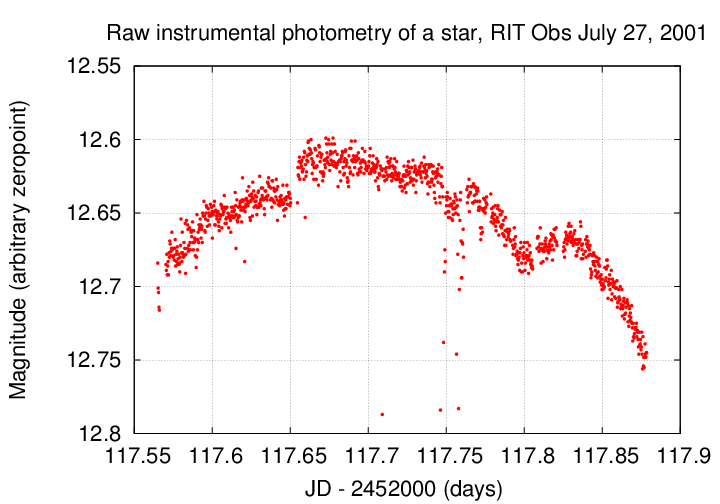
               Q:  How large are the variations due to extinction?


               Q:  How large are the variations due to transits?
You can read more about extinction in a lecture from the Observational Astronomy course.
There are ways to remove most of its effects. I recommend very, very strongly that one use multiple comparison stars in the same field as the target and perform differential photometry. Even better is to go whole-hog and apply inhomogeneous ensemble photometry. You might even be able to grab some some free software to do the work for you.
Oh, and all this becomes a lot worse if there are any clouds, of course.
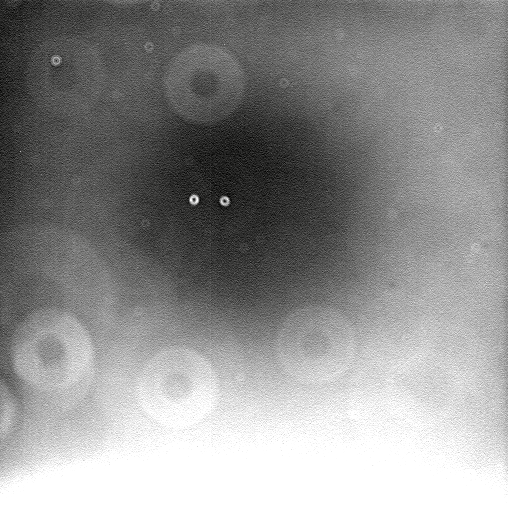
Ugh! What an ugly mess of large-scale gradients, big donuts, small donuts, and tiny little spots.
Q: What causes the big and small donuts?
It might not be as bad as you think; the image above was created with a relatively high contrast. To get a quantitative feel for the size of these variations in sensitivity, examine this slice through the image.

          Q:  What is the size the sensitivity variation
              across one of the small donuts?
Now, clearly, these variations cause errors in ordinary photometry of stars across the field of view: those near the center would seem brighter than they ought, those near the edges or under donuts would be fainter.
Q: But does flatfielding matter for transit observations?
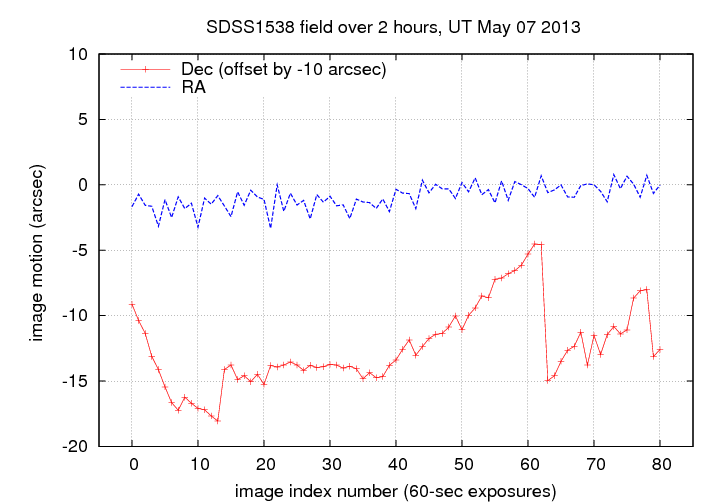
Given the performance of the RIT 12-inch telescope in guiding measured on May 6, 2013 (and shown below), yes, a failure to correct for flatfield variations WOULD be a big problem.
RMS of number of photons = sqrt(avg number of photons)
One can derive an expression for the fractional error in each measurement of a star due to this random variation in the number of photons measured each time:
                                            sqrt(avg number of photons)
             fractional uncertainty    =   -----------------------------
                                                (avg number of photons)

                                                     1
             fractional uncertainty    =   -----------------------------
                                            sqrt(avg number of photons)
And, as long as this fractional uncertainty is small, say, less than 0.1, there's a neat little numerical coincidence which ends up giving us an easy-to-remember result:
                                                     1
           uncertain in mag   (approx) =   -----------------------------
                                            sqrt(avg number of photons)
             Q:  So, in order to reach an uncertainty of 0.001 mag,
                    how many photons must we collect in each image?


             Q:  So, in order to reach an uncertainty of 0.0001 mag,
                    how many photons must we collect in each image?
That sounds like a lot of photons ... and it IS a lot of photons. Fortunately for us OPTICAL astronomers, each photon has so little energy that typical stars send us a boatload of them in even a short exposure.
You can find many CCD signal-to-noise calculators which will do the work for you (such as this general-purpose one or this one for NOAO ). Or, you can do it yourself, using the rough starting point
star of mag 0 produces 106 photons / sq. cm. / sec
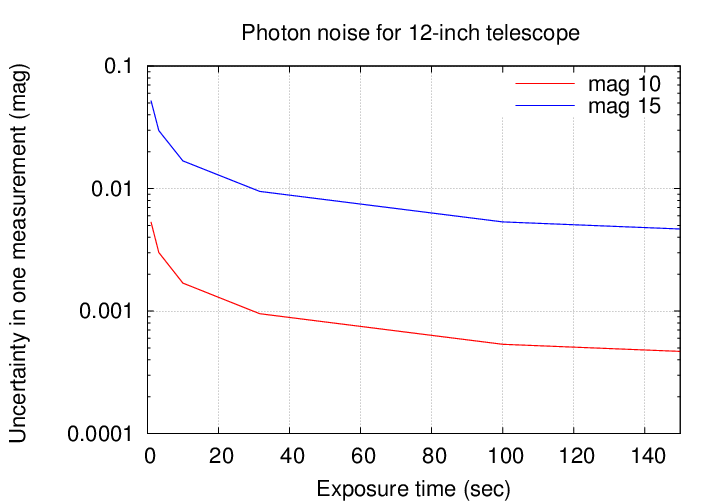
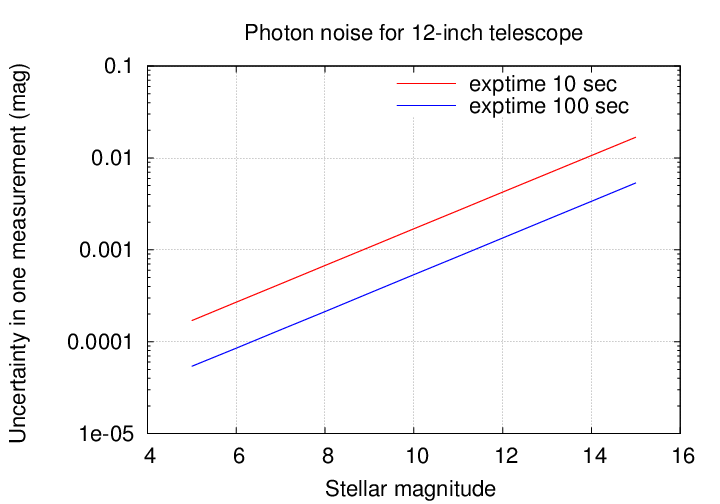
Well, this doesn't seem so bad: just exposure for a minute, or two minutes, or ten minutes, and you can beat down the photon noise as much as you'd like. Right?
Wrong!
CCDs are nice, but they aren't perfect. You can read about the "dark side" of CCD detectors for more details, but one particular feature of a CCD is its full well capacity. If too many photons hit one pixel, and liberate too many electrons within that tiny volume of silicon, the electrons will start to leak out into the surrounding pixels.
We call this saturation, or, when it gets worse, bleeding. If you see long trails
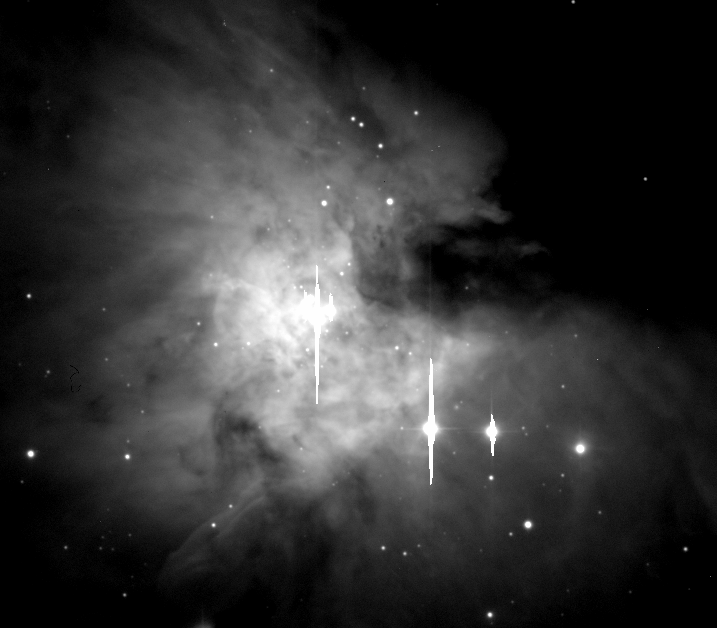
or stars with "flat tops" in a radial profile, you should be on the lookout for errors in photometry.
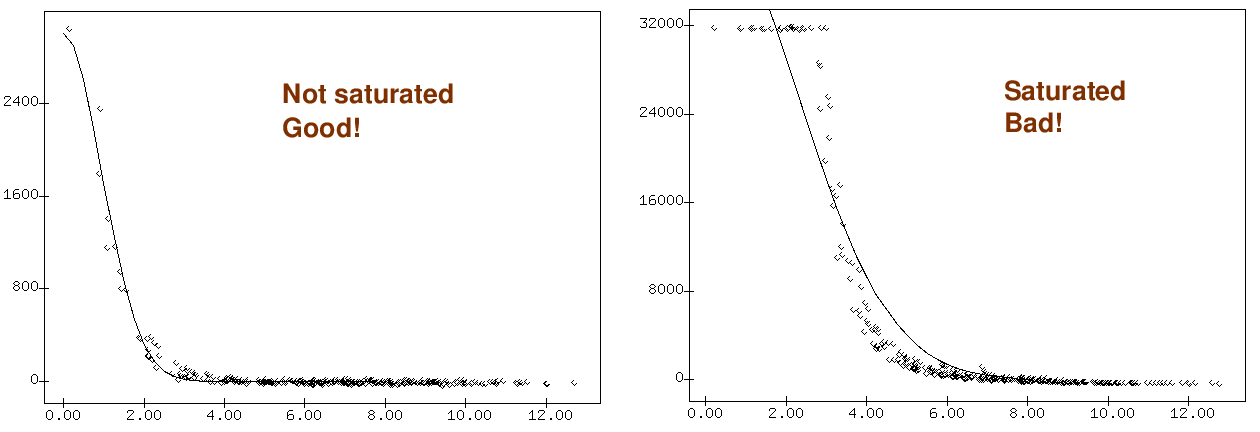
A typical CCD might have a full-well capacity of 100,000 electrons per pixel. Take a look at the closeup of a star in an image below.
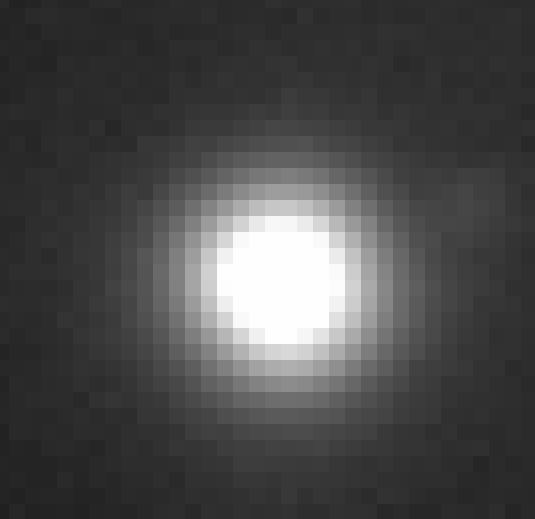
             Q:  Estimate the number of electrons you could collect
                    from a star in a single image, without saturating
                    the CCD.


             Q:  What is the resulting uncertainty in the measurement?
Hmmmm. That might be good enough for giant planets, but it's not precise enough to detect small ones. Is there anything we can do to improve the dynamic range of our CCD measurements?
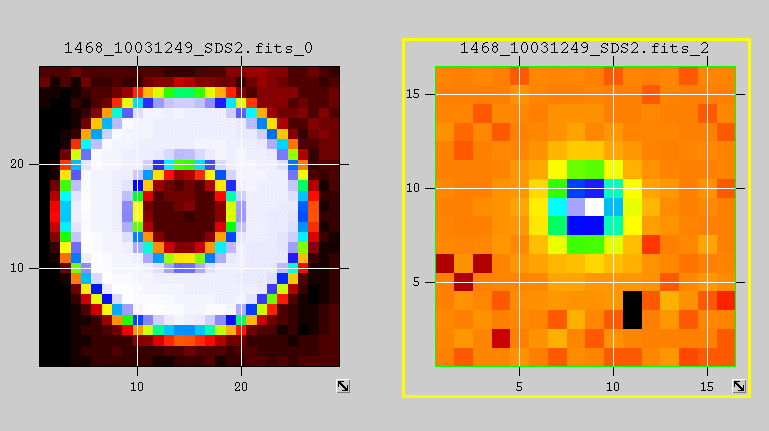
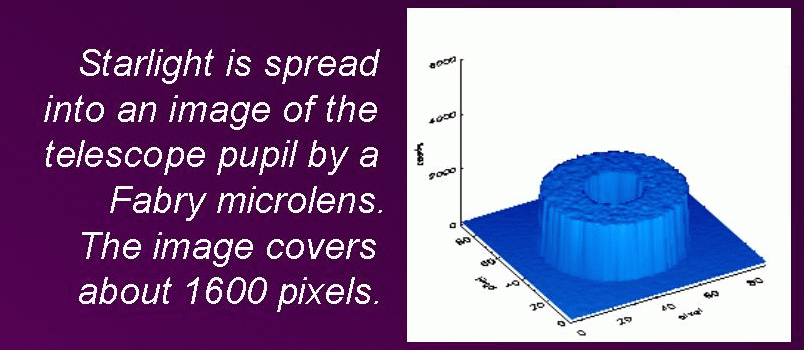
Yes! We can simply de-focus the telescope! The MOST satellite turned its stars into big donuts:
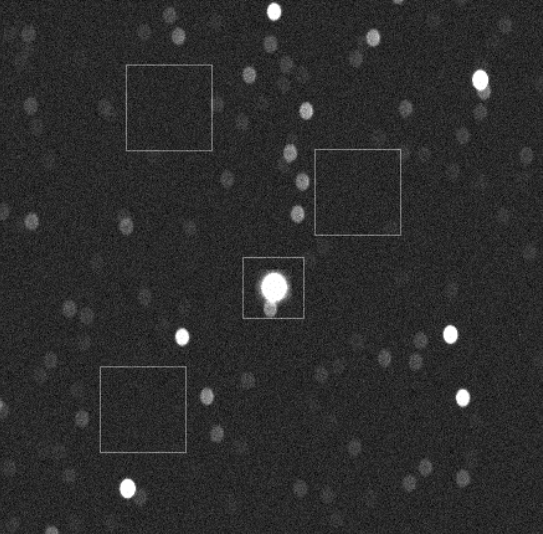
The COROT satellite did, too, though not to the same extreme.

The result is scintillation, which is a fancy word for "twinkling." It's especially obvious when stars are close to the horizon, as in this time-lapse sequence of Long's Peak (thanks to Vadim Nikitin .
 Image sequence courtesy of
Vadim Nikitin .
If one zooms in to examine a star up close, scintillation looks like this:
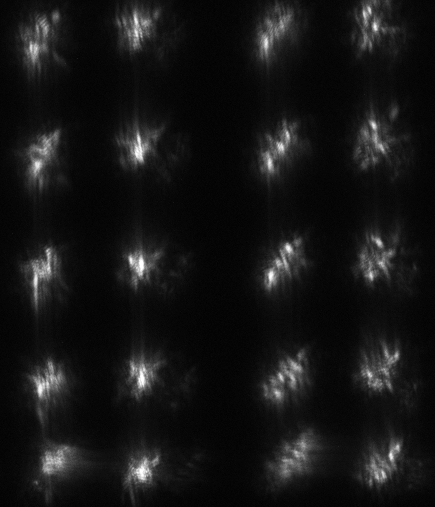
The appearance of this twinkling depends on the size of one's telescope.
The image below was taken by a very large telescope.
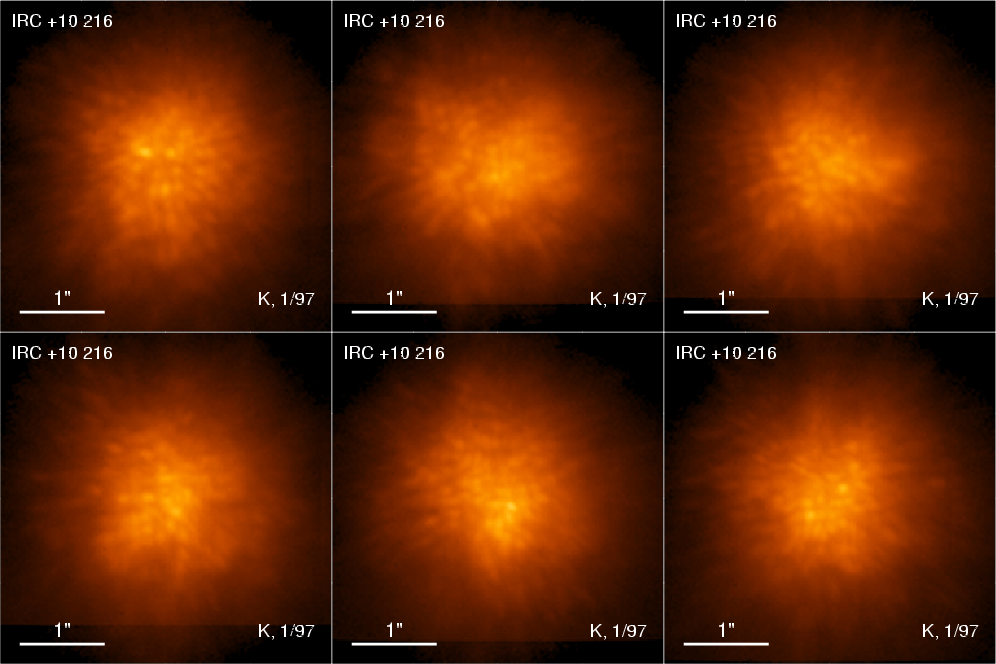
Astronomers have studied the nature of the scintillation noise for many years. Some good references are
This scintillation causes an uncertainty in each individual measurement which depends on several factors. A rough estimate can be calculated like so:
                          -0.67           1.75                       -0.5
       sig  =  0.09  * (D)      *  (sec Z)      *  exp(-h/h0)  * (2T)


      where

          sig      is the RMS deviation from the mean intensity (fractional)

          D        is the diameter of the telescope aperture in cm

          sec(Z)   is the airmass

          h        is the altitude of the site

          h0       is the scale height of the atmosphere (about 8000 m)

          T        is the exposure time, in seconds
For the RIT Observatory, which is only 168 meters above sea level, scintillation can be important.
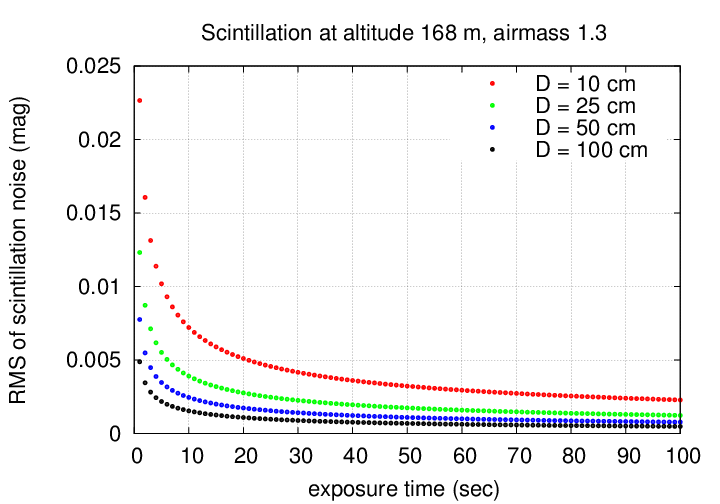

If we pick some particular site, telescope and exposure time, then the scintillation noise is constant. Let's compare it to photon noise.
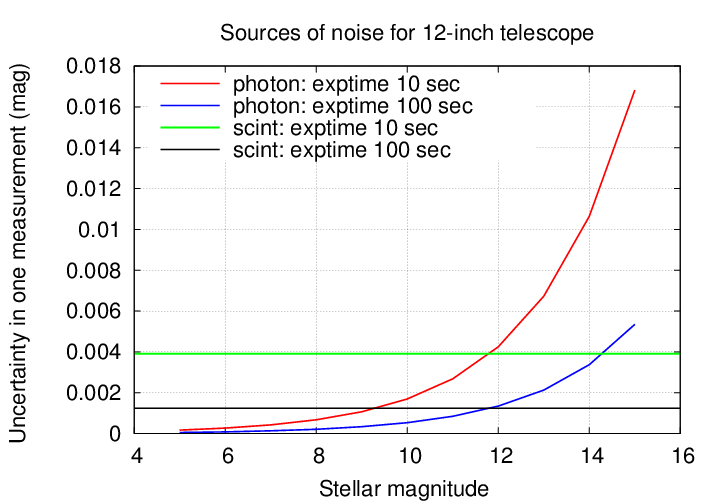
If you aren't a regular observer, working frequently with the real data, you might over-estimate the quality of your measurements.
A number of years ago, while I was working on the SDSS, I checked the precision of photometric measurements of stars in the SDSS catalogs.
Has this inconvenient truth been inserted into the SDSS catalogs? Well, I recently (Mar 19, 2015) made a query using the SDSS website. Take a look at what I found:
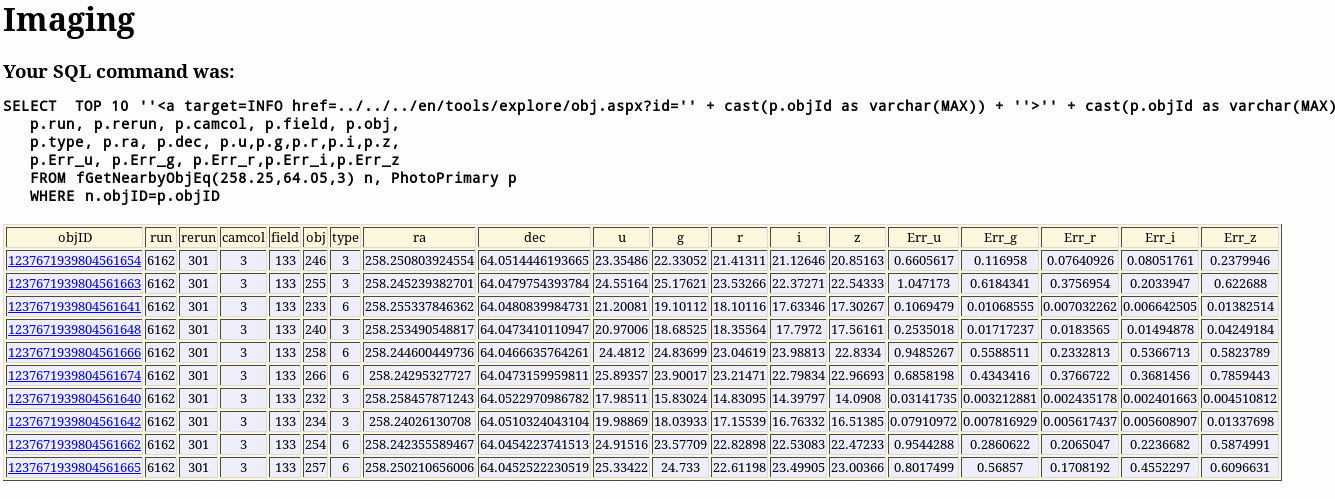
Wierd things often appear at the bright end of stellar distribution. For example, when I examined some images taken with the HDI camera on the WIYN 0.9-m telescope, I found -- well, you take a look:
 Copyright © Michael Richmond.
This work is licensed under a Creative Commons License.