 Copyright © Michael Richmond.
This work is licensed under a Creative Commons License.
Copyright © Michael Richmond.
This work is licensed under a Creative Commons License.
Disclaimer -- I'm not a radio astronomer, so it's possible that the next few lectures may contain some mistakes. Please do read some of the references by real experts listed in the 'For more information' section at the end of this document.
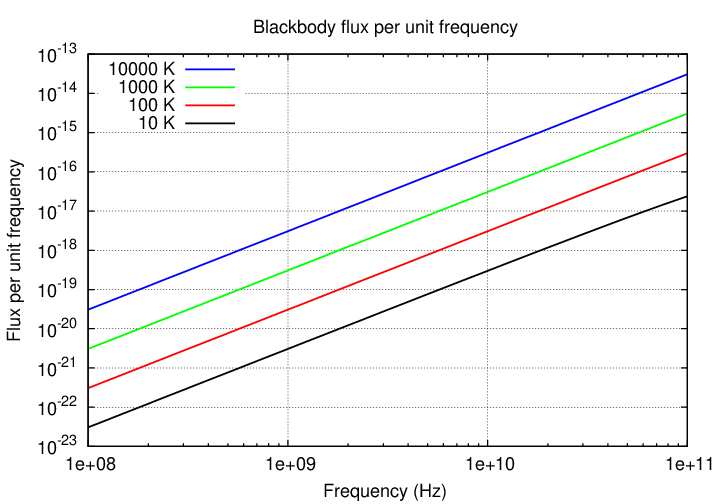
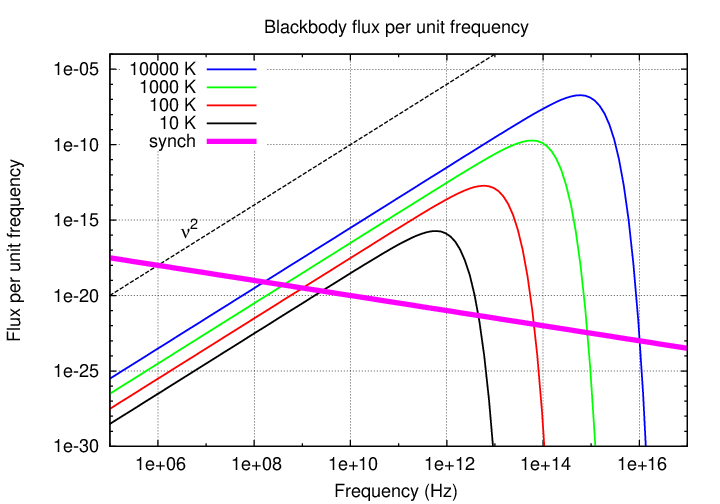
You're familiar with blackbody radiation by now, I hope. These graphs showing radiation as a function of wavelength and frequency should hold no surprises.
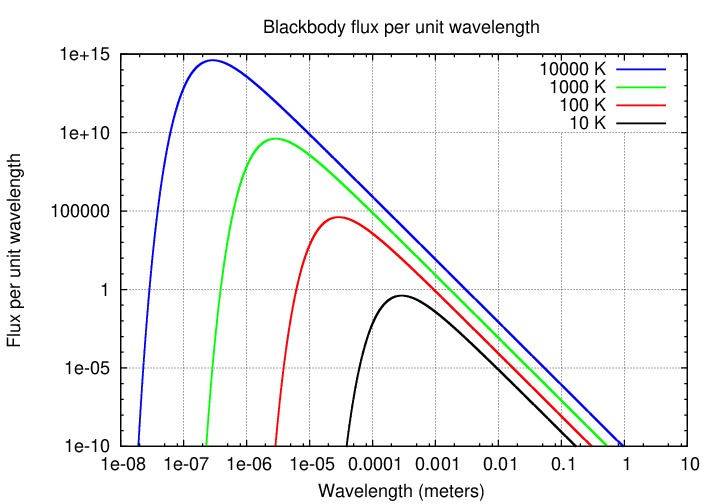

Now, we can split the blackbody spectrum into two pieces:
Note that the decrease in flux on the short-wavelength side of the peak is dramatic, due to the exponential nature of the Planck function in that region; but the decrease on the long-wavelength side is much more gradual.
If one measures the slope of the blackbody spectrum on this long-wavelength / low-frequency side of the peak, one finds that, when expressed as flux per unit frequency, it has a slope of exactly 2, as shown in the diagram. Radio astronomers often approximate the spectra of sources by a simple power law, in which the exponent α is called the spectral index.

Note that the negative sign is built into this definition(*), so that a blackbody spectrum with a slope of +2 must have a spectral index of -2.
(*)Warning: older sources use the "negative" convention, assuming a negative sign in front of α, but recent sources tend to use a "positive" convention. Both appear in the literature. It's probably best to say explicitly how the flux depends on the frequency.
Consider two objects with very different temperatures but similar sizes; say, a white dwarf star (T = 10000 K) and a planet like the Earth, orbiting a sun-like star at the distance of Neptune or so (T = 100 K). Suppose we place these two objects at the same distance from the Earth and observe them.
  Q:   If we observe in the OPTICAL region, which one is brighter?

       By how much?


  Q:   If we observe in the RADIO region, which one is brighter?

       By how much?  (look at figure below)
That's one feature of the radio region of the spectrum. Since typical observing wavelengths (longer than 1 mm) are longer than the peak of any object's Planck spectrum, we always observe in the Rayleigh-Jeans tail of the spectrum. And on that tail, objects of different temperatures don't have drastically different fluxes per unit area.
That is one reason that stars -- which are so prominent in the optical sky -- don't show up very much in the radio sky. Sure, they are much hotter than clouds of gas and dust, but that can't make up for their much smaller surface areas.
In fact, in the radio sky, the dominant features are generally not thermal sources. Some of the strong thermal sources are
Note that since objects emit blackbody radiation at all wavelengths, they produce a continuous spectrum; in other words, they are one class of continuum sources. But there are several other classes ...
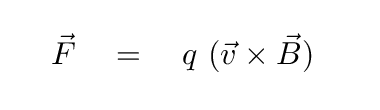
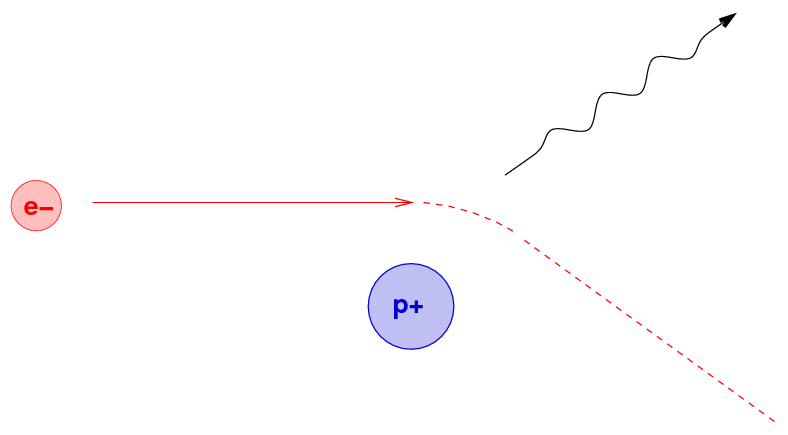
Another physical mechanism which can produce radiation at all wavelengths involves charged particles trapped along magnetic field lines. When a moving charge encounters a magnetic field, it is accelerated by the Lorentz force
  Q:  What will happen to the electron as it enters the
           region of magnetic field (pointing out of the screen) below?
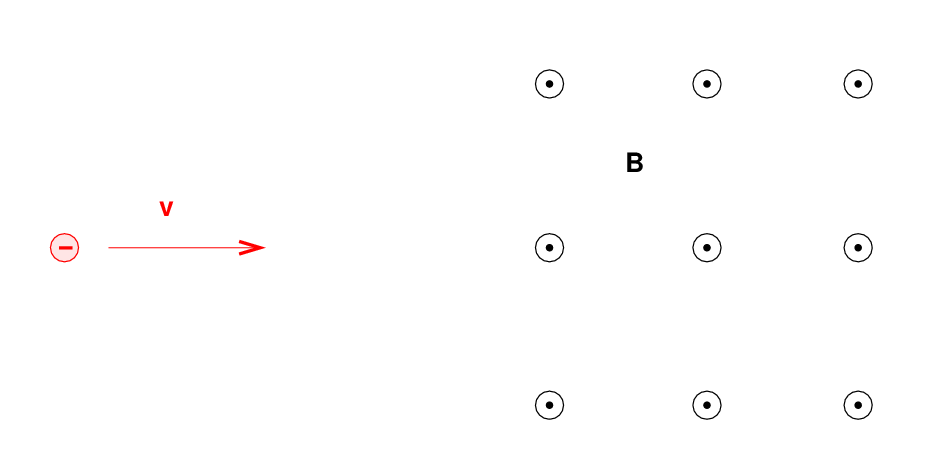
Right. A charged particle will move in a circular path, perpendicular to the magnetic field. But if the particle happens to have some component of its velocity parallel to the field, it will continue to move in that direction with constant speed. The combination of a circle in one plane, plus constant motion perpendicular to that plane, creates a heliacal path.
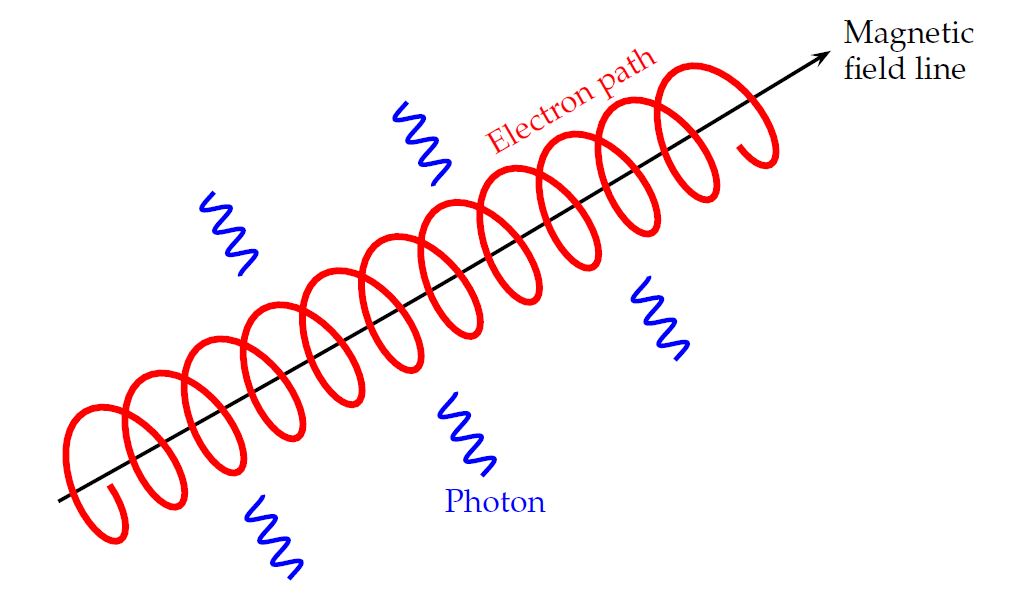
Image courtesy of
Dr. Adrian Jannetta
As the charged particle moves in this path, it is constantly accelerating ... and thus, it constantly emits electromagnetic radiation. The frequency of this radiation depends upon the speed, charge and mass of the particle, the strength of the magnetic field, and the geometry of the motion.
In general, a cloud of gas will contain many particles with different energies, all mixed together. If the distribution of particle energies has a power-law form, like this:
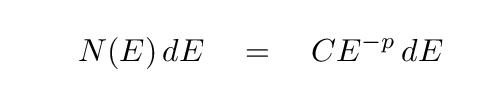
then it can be shown that the spectrum of the synchrotron radiation which is emitted by the cloud will have the form

  Q:  Suppose that a cloud of particles has a distribution of
          with number of particles going as energy to the -2 power.

      What will be the spectral index of the resulting synchrotron
          radiation?
In this case (which is the usual for synchrotron radiation), the power emitted per unit frequency decreases with frequency, and so the spectral index is positive. Most of the power is radiated at small frequencies = long wavelengths. In the example shown below, the spectrum of synchrotron radiation follows
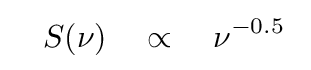
which corresponds to a spectral index of α = 0.5 (old style), typical for some sources in the Milky Way.
Note that "spectral index", to a radio astronomer, is sort of like "color" to an optical astronomer. It describes in very rough manner the nature of the spectrum.
                        optical                    radio
--------------------------------------------------------------------

  property               color                  spectral index


  values            "red", "blue"                +1,  0,  -1.3


  if most flux
   at low energies        red                       positive (with old convention)


  if most flux
   at high energies       blue                      negative (with old convention)

--------------------------------------------------------------------
What sort of objects emit primarily via synchrotron radiation? Well, the sort of objects in which lots of ionized gas interacts with strong magnetic fields:
For example, the supernova remnant Cas A.
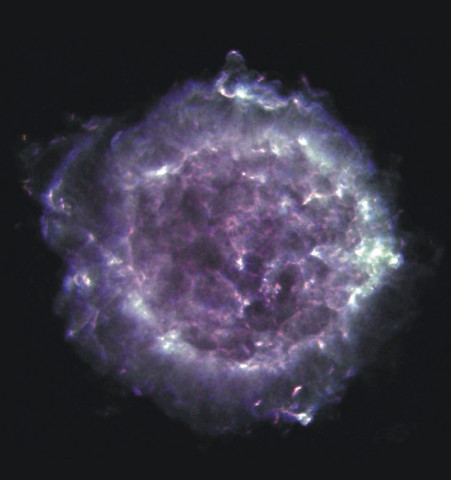
Image courtesy of
NRAO/AUI
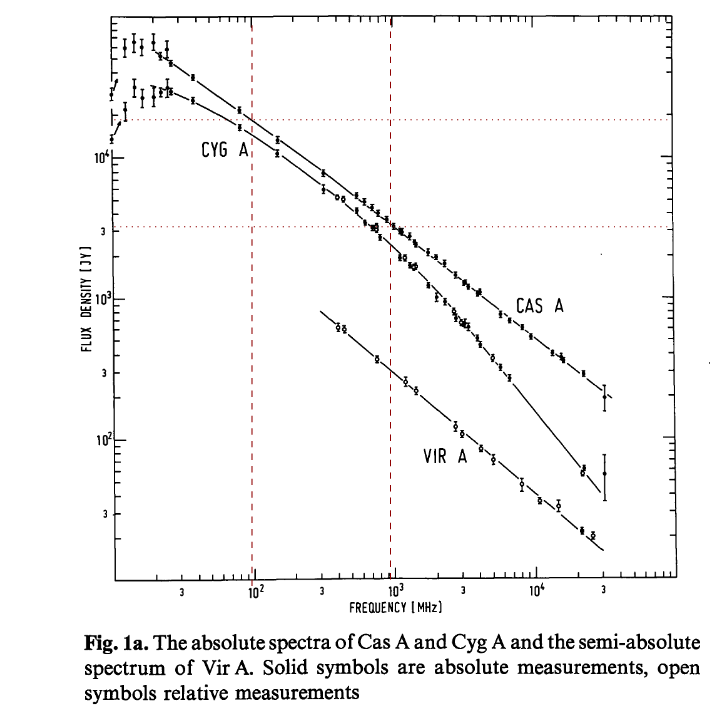
Figure 1a taken from (and modified)
Baars et al., A&A 61, 99 (1977)
  Q:  Measure the flux density of Cas A at frequencies of
             100 and 1000 MHz in the figure above.


  Q:  Use those measurements to compute the spectral index
             of Cas A.


  Q:  How does your value compare to the one given by
              Baars et al., A&A 61, 99 (1977) ?
You may recall our discussion of brehmsstrahlung emission when we were covering X-ray telescopes. The basic idea is still the same: charged particles which fly past each other at high speeds cause each other to accelerate, once again producing radiation.
The amount of this radiation clearly depends on the density of particles squared, because each encounter requires that one particle comes close to another. The emission measure of a cloud of gas is one way to characterize the number of free-free encounters that should take place: it combines the density-squared and the size of the cloud.

One can use emission measure to compute the free-free opacity of a cloud of gas which has temperature T:

Note the dependence on frequency. At low frequencies, a cloud of gas will have a large optical depth to free-free radiation; in other words, it will be optically thick, and emit like a blackbody. But when the frequency rises high enough, the cloud will become optically thin, and then the emission will stop rising with frequency.

The model seems to work pretty well for a couple of real HII regions.
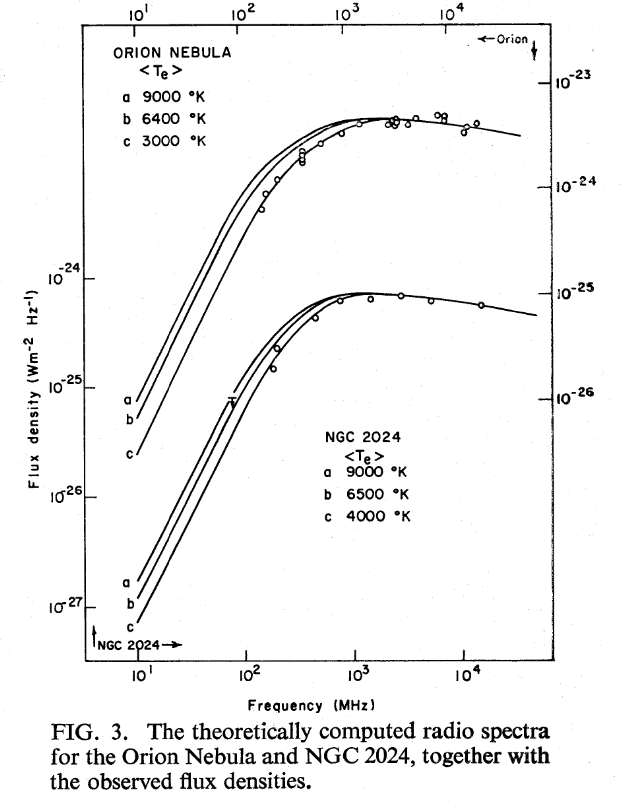
Figure 3 taken from
Terzian, Mezger and Schraml, ApL 1, 153 (1968)
You've seen many cases in which atoms emit radiation at particular wavelengths, due to electronic transitions between energy states; well, that happens in the radio regime, too. In the optical, these transitions involve differences of about 1 electron volt; but in the radio, the jumps in energy are much smaller.
Remember the hydrogen atom and its energy levels?

We can write the energy of level n with the following formula:

  Q:  The H-alpha line involves a drop from n=3 to n=2.
          What is the energy of this transition, in eV?
          What is the wavelength of the photon?


  Q:  A radio astronomer measures the transition between
          n=103 and n=102.
          What is the energy of this transition, in eV?
          What is the wavelength of the photon?
          What is the frequency of the photon?
Radio astronomers can also observe the transitions between rotational and vibrational states of molecules. But there is an important restriction on the rotational possibilities. In order to radiate efficiently as it rotates, a molecule must have an electric dipole moment, which requires some sort of asymmetry in the molecule.
  Q:  What is the most common element in the ISM?


  Q:  What is the most common molecule in the ISM?


  Q:  Can we observe transitions between rotational states
             of this molecule?
On the other hand, the molecule CO is relatively common, and it definitely has a dipole moment. Radio astronomers make frequent use of carbon monoxide as a tracer of clouds of molecular hydrogen. The rotational states of this molecule are given values of J=0, J=1, J=2, ... The transitions between state N and N-1 have frequencies given by the formula
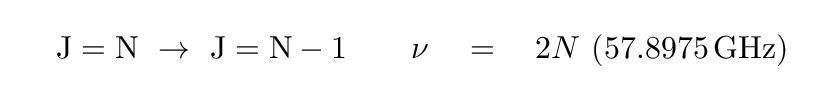
  Q:  What is the frequency of radiation emitted by CO as it
            changes from J=1 to J=0?

      What is the wavelength of this radiation?
Compare the view of the plane of the Milky Way in the optical and in CO emission (showing molecular hydrogen clouds):


Images courtesy of
NASA's 'The Multiwavelength Milky Way'
Some clouds are so dense and large that they become optically thick to these radio waves, which prevents us from seeing past their outer layers. One trick that astronomers sometimes use is to pick another isotope of the molecule -- a less common one -- and use it as the tracer. Slightly different nuclear masses will lead to a SLIGHTLY different frequency of radiation, and because these isotopes are less common, the radiation will encounter fewer possible absorbers on its way through the cloud.
For example, the molecule 13CO is a frequent substitute for regular old 12CO in some cases. The heavier version is about 1% of all carbon atoms, and produces a J=1 to J=0 transition with a slightly different frequency. You can find its frequency (and those of many other common molecular lines) at the SETI League's
There is one very important emission line in the radio region which is produced in a somewhat unusual manner. It doesn't involve the transition between ordinary electronic energy levels, or rotations or vibrations of molecules. This is the spin-flip or 21-cm transition of isolated neutral hydrogen atoms.
The mechanism involves the spin magnetic moments of the proton and the electron within a single atom. It turns out that these magnetic moments can be parallel (pointing in the same direction) or anti-parallel (pointing in opposite directions). The anti-parallel arrangement has a slightly lower energy.
Now, occasionally, a hydrogen atom in this lower-energy state might bump into another atom. If the conditions are right, the atom might gain enough energy in the collision to jump into the parallel-spin, higher-energy state.
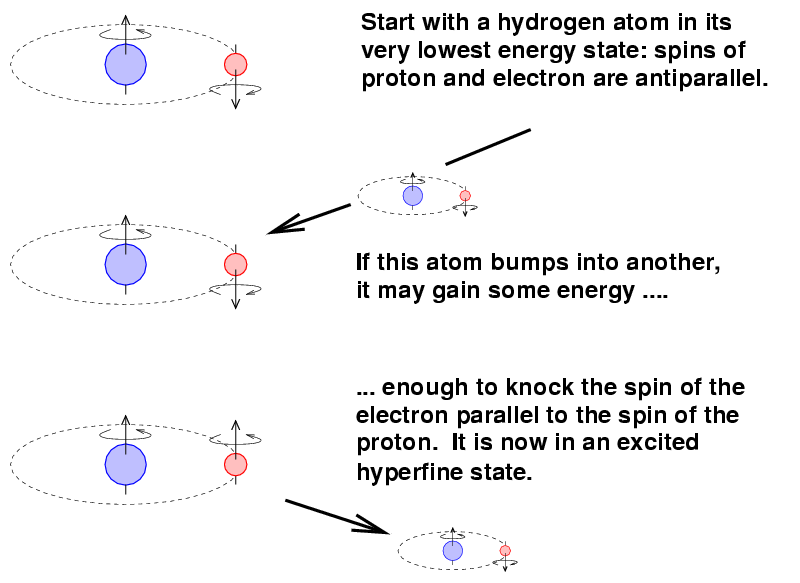
The transition from this excited state back to the ground state is ... not a quick one. On average, it takes around ten million years for an atom to make the change.

  Q:   What does that tell you about the atoms in the clouds
             which emit this gas?
The difference in energy between the two states is very, very small:
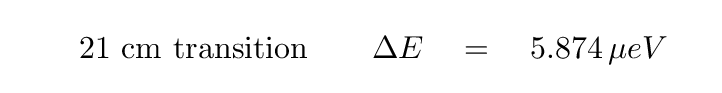
The wavelength of the transition is about 21.1 cm, and the frequency about 1420 MHz. You may recognize that frequency from radio searches for extraterrestrial civilizations; it sits at one end of the so-called "Water Hole."
Okay, fine, so there's a special transition involving hydrogen atoms. So what?
This is a really, really useful line because
That means that it is great for detecting the majority of gas in most galaxies, and revealing its motions. In many cases, the clouds are optically thin to this radiation, which means we can see all the gas and estimate its mass.
Compare the view of the plane of the Milky Way in the optical, in CO emission (showing molecular hydrogen clouds), and in 21-cm emission (showing atomic hydrogen clouds):

Images courtesy of
NASA's 'The Multiwavelength Milky Way'
  Q:  How does the location of HI clouds compare to that of
          warm dust?  Let's look at M31 and see.

      Use the  SkyView Advanced Form  to create a
          picture of M31 with a size of 5 degrees wide, 600 pixels across.
          Use the RGB Image Overlays near the bottom of the page
          to select "HI 4PI" in red (cold HI gas) and "IRAS 25 micron" in blue
          (warm dust).
One application of HI observations provides astronomers with a method to estimate the mass of spiral galaxies, based on the width of their HI emission lines.
Using radio telescopes with high spatial resolution, astronomers can measure the velocities of gas in nearby galaxies to produce spatially resolved maps of gas motions. Our nearest big neighbor, M31, looks like this:

Figure 8 taken from
Chemin et al., arXiv 0909.3846 (2009)
    Q:  What is the average speed of M31 relative to the Earth?
               Is it moving toward us, or away from us?


    Q:  What is (roughly) the speed with which gas in the disk
               of M31 is rotating around its center?
These maps can be analyzed to yield very precise rotation curves of galaxies.
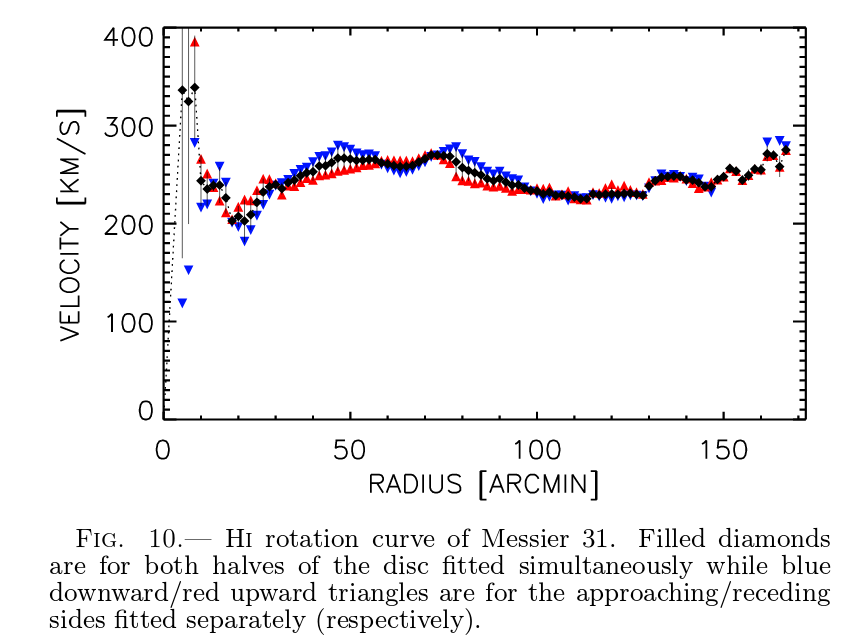
Figure 10 taken from
Chemin et al., arXiv 0909.3846 (2009)
  Q:  M31 is a distance of approximately 800 kpc from the Earth.
          Use the rotation curve above to estimate the its mass.
Copyright © Michael Richmond.
This work is licensed under a Creative Commons License.