 Copyright © Michael Richmond.
This work is licensed under a Creative Commons License.
Copyright © Michael Richmond.
This work is licensed under a Creative Commons License.
Today, let's focus on space-based observations of the mid-infrared; by that, I mean wavelengths from around 3 to 50 microns. It is possible to work at these wavelengths from the ground (at least the shorter-wavelength side), but very difficult. Space is really the right place to do this work.
The devices used to register light in the "mid-IR" are the same as those mentioned for the near-IR. The materials used vary with wavelength, with the most common choices being
 wavelength (microns)            material            operating temp (K)
-----------------------------------------------------------------------------

    1  -   2.5                     HgCdTe                    78

    3  -   6                       InSb                      30

    6  -  25                       Si:As                      6

   50  - 200                       Ge:Ga                      6

-----------------------------------------------------------------------------
While the materials have remained the same over several decades of instrument development, the sizes of the detectors have grown considerably. We'll be focusing on three satellites designed for mid-infrared astronomy:
Although each satellite had several instruments, I'll compare here the main imaging devices on each.
                    number of pixels           resolution             mode
-------------------------------------------------------------------------------

    IRAS                 62   x  4 bands        approx 5 x 2 arcmin   scanning

    Spitzer          256x256  x  4 bands        approx 1.5 arcsec     pointed

    WISE           1024x1024  x  4 bands        approx 6   arcsec     scanning

-------------------------------------------------------------------------------
The big difference is simply that more recent instruments have larger fields of view and more pixels; in other words, the newer satellites can collect more data, more quickly.
Let's look briefly at the properties of three infrared satellites.
Fig II.C.3, optics of IRAS, taken from
IRAS Explanatory Supplement
The focal plane of IRAS was rather simple. It didn't really have a "camera" -- instead, it had a set of individual "pixels" of different types arranged in rough rectangle. The spacecraft was spun, so that the sky swept past the detectors in the direction shown. As time passed, the satellite slowly scanned the entire sky.
Fig II.C.6, Focal plane of IRAS, taken from
IRAS Explanatory Supplement
The IRAS passbands ranged from 12 to 100 microns, but each one was rather broad.
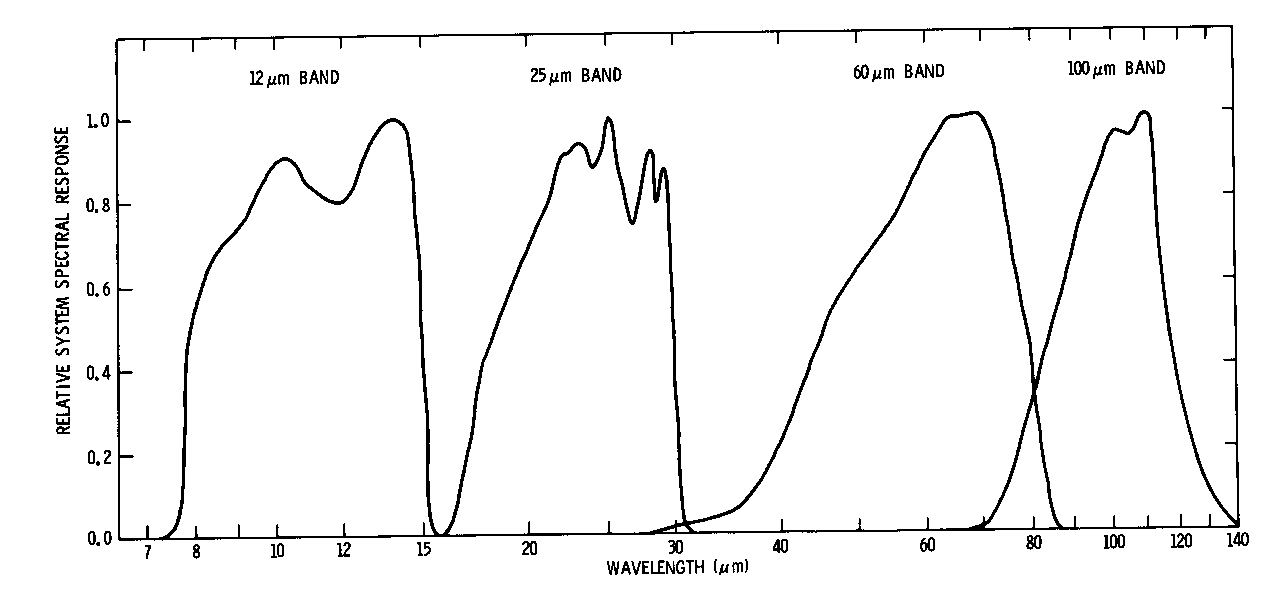
Fig II.C.9, passbands of IRAS, taken from
IRAS Explanatory Supplement
IRAS made 4 to 6 measurements of each spot on the sky during its 10-month lifetime. When its crygenic cooling material ran out, the mission ended.
          Q:  Use the  SkyView Query Form  to request an image
                  of M31 (the Andromeda Galaxy) taken with the "IRAS 25 micron" survey.
                  Use 800 pixels and a 5 degree field.
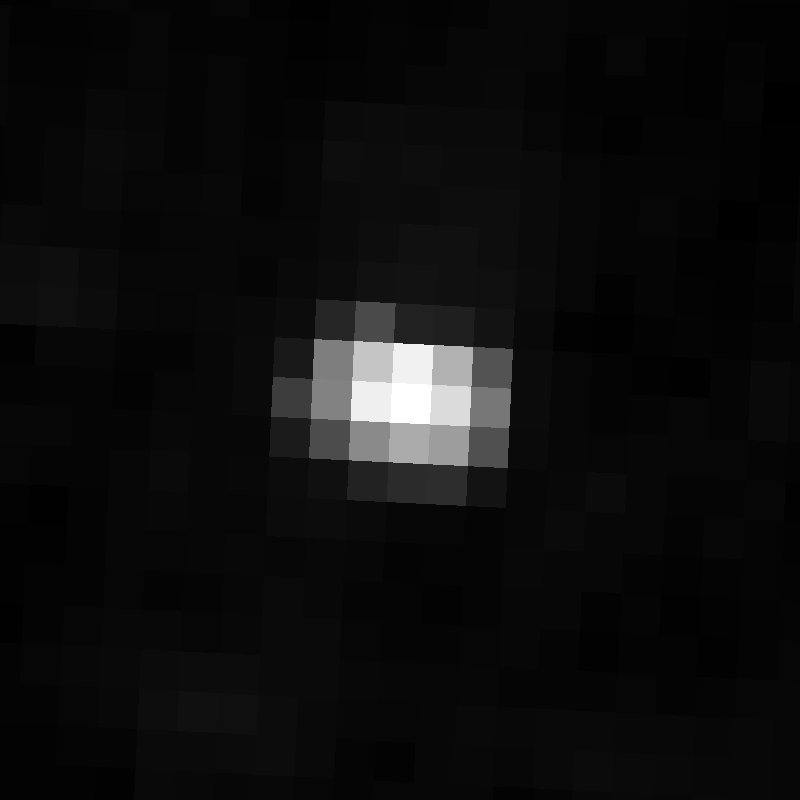
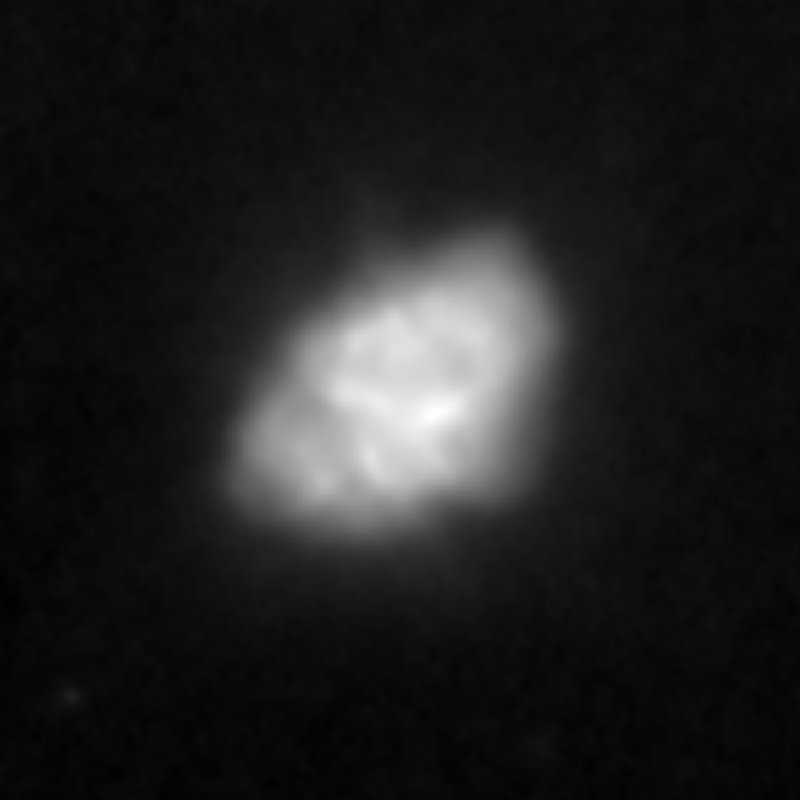
          Q:  Use the  SkyView Query Form  to request an image
                  of M1 (the Crab Nebula) taken with the "IRAS 25 micron" survey.
                  Use 800 pixels and a 0.25 degree field.
Q: What are the other "Great Observatories"?
As befitted a "Great Observatory", it collected a lot of light: its primary mirror was 85 cm in diameter, the largest of the three infrared satellites we'll discuss. It was a pointed instrument, which views a tiny portion of the sky in great detail, but can not carry out large surveys easily.
Spitzer carried three main instruments: IRAC (near-IR camera), IRS (near-IR spectrograph) and MIPS (mid-IR camera). The field of view of each instrument was roughly 5x5 arcminutes (which is about twice as large as each "pixel" of IRAS!)
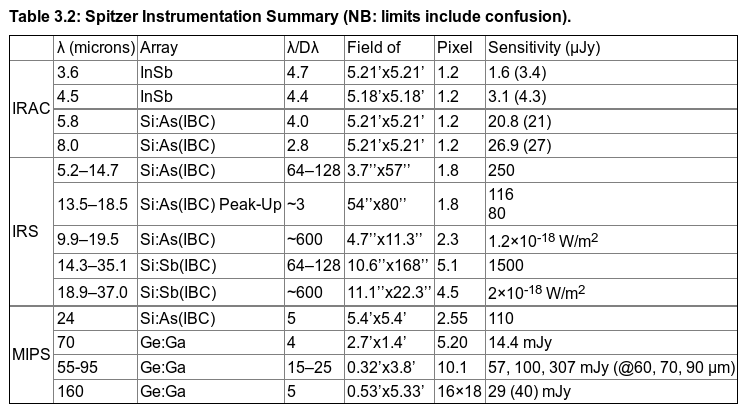
Table 3.2 taken from
The Spitzer Telescope Handbook
Note that the longer-wavelength instruments must be cooled to very low temperatures: below 6 K or 12 K (the MIPS 160 micron detector required the very lowest temperatures). About six years after launch, in 2009, the spacecraft used the last of its cryogen materials, and the detectors started to warm up. Between September, 2009, and January, 2020, the focal plane was kept at 28.7 Kelvin, which was still low enough for the InSb detectors in IRAC's short-wavelength bands (3.6 and 4.5 microns) to observe fruitfully.
So, for the final 11 years of its lifetime, Spitzer carried out a limited "warm mission", in which it observed only with these two arrays. But on January 30, 2020, NASA terminated the mission; the annual $14 million cost of operating the observatory was judged too large for the perceived returns.
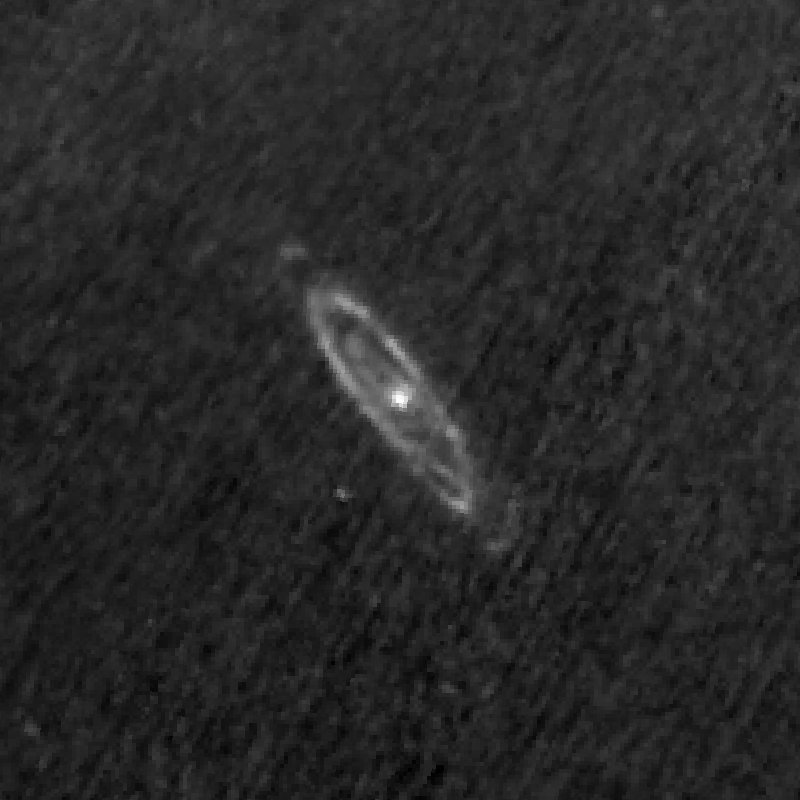
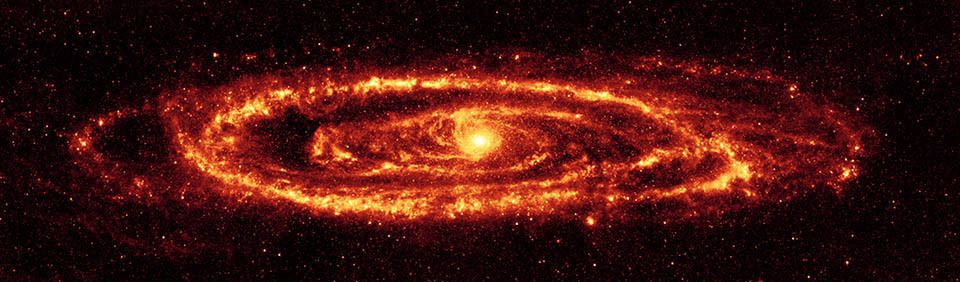
          Q:  Find an image of M31 (the Andromeda Galaxy) taken with
                  Spitzer's MIPS camera at 24 microns.
          Q:  Find an image of M1 (search for "Crab Nebula") taken with
                  Spitzer's MIPS camera.
Like IRAS, it was a survey instrument, designed to make a map of the entire sky at several epochs. It managed to make around 10-12 measurements of objects near the ecliptic equator during its (first) lifetime, with many more for objects near the ecliptic poles.
WISE had a 40 cm primary mirror, cooled to very low temperatures to minimize its thermal emission. Light entering the aperture was split into four passbands, each of which is focused onto a separate focal plane of very large size: about 47 x 47 arcminutes. In each case, the light fell onto a hybrid array of 1024 x 1024 pixels:
           name      wavelength       material
           ----------------------------------------

             W1       3.4 microns       HgCdTe

             W2       4.6 microns       HgCdTe

             W3      12   microns       Si:As

             W4      22   microns       Si:As

           ----------------------------------------
Note that the passbands are not all equally wide:
Image courtesy of
WISE and Ned Wright
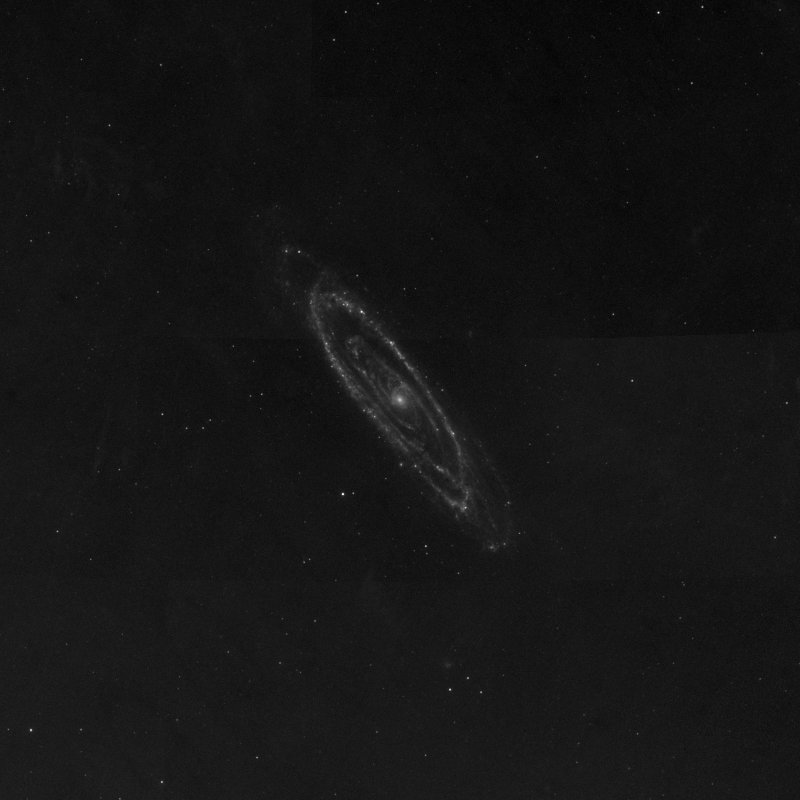
          Q:  Use the  SkyView Query Form  to request an image
                  of M31 (the Andromeda Galaxy) taken with the "WISE 22 micron" survey.
                  Use 800 pixels and a 5 degree field.
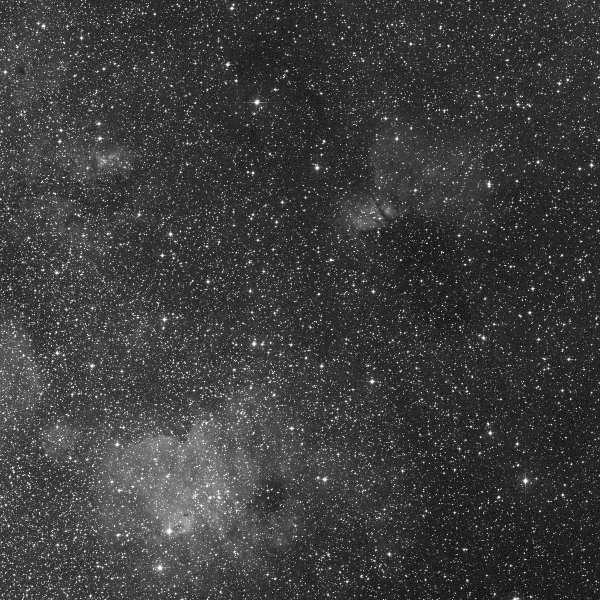
          Q:  Use the  SkyView Query Form  to request an image
                  of M1 (the Crab Nebula) taken with the "WISE 22 micron" survey.
                  Use 800 pixels and a 0.25 degree field.
About nine months after its launch in 2009, the cryogenic coolants inside WISE were depleted; as a result, it lost its ability to observe in its longer-wavelength bands (12 and 22 μm). However, it continued observing the sky in the 3.4 and 4.6 micron bands for another four months. In February, 2011, NASA placed the spacecraft into "hibernation mode" and halted the mission ...
... BUT, several years later, in December, 2013, NASA woke up the spacecraft and restarted its operation. The new NEOWISE mission focused on searching for asteroids in the solar system, with a special emphasis on those which might pose a hazard to the Earth. The second mission was terminated on July 31, 2024.
The section below was written years before JWST launched ...
Well, it seems difficult not to peer just a year (or two, or three) into the future for the next big thing in infrared satellites: James Webb Space Telescope (JWST) will take a VERY large mirror, 6.5 meters in diameter, into space, and send the light it collects to a suite of 4 main instruments. Those instruments cover the range of ...
Q: What is the wavelength coverage of JWST's instruments?
The answer as illustrated here and at this ESA document.
We can't cover everything, of course, but let's talk about just a few of the most common features of emission in near- and mid-infrared wavelengths.
The first three are basically the same as the common emission mechanisms in the optical. Stars emit a continuum due to blackbody radiation; much of it lies in the optical, but a fair amount falls into the IR, too.
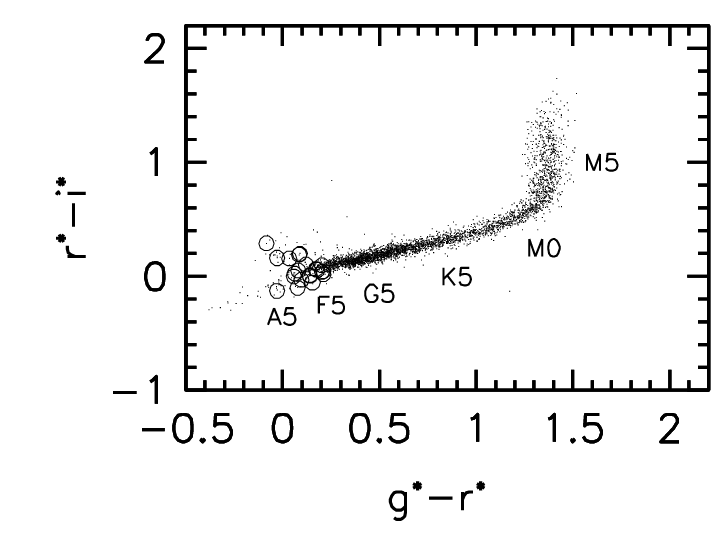
Taken from Figure 1 of
Finlator et al., AJ 120, 2615 (2000)

Taken from Figure 5 of
Finlator et al., AJ 120, 2615 (2000)
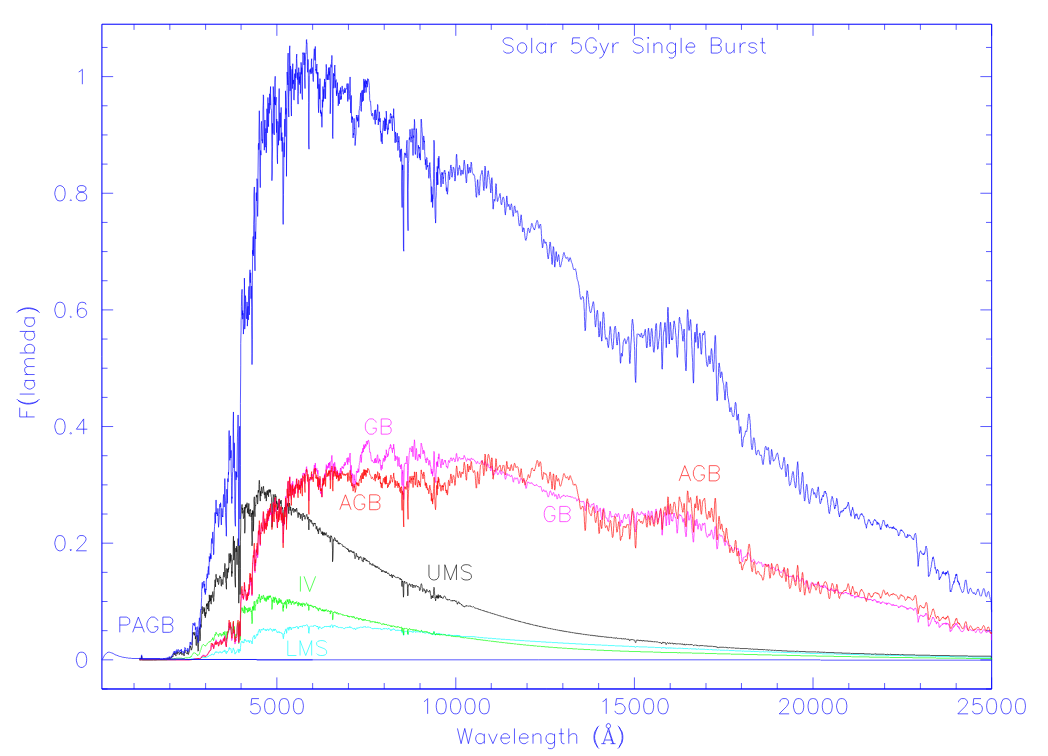
Figure 8 taken from
Pickles, PASP 110, 863 (1998)
The absorption lines in stellar atmospheres we see in the optical, due to electronic transitions within atoms and ions, have counterparts in the near-IR.
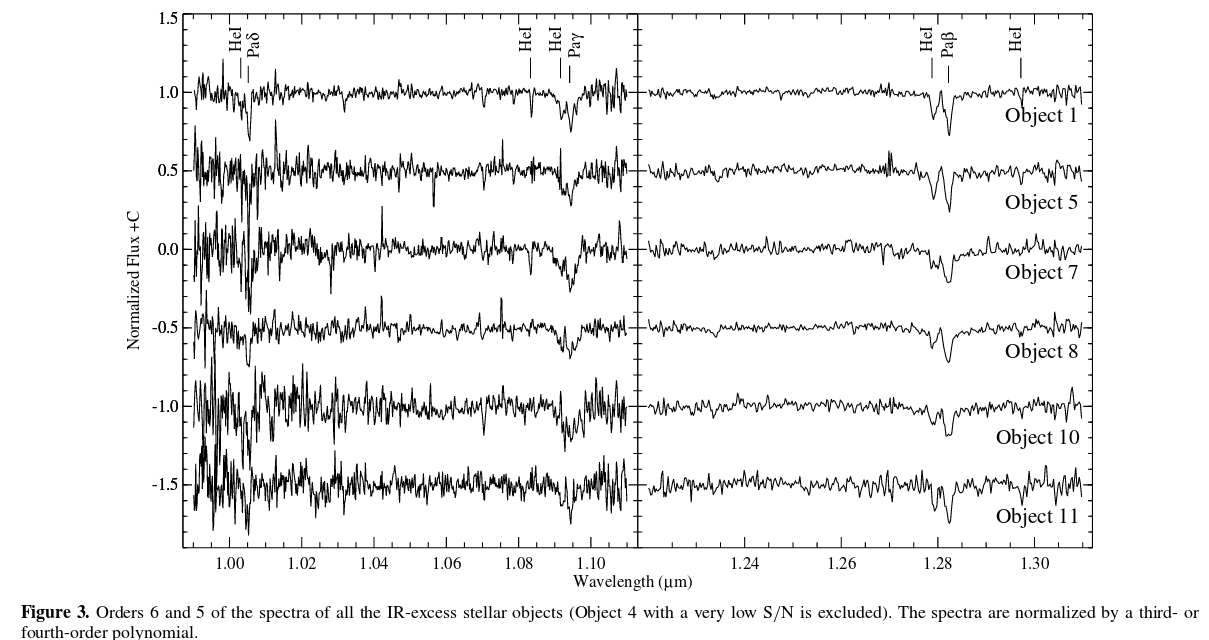
Figure 3 taken from
Kim, Koo, and Moon, ApJ 774, 5 (2013)
Sharp, narrow emission lines from hot gas appear in the spectra of planetary nebula in the optical,
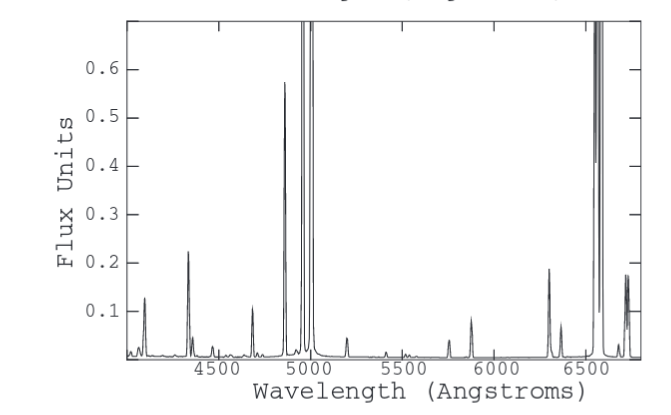
Figure 1 taken from
O'Dell, Henney, and Sabbadin, AJ 137, 3815 (2009)
and in the IR, too:
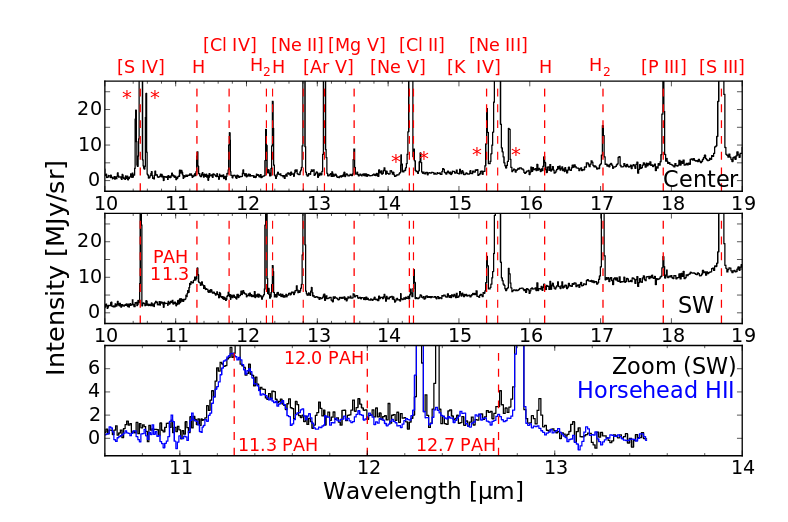
Figure 2 taken from
Cox et al., MNRAS 456, 89 (2016)
But ... wait a moment. The infrared spectrum shows something new and different, which does not appear in the optical spectrum.
Q: What new type of feature appears in the IR spectrum?
Yes, that's right: the very broad line labelled "PAH". This radiation comes from complex molecules called "polycyclic aromatic hydrocarbons", a few examples of which are shown below.
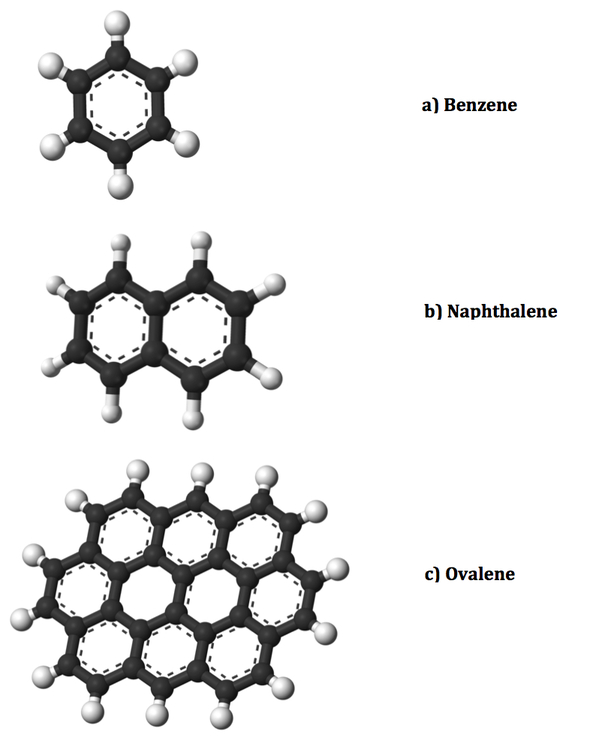
Figure courtesy of
Landmarks of the ISM
When atoms combine into molecules, they gain new ways to absorb and emit photons. For example, the molecules may rotate or vibrate at a range of frequencies, or they may bend and wiggle back and forth. Some forms of these molecular transmissions yield broad features, due to blends of emission from molecules with small differences. Others create characteristic bands of lines in a series; the example below shows the 2.29-micron bandhead of CO.
Infrared spectra of stars near Sgr A* courtesy of
Eckart, Ott, and Genzel, and GCNEWS (1999)
Because these molecular transitions are typically much lower in energy than the electronic transitions of individual atoms and ions, we see the radiation produced by them in the infrared. So, looking in the infrared allows us to detect and measure the presence of molecules, instead of atoms. That's new.
But that's not all. When we look in the optical, we see (for the most part) objects which are hot enough to emit at visible wavelengths (stars) or very large objects which are illuminated by very hot objects (planets). What we can't see are objects which have much lower temperatures -- of hundreds Kelvin, instead of thousands. But cool objects emit copious amounts of infrared radiation.
One of the forms of matter which we dominates our views in the infrared is warm dust.
  Q:  What make dust so prominent in infrared surveys?
          Provide two important reasons.

      1) dust is very _____________

      2) dust is very _____________
Okay, the first part is pretty obvious: there must be a lot of dust out there. Our current theories of planet formation suggest that when a proto-stellar nebula collapses, a great deal of dust is formed very early on. Some of it coagulates into larger particles (rocks), which may collide and form even larger objects (asteroids and planets), but a great deal remains in the form of tiny particles.
But why is it important that dust is SMALL? Well, it has something in common with the reason why the largest insects on Earth were "only" this big:

Image of meganeura model courtesy of
Land of the Dead
Insects, you see, don't have lungs and circulating fluid to transport oxygen from the atmosphere into their bodies, as we vertebrates do. They rely largely on diffusion to move oxygen into their cells, and carbon dioxide out of them. And that means that no portion of an insect's inner body can be more than a few centimeters (or in most cases, a few millimeters) from its surface.
In other words, small objects have large ratio of surface area to interior volume. Since insects need this large ratio to breathe, they can't grow very large.
What does all this have to do with infrared emission from dust particles? Well, let's take a bunch of matter -- iron, oxygen, hydrogen, etc. -- and form it into two piles of equal mass, and equal density. Each will have 1 Earth mass = 5.98 x 1024 kg and density = 5510 kg/cubic meter.
  Q:  How many big particles are there?

  Q:  How many small particles are there?
Now, suppose we set all the particles, big and small, to the same temperature. Let's pick T = 270 Kelvin, which is roughly the temperature of the real Earth. The particles will all emit blackbody radiation, with a total luminosity of
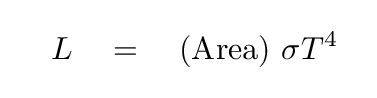
  Q:  What is the luminosity of the single big sphere?

  Q:  What is the luminosity of the many little spheres?
The moral of the story is that dust particles can produce LOTS of infrared!
When we look at many galaxies in the infrared, we see that their overall luminosity is often dominated by dust.
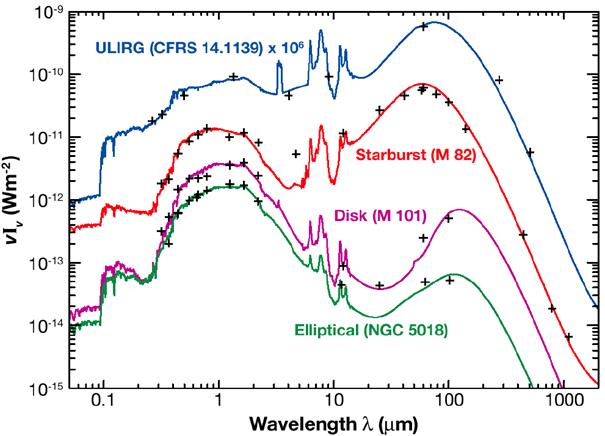
Image 184 from
Infrared Astronomy
edited by L. Viktor Toth
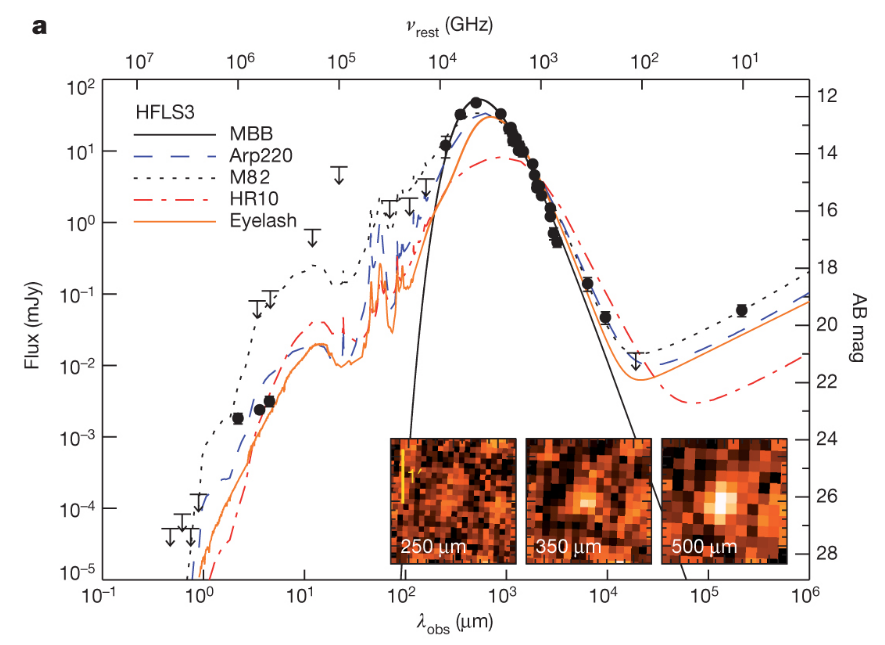
Figure 2a taken from
Riechers et al., Nature 496, 329 (2013)
It might be useful to note a few numbers: the temperatures of blackbodies which have peak emission at some representative temperatures.
In summary, infrared instruments allow us to see an entirely new feature in the celestial landscape -- one which is entirely invisible to optical devices!
The ability to detect dust and other cool components of the interstellar zoo would seem to be a strong reason to build and use infrared telescopes ... but it's not the only one. In some cases, we may be interested in plain old stars (which certainly do emit plenty of light in the optical), but need to look in the infrared anyway.
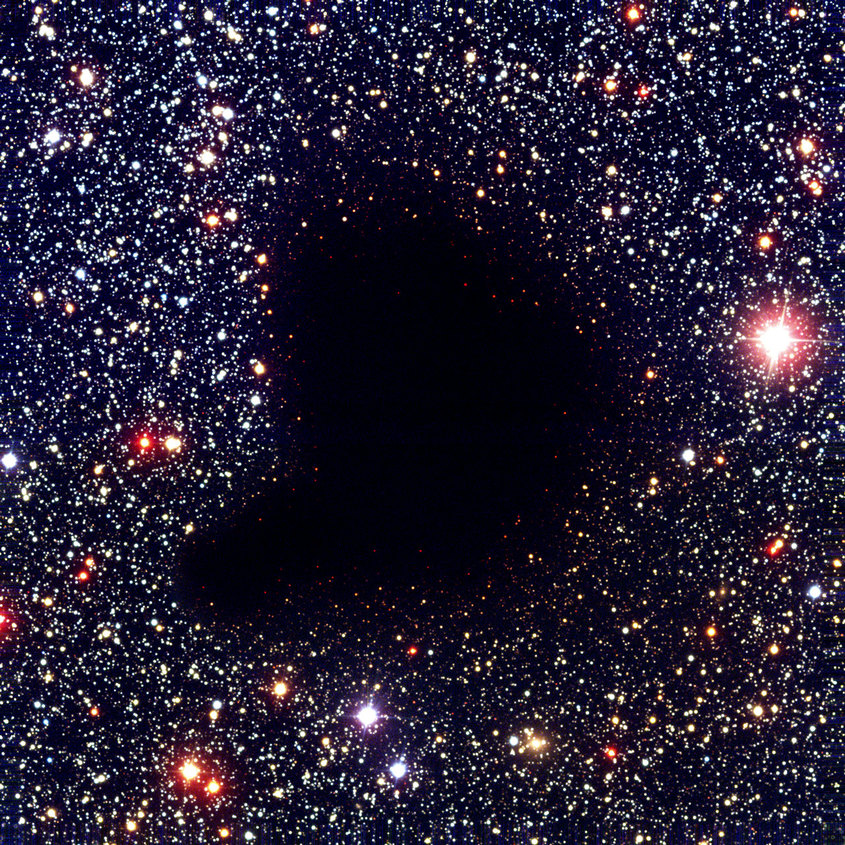
Image courtesy of
ESO
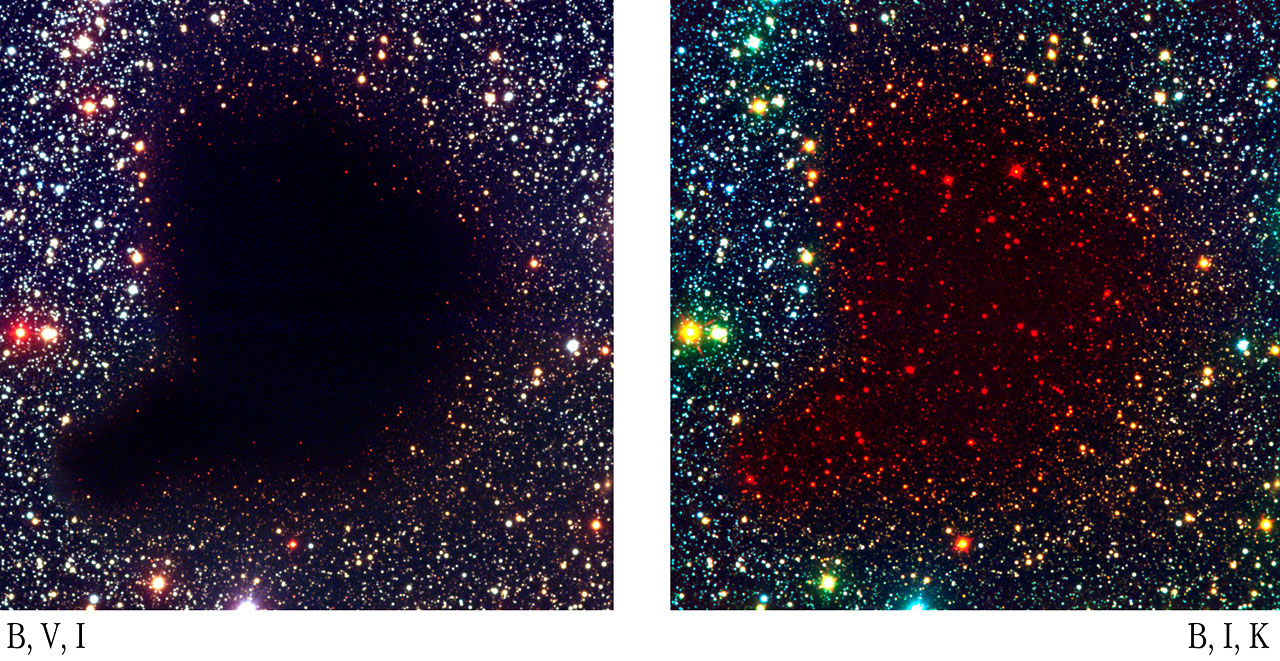
Image courtesy of
ESO
          Q:  Use the  SkyView Query Form  to request an image
                  of Sgr A* (the center of our Galaxy) taken with the "DSS2 Red" survey.
                  Use 600 pixels and a 1 degree field.
          Q:  Use the  SkyView Query Form  to request an image
                  of Sgr A* taken with the "Wise 22 micron" survey.
                  Use 600 pixels and a 1 degree field.
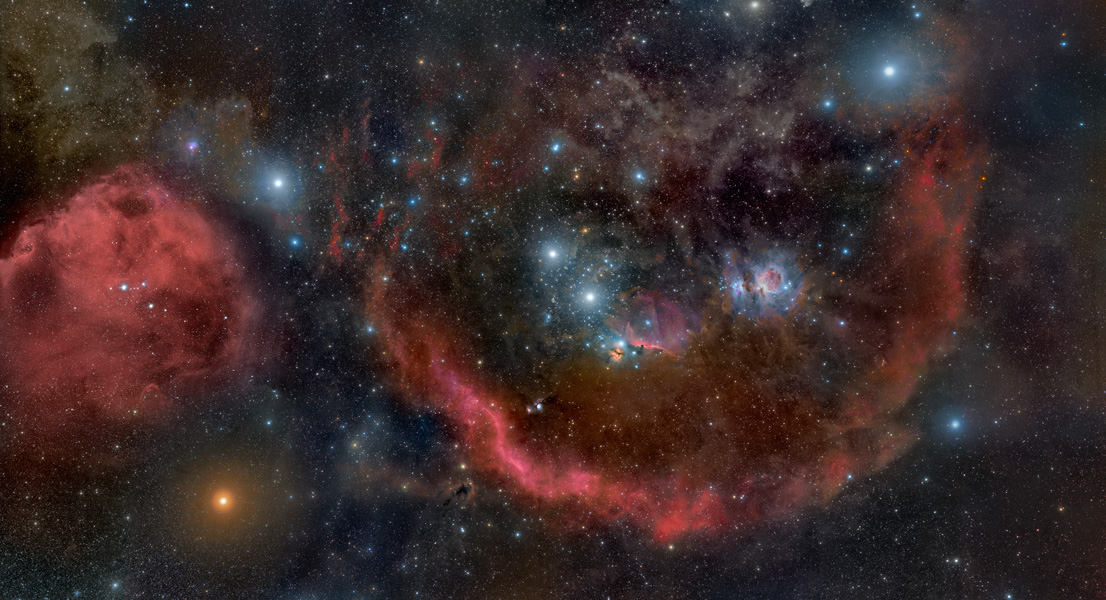
Image of Orion courtesy of
APOD and
Rogelio Bernal Andreo
But if the gas lies in a galaxy which is moving away from us at high speed, the light it emits will be shifted to a longer wavelength. The relationship between the rest wavelength and observed wavelength is simple, if the recession velocity is small compared to the speed of light; using the shorthand β = v/c,

But if the recession velocity grows to a significant fraction of the speed of light, we need to use a somewhat more complicated formula:
Astronomers -- particularly observational types like me -- often aren't so interested in the exact value of the velocity of distant galaxies. Instead, we are content to describe them by the simple ratio of the observed and rest wavelengths, a quantity known as redshift.
Plenty of astronomers study galaxies and quasars at redshifts of z = 1 or higher. The most distant galaxies we have observed at the current time are around z = 7 or so.
       Q:  At what wavelength must we observe to see H-alpha
                 at a redshift of z = 1?


       Q:  At what wavelength must we observe to see H-alpha
                 at a redshift of z = 7?
In fact, astronomers interested in distant galaxies often pay more attention to the Lyman-alpha line of hydrogen, which is produced when an electron jumps down from the n=2 state to the ground n=1 energy level.
        Q:  What is the energy of a Lyman-alpha photon in eV?

        Q:  What is the rest wavelength of a Lyman-alpha photon?

        Q:  What region of the electromagnetic spectrum is that?
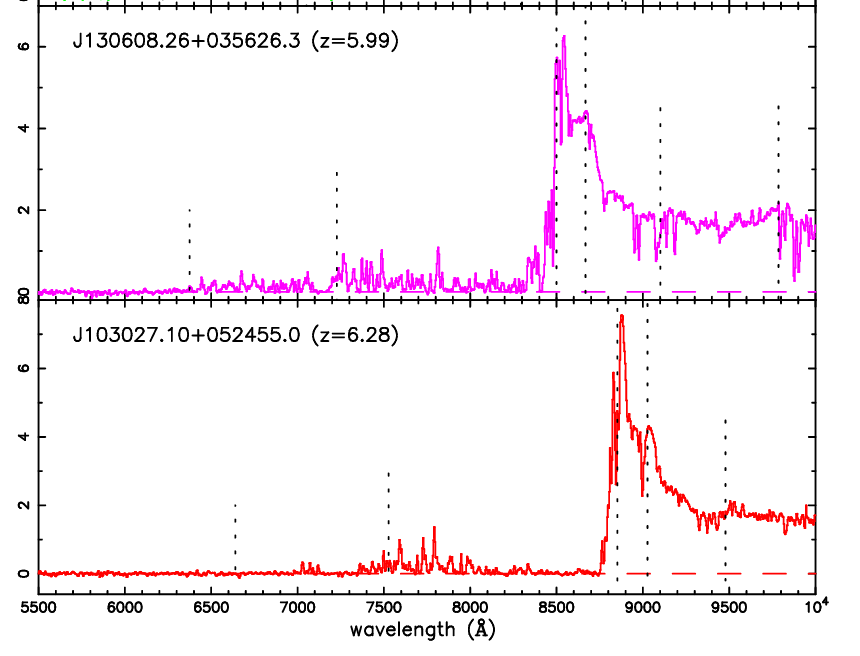
Below are a couple of spectra of some distant galaxies with strong Lyman-alpha emission lines. Can you figure out their redshifts?
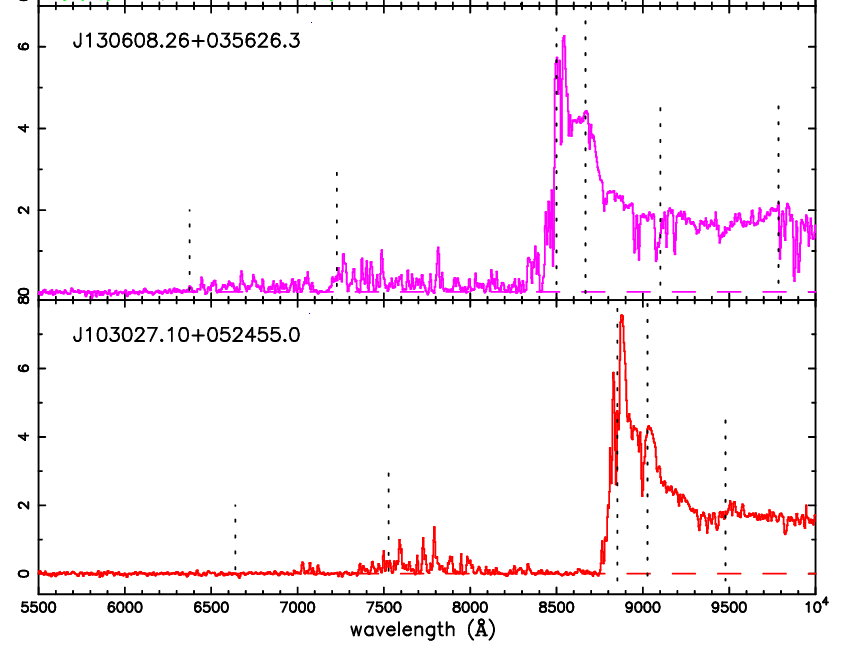
Figure 1, slightly modified, from
Becker et al., AJ 122, 2850 (2001)
But suppose that we want to discover the very earliest galaxies, back when they were first forming. They might appear as early as z=10 or z=12.
        Q:  At what wavelength would Lyman-alpha appear in a galaxy
                     at z = 10?


        Q:  What region of the electromagnetic spectrum is that?
So, yes, the infrared is vital for studying galaxies at high redshift.
Copyright © Michael Richmond.
This work is licensed under a Creative Commons License.