 Copyright © Michael Richmond.
This work is licensed under a Creative Commons License.
Copyright © Michael Richmond.
This work is licensed under a Creative Commons License.
For the purposes of this week's discussion, I'm going to split the infrared spectrum into two pieces: I'll call the region from 1 - 30 microns the "near-IR", even though most people reserve that terms for 1 - 3 microns or so, and leave everything greater than 30 microns to the "far-IR". There just isn't enough time (and I don't have the expertise) to look at material in a closer manner.
Optical detectors -- CCDs and CMOS -- are based on the interaction of light and a silicon wafer: one photon striking the silicon gives one electron enough energy to jump the "band gap" and promote it from the valence band to the conduction band. That electron can then be corraled by electric fields and shifted (together with other electrons) across the chip to an amplifier, where its charge is measured. This works very well with optical photons, because the band gap in silicon is about 1.1 electron volts.
Now, if we consider the relationship between energy and wavelength, we can figure out the critical wavelength cutoff for silicon: the wavelength of a photon which can just barely give an electron enough energy to jump to the conduction band.
Q: What it the critical wavelength for silicon?
Clearly, if we want to detect infrared photons, silicon won't work. We need materials with smaller band gaps. Some of the most popular materials for astronomical purposes are listed below. Since these are all compounds, the exact values of the band gap are flexible (add more of this or less of that); the values I've listed are simply representatives.
HgCdTe, in particular, has a band gap which can vary by more than a factor of two from one sensor to another, based on the exact doping values chosen by the manufacturer.
                        HgCdTe                InSb              Si:As
--------------------------------------------------------------------------

 which elements?


 band gap (eV)           0.50                 0.22              0.043


 cutoff (microns)


 op temp (K)              78                   32                 6


---------------------------------------------------------------------------
Note the general trend: the farther into the infrared one works, the cooler one must keep the detector.
  Q:  Why is there a connection between operating temperature
            and wavelength?
All of these materials work in the same general mode as silicon detectors: one incoming photon produces one free electron. But there is a big difference in another respect: humans have developed readout electronics based on silicon wafers which work very well; but we haven't done so for these other materials. In other words, our detectors will generate electrons ... but won't be able to count them!
The solution to this puzzle is a clever bit of brute force: make a sandwich consisting of an upper layer for creating the electrons, and a lower silicon layer for counting them. Connect the two layers with a series of little chunks of indium, one per pixel.
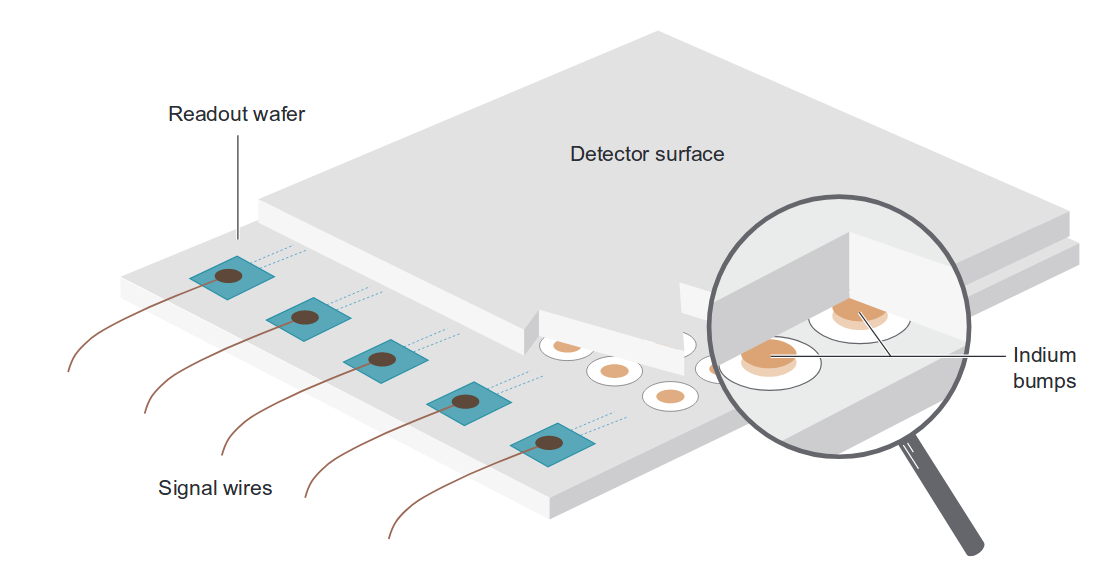
Figure 4 taken from
Rieke, ARA&A 45, 77 (2007)
These so-called "hybrid arrays" are becoming more common, and larger, as time passes. Some are up to 2048x2048 in size.
Note that these designs place an amplifier within each pixel of the lower, silicon layer; in that way, they are more like CMOS than CCD detectors. That's an important point for the infrared, because (as mentioned again below), as one moves into the "thermal infrared" region of the spectrum, the sky itself glows brightly. In order to prevent saturation, it becomes necessary to take relatively short exposures, sometimes just a few seconds long. It's much easier to read out a detector quickly if we don't have to waste time shifting charge from one side to the other.
What can we do to make telescopes provide a better view of light in the infrared? There are several things -- some relatively easy, and some a lot more difficult. Let's look at a few of the possibilities.
First, a very simple (and not too expensive) choice: avoid the outer edges of the primary mirror. As mentioned earlier, the telescope structure and its surroundings will emit significant amounts of radiation at wavelengths of 5 or 10 (or more) microns. Even though the optics of a big telescope are very carefully designed, with plenty of baffles to stop stray light, they aren't perfect: some light from the structure may bounce off the very outer edge of the primary mirror and make it to the focal plane. Baffles can't completely solve this problem because, at long wavelengths, they emit light, too!
So, if we arrange the optics so that only light rays from the inner portions of the primary should reach the detector, we can avoid some of this stray light. When I write "inner portions", I mean "most of the mirror, except for a narrow ring around the outer edge." For example,
                 primary mirror diameter         diameter of active region
----------------------------------------------------------------------------
   SOFIA               2.7 m                            2.5 m

   IRTF                3.2 m                            3.0 m
----------------------------------------------------------------------------
In a similar manner, we can reduce the amount of emission from our optics if we reduce their size. In particular, shrinking the size of the secondary mirror is common in infrared-optimized telescopes. Let's compare the sizes of primary and secondary in some older, "designed for optical" telescopes with those of some newer "infrared-ready" instruments.
                primary diameter P   secondary diameter S      ratio S/P
----------------------------------------------------------------------------

   Palomar Hale    200 inch                  41 inch

   KPNO Mayall     4.0 m                     0.74 m


   IRTF            3.2 m                     0.24 m

   SOFIA           2.7 m                     0.35 m

   TAO             6.5 m                     0.90 m

----------------------------------------------------------------------------
Maybe the BEST way to improve a telescope for infrared observations is to place it at a high altitude. As we have discussed previously, the Earth's atmosphere blocks a good portion of the infrared light from reaching the surface. The exact amount transmitted depends to a large extent upon the amount of water vapor above the telescope -- which can be minimized by going to high places.
Notice, for example, how the VLT has no real chance to observe light around 30 microns, while the Tokyo Atacama Observatory (TAO) can at least give it a try.
![]()
Figure 2 taken from
Yoshii et al., SPIE2010
Below are images taken at wavelengths of 25, 31 and 37 microns with the MAX38 instrument and mini-TAO 1-meter telescope at the TAO site in Chile. The airglow is so strong at this mid-IR wavelengths that the "exposure times" for these images were 1/50 of a second!
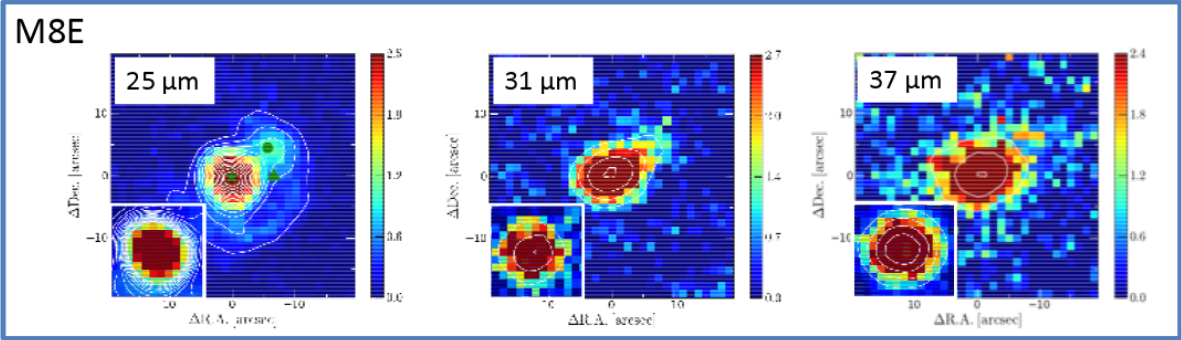
Images taken from the poster
Observation of Massive Star Forming Regions at 30 Microns
by Uchiyama et al., at Protostars and Planets VI, Heidelberg, July 15-20, 2013
Mountaintops are good, but an even better location for an infrared telescope would be aboard a high-flying airplane.
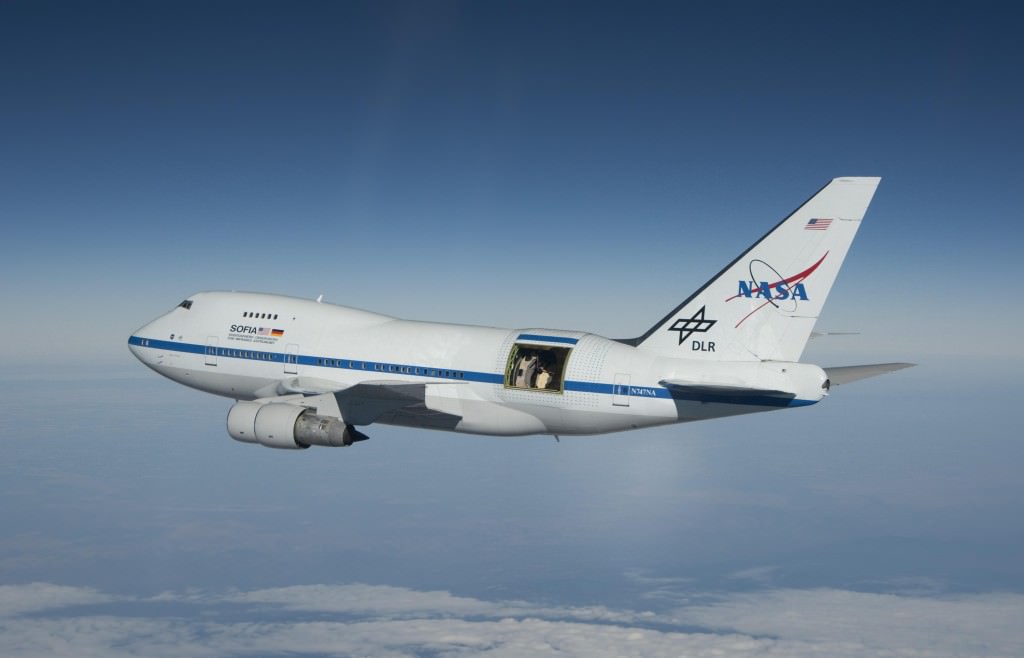
Image courtesy of
Universe Today and NASA/Jim Ross.
Stratospheric Observatory for Infrared Astronomy (SOFIA) is a 2.7-meter telescope (of which only 2.5-m are used) inside a modified 747 airplane. It flies for observing runs of up to 12 hours, at altitudes of 12 to 14 km above sea level.
Alas, SOFIA's operations ended Sep 30, 2022
Now, the atmosphere's density decreases in an exponential manner with altitude, something like
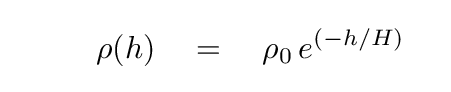
where H is the scale height of the atmosphere. The amount of water vapor varies quite a bit from place to place, and from time to time, due to, well, weather; but we can use the density of ordinary air to get a rough idea of what should be happening to water vapor as well.
  Q:  Write an expression which gives the total amount of
             air above sea level (height h = 0).


  Q:  Write an expression which gives the total amount of
             air above a height h1.


  Q:  Write an expression which gives the FRACTION of all air
             above a height h1.
Let's use your formula to fill in the following table. We can adopt a value H = 7600 m, which (again) is appropriate for ordinary air, not water vapor.
Observatory          altitude (m)       fraction of air above it
---------------------------------------------------------------------------
   RIT                   168

   Kitt Peak            2096

   Mauna Kea            4200

   TAO                  5600

   SOFIA               13000

---------------------------------------------------------------------------
Because it flies so high, SOFIA includes instruments which can measure light over the range 0.3 - 1600 microns! That's ... well beyond the "near-IR" that we are concentrating on today!
![]()
Graphic taken from
SOFIA technical brochure
As an example of SOFIA's capabilities, you may have heard about (another) recent discovery of water on the Moon:
As one moves from 1 or 2 microns to 5 or 10 microns, observing becomes much more difficult for ground-based astronomers. The problem is that at these wavelengths, thermal emission from the earth's atmosphere, and from the telescope itself, start to compete with emission from celestial sources.
  Q:  Suppose the air, or the telescope mirror, has an average
           temperature of 280 K.  At what wavelength will its
           blackbody emission (energy per unit wavelength) reach a peak?
What this means is that even on the darkest, clearest nights, the air itself is glowing -- as is the telescope! Ground-based astronomers cannot avoid gathering many, many photons from these contaminating sources every time they take an image of their targets. To make matters worse, in most cases, the target is much fainter than the sky and the telescope. What can we do?
Well, the first thing is to decrease the exposure time. As the sky glows brighter and brighter, it contributes so many photons to an image that it would saturate the detector if we left the shutter open for 5 minutes, or 1 minute, or perhaps even 20 seconds. The only way to avoid saturation is to take very short exposures -- lots and lots and LOTS of them -- and then combine them properly later.
The next technique is chopping. As we take these short exposures, we "chop" the secondary mirror (or some other bit of optics) back and forth rapidly by a small angle, taking a sequence of pictures which alternates A - B - A - B - A - B - A - B and so forth. Infrared telescopes often have a specially mounted secondary mirror with a motor to drive this rapid chopping.
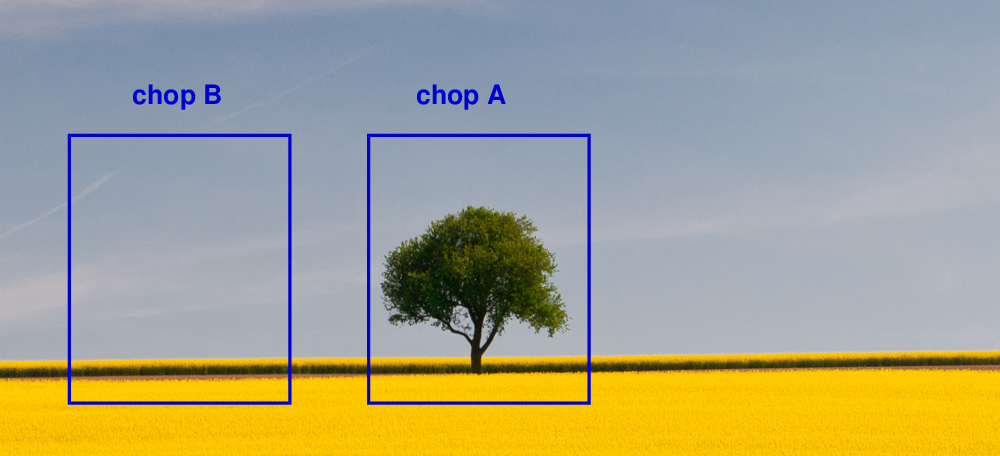
Image courtesy of
Summit Workshops and
Darren Rowse
If we move only a small angle away from our target (less than one degree, perhaps), then the glowing air over in the "B" direction might be pretty much the same as that directly in front of our object in the "A" direction. So, if we subtract "A" - "B", we might be able to remove most of the airglow.
But ... wait. The air isn't the only glowing contaminant. There's also the telescope structure and mirrors and surroundings. When we chop the secondary from "A" to "B", it will reflect different portions of the structure, creating a different pattern of glowing telescope in the two positions.
  Q:  Is there any way to account for the changes in
          reflected telescope light?
The answer is, fortunately, yes. Let's move the entire telescope so that it points to a location in the sky which is just the same angular distance away from the source, but over to the other side. Moving the entire telescope takes a long time, so we can't do it as quickly as chopping. This slow rocking motion is called nodding.
In the picture below, the telescope have moved from its initial position (which we could call "nod A") to the right; now, when the telescope chops left, it ends up back at the target.
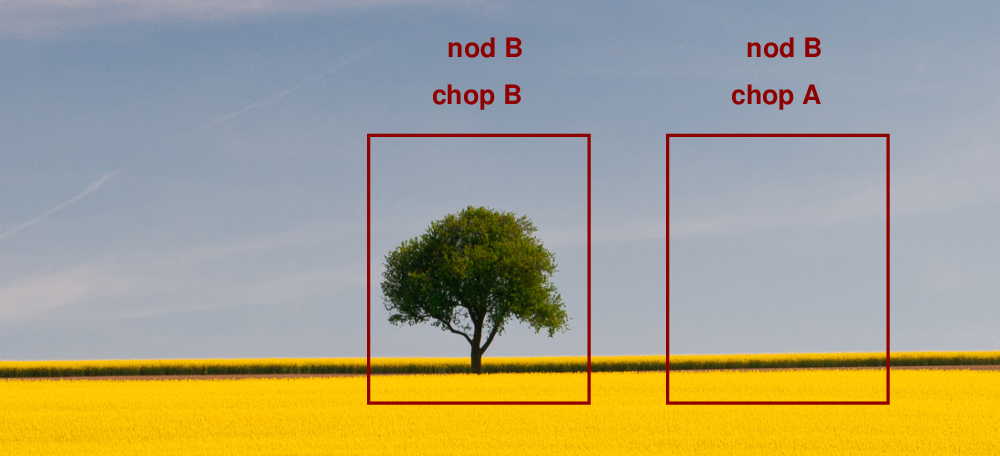
Image courtesy of
Summit Workshops and
Darren Rowse
So the observing sequence might go something like this:
   Nod A:  chop A - B - A - B - A - B - A - B - A - B

   Nod B:  chop A - B - A - B - A - B - A - B - A - B

   Nod B:  chop A - B - A - B - A - B - A - B - A - B

   Nod A:  chop A - B - A - B - A - B - A - B - A - B

       etc.
"Wait a moment," you say, "why did you schedule two nod B's in a row, instead of alternating nod A - nod B - nod A - nod B?" The answer is described in very careful detail in Kevin Volk's chop-and-nod document. All I will say here is that if there are slow and gradual changes in the sky over time, this ABBA pattern can do a slightly better job of removing the time variations than an ABAB pattern.
And once we have acquired our images, we can compute a few differences and eventually isolate our target from all the foreground noise.
All that should remain is the desired celestial source(s). Of course, if the sky isn't perfectly uniform on these small angular scales, there will be some leftover sky, too, but at least this is a step in the right direction.
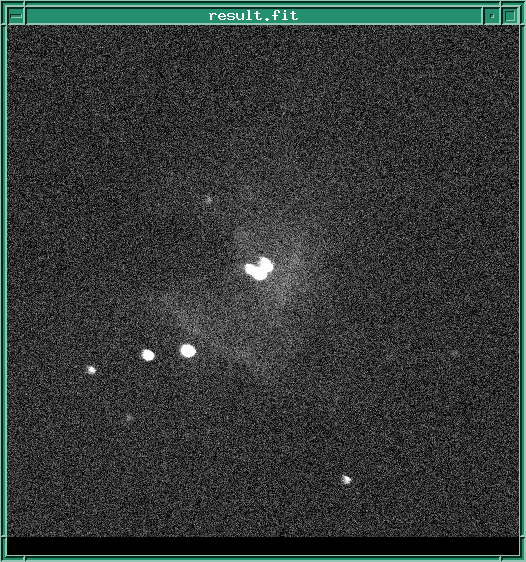
Let's see how this works, in action. First, we point the telescope slightly to the left of the target -- nod position A -- and chop it back and forth. We build up two images, one of the target itself, and one just to its left side.
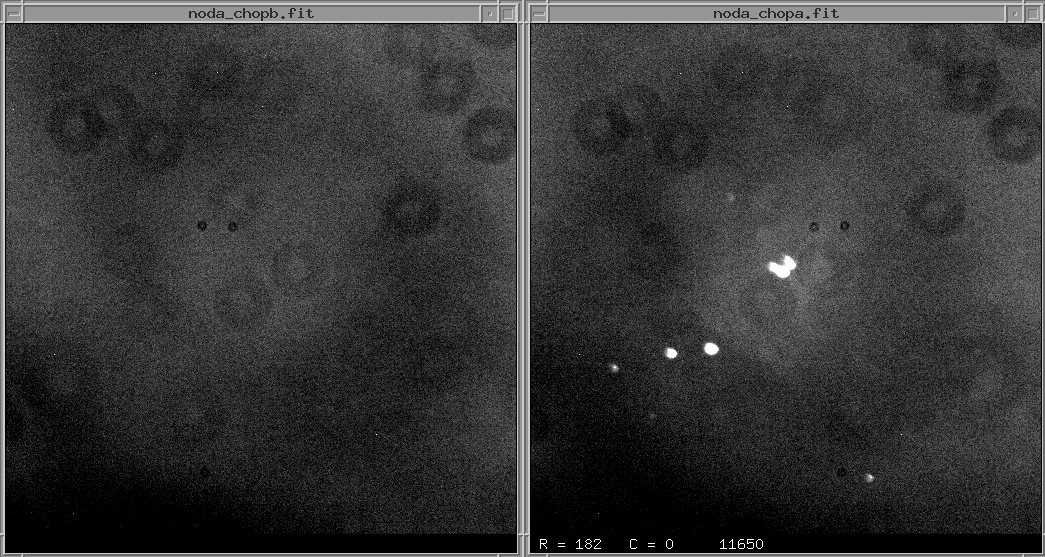
Now, we move the telescope so it lies on average to the right of the target -- nod position B -- and chop it back and forth again, building up two new images.
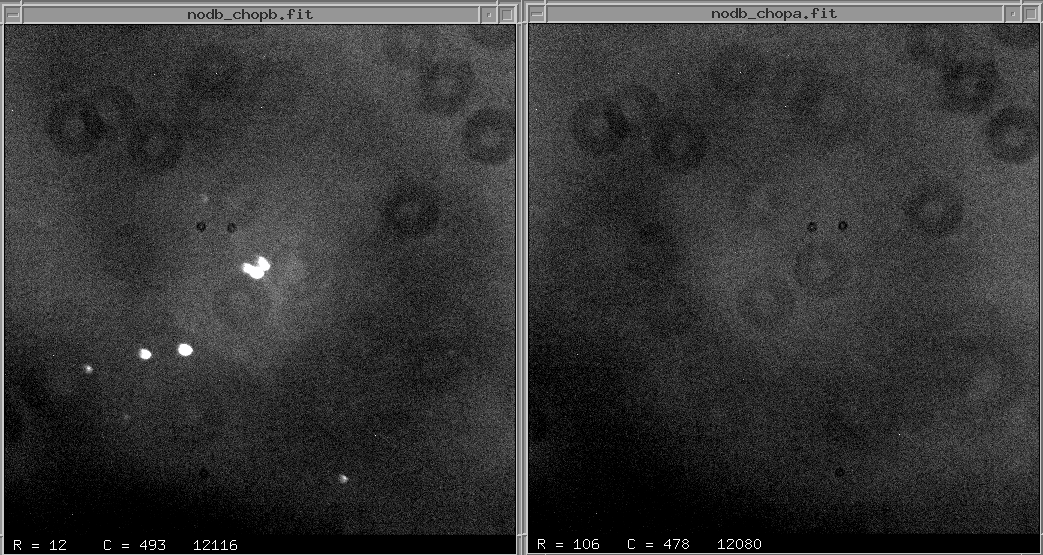
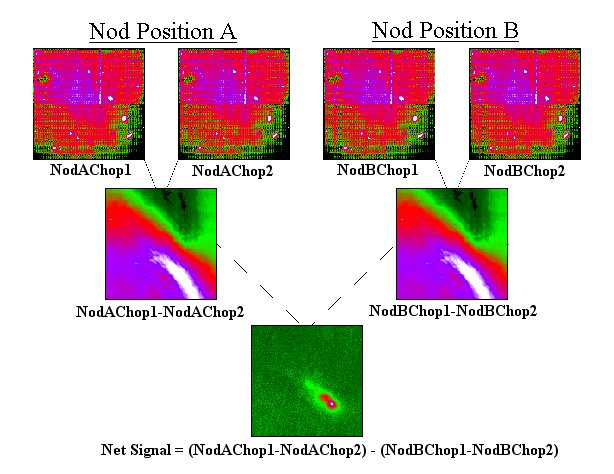
The first step in the processing is to create the difference of the two chops for position A, and the difference of the two chops for position B,
      diff1  =  noda_chopa - noda_chopb

      diff2  =  nodb_chopa - nodb_chopb
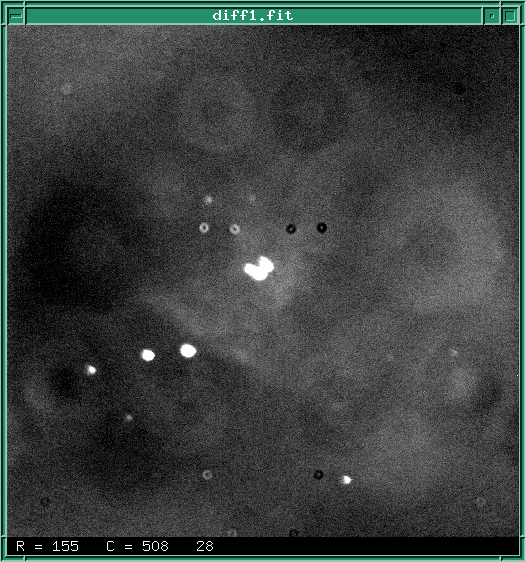
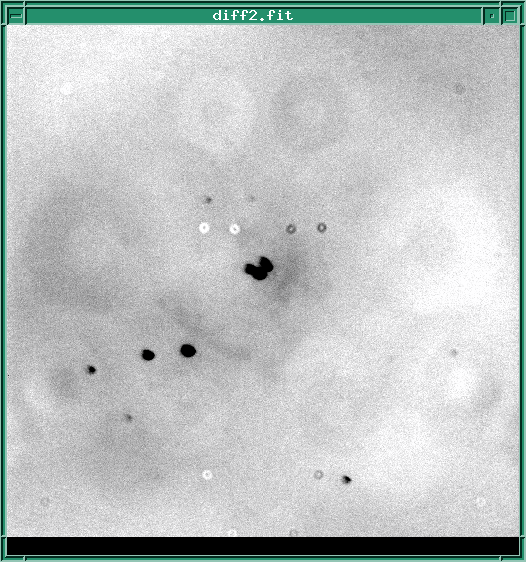
Note that these two differences yield results which appear to be the inverse of each other: in diff1, stars appear as positive (bright) pixel values, while in diff2, stars have negative (dark) pixel values.
But watch what happens when we subtract one difference image from the other:
result = diff1 - diff2
If we were to integrate on the field for a longer period of time, building up a larger and larger signal-to-noise ratio, we might eventually see a picture as pretty as this:
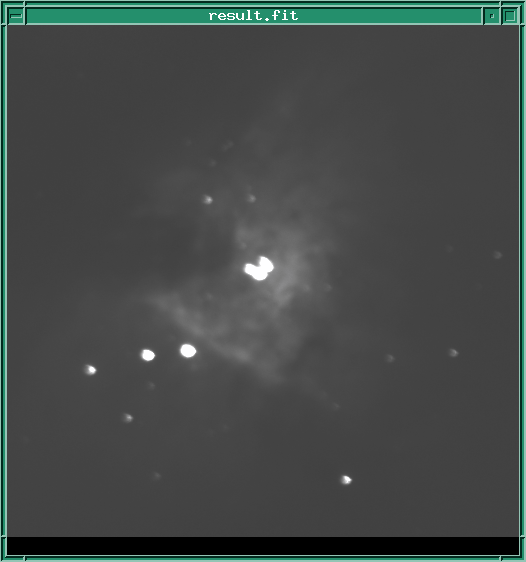
Q: Do you recognize this object?
These images aren't really infrared images taken with a nodding and chopping observing strategy; they are based on some optical images I modified and combined to simulate IR observations. But the example shown below DOES use actual IR data to illustrate the process. You can also read how signal-to-noise depends on nodding and chopping for the real low-down.
See
the FORCAST User's Manual for more information
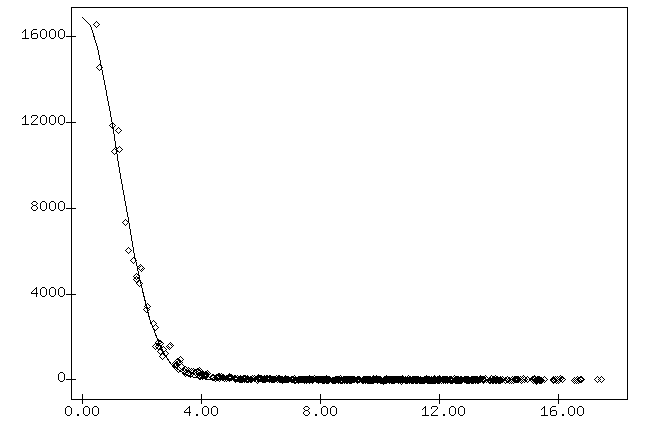
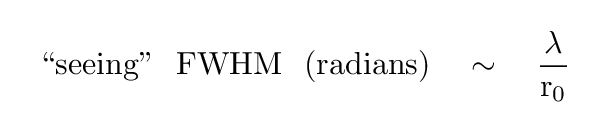
The sharpest stellar image one can achieve is set by the diffraction limit of a telescope,
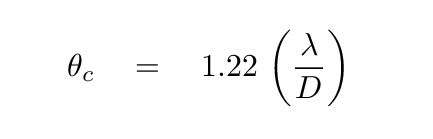
where D is the aperture of the telescope and λ the wavelength of light; the size of the central peak, θc, is here calculated in radians.
Want to convert from radians to arcseconds? Just multiply by the magic number 206265.
A perfect system would produce a Point-Spread Function (PSF) which has a sharp central peak with this angular width and a series of low-level rings surrounding it.
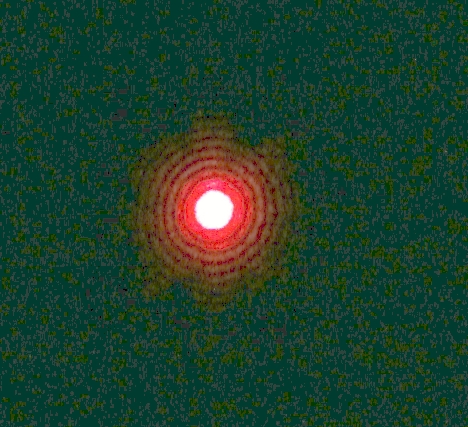
Image taken from
experiments done at Cal State LA
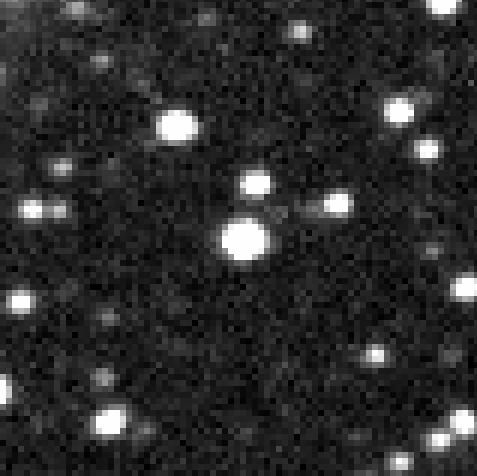
Real stellar images very rarely show this beautiful pattern; instead, we usually see a PSF which has been smeared out into a blob. Below, for example, is a small portion of an image taken with the 12-inch telescope at RIT Observatory, which has a plate scale of 1.4 arcsec per pixel.
  Q:  What is the theoretical size of diffraction limited
           images produced by the 12-inch telescope at 550 nm?


  Q:  What is the actual FWHM of (unsaturated) stars in the
           sample image?
As you can see, there is plenty of room for improvement.
In most cases, the reason for the smearing is motion of air in the Earth's atmosphere. As light from space zooms down toward the surface of the Earth, it passes through layers of air with slightly different temperatures and densities (and therefore different refractive indices) ... all of which are moving relative to each other.
All these motions cause light rays to wander around on the surface over time. For example, this image of Betelgeuse taken with the William Herschel 4.2-m telescope does a pretty little dance over the course of a few seconds.
Image courtesy of
Astronomy Picture of the Day, 2000 July 25
and the Applied Optics Group at Imperial College.
There are several ways to describe the behavior of light after it has passed through the atmosphere and reached your telescope. One quantity of interest is the Fried parameter r0, which can be defined roughly as "the diameter of a tube of air, stretching from top to bottom of the atmosphere, which has uniform optical properties over the time it takes light to travel through it."
At good observing sites, the Fried parameter may be 10 cm, 20 cm, or even larger.
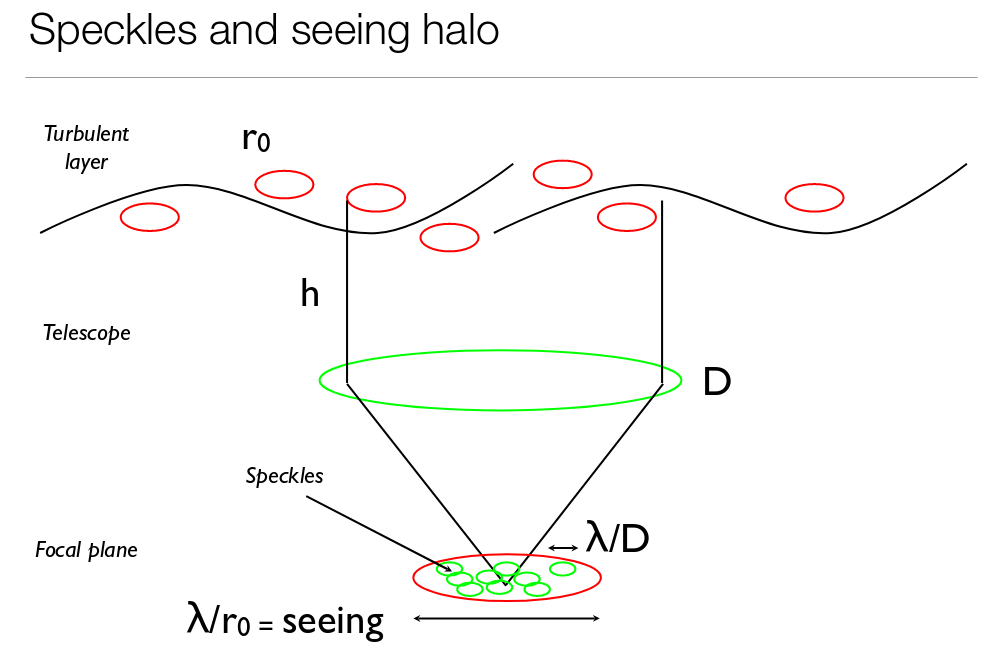
Image taken from
Atmospheric physics: turbulence, seeing, image quality
by
Dmitri Mawat, Caltech
Sometimes, having a small telescope can be an advantage! When the atmosphere is really bad, and one is looking at a bright object (such as Jupiter or Mars), it can sometimes help to STOP DOWN your aperture by placing a mask with a small hole over the front of the telescope.
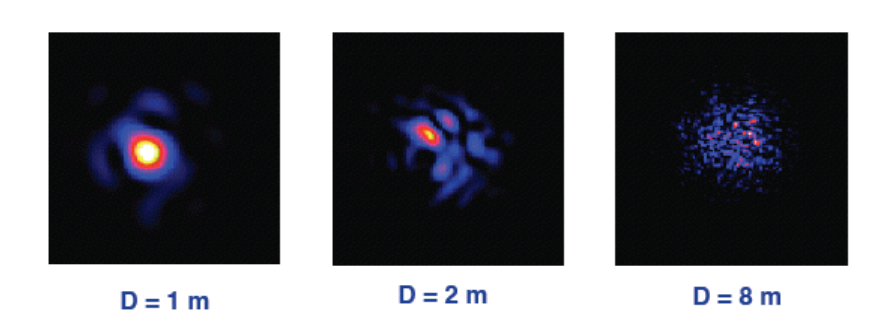
Image taken from
Atmospheric physics: turbulence, seeing, image quality
by
Dmitri Mawat, Caltech
The Fried parameter is related roughly to the size of the "seeing" = FWHM of stellar images, via the relationship
  Q:   What was the Fried parameter the night of my RIT images
             of Pluto?
Now, over the past few decades, astronomers (and defense department experts) have developed systems of "adaptive optics" which can sense the disturbences in the light waves from space due to the atmosphere and UN-DO them. The basic idea is to split the incoming light from the telescope and send some of it to a wavefront sensor, which analyzes the distortions and then sets a deformable mirror to have the shape required to remove those distortions.
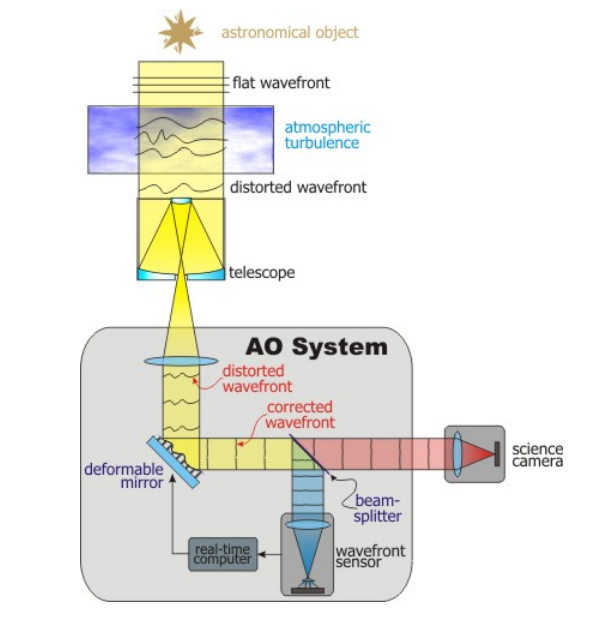
Image taken from
Notes on adaptive optics
from a class by
Stuart Littlefair at University of Sheffield
One of the difficulties with such a system is that the atmosphere changes quickly with time, and one must sense and correct those changes just as quickly as they happen. It's not easy: it requires a bright star (to provide lots of photons in a short exposure) a fast computer, and a high-tech deformable mirror system.
Just how fast must one make adjustments? Aha! This is finally when we get back to the topic of today, observing in the near-IR. It turns out that sensing and correcting atmospheric distortions is easier at long wavelengths, so adaptive optics are often used in the infrared rather than the optical.
Why?
Well, reason number one is that the atmosphere is a bit less hostile in the infrared. The index of refraction of air decreases at long wavelengths
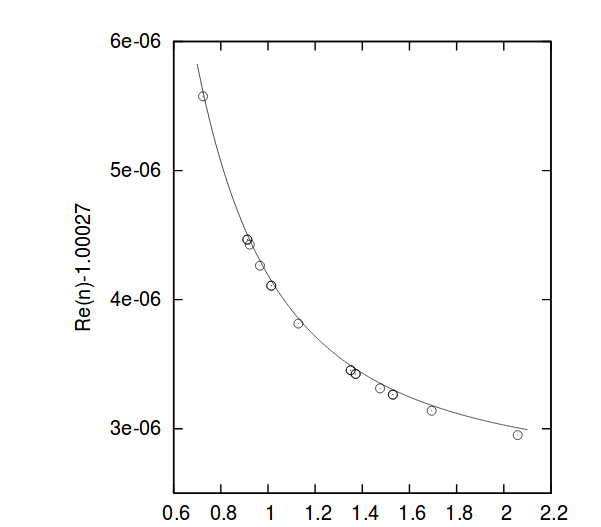
Refractive index of air as a function of wavelength (microns).
Note the y-axis for the quantity plotted -- origin not at zero.
Figure 2 taken from
Mathar, J. Opt. A: Pure Appl. Opt. 9 (5) (2007) 470-476
One of the consequences is that the Fried parameter is larger at long wavelengths:
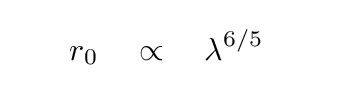
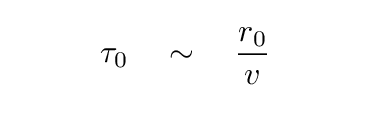
That means fewer speckles for infrared observations. Moreover, the speed of speckle motion is also slower in the infrared. The "coherence time", which is roughly the time required for the speckle pattern to change significantly, is a combination of the Fried parameter r0 (how big are the tubes of air?) and the speed of wind flow v (how fast does air flow past the tubes?):
For reasonable values of r0 = 10 cm in the visible, and v = 10 m/s = 1000 cm/s, fill in the following table.
    wavelength            Fried parameter      coherence time
     (microns)               r0 (cm)              tau (sec)
-----------------------------------------------------------------------

       0.5 = 500 nm           10


       2


       5

-----------------------------------------------------------------------
Even big telescopes have trouble collecting enough light from a typical star in a short enough time to allow for good corrections to be made in the optical. In the infrared, on the other hand, there are some very successful systems working these days.
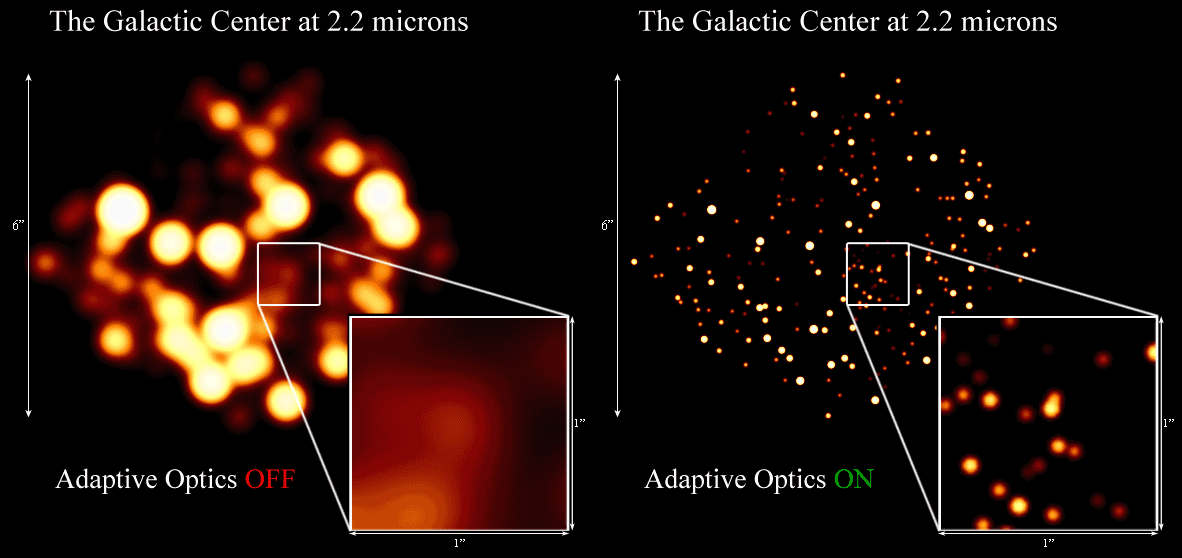
For example, the LGSAO system on the Keck Telescope provides very sharp images of the center of our Milky Way Galaxy. In the L' band (3.8 microns), the FWHM can be as small as 0.08 arcseconds!

Image courtesy of
UCLA Galactic Center Group
Perhaps you'd prefer to look at the
side-by-side version
Over several decades, very careful measurements of stellar positions in this region -- which require this pin-point sharpness -- reveal the orbits of a number of bright stars around the black hole at the center of our Galaxy.
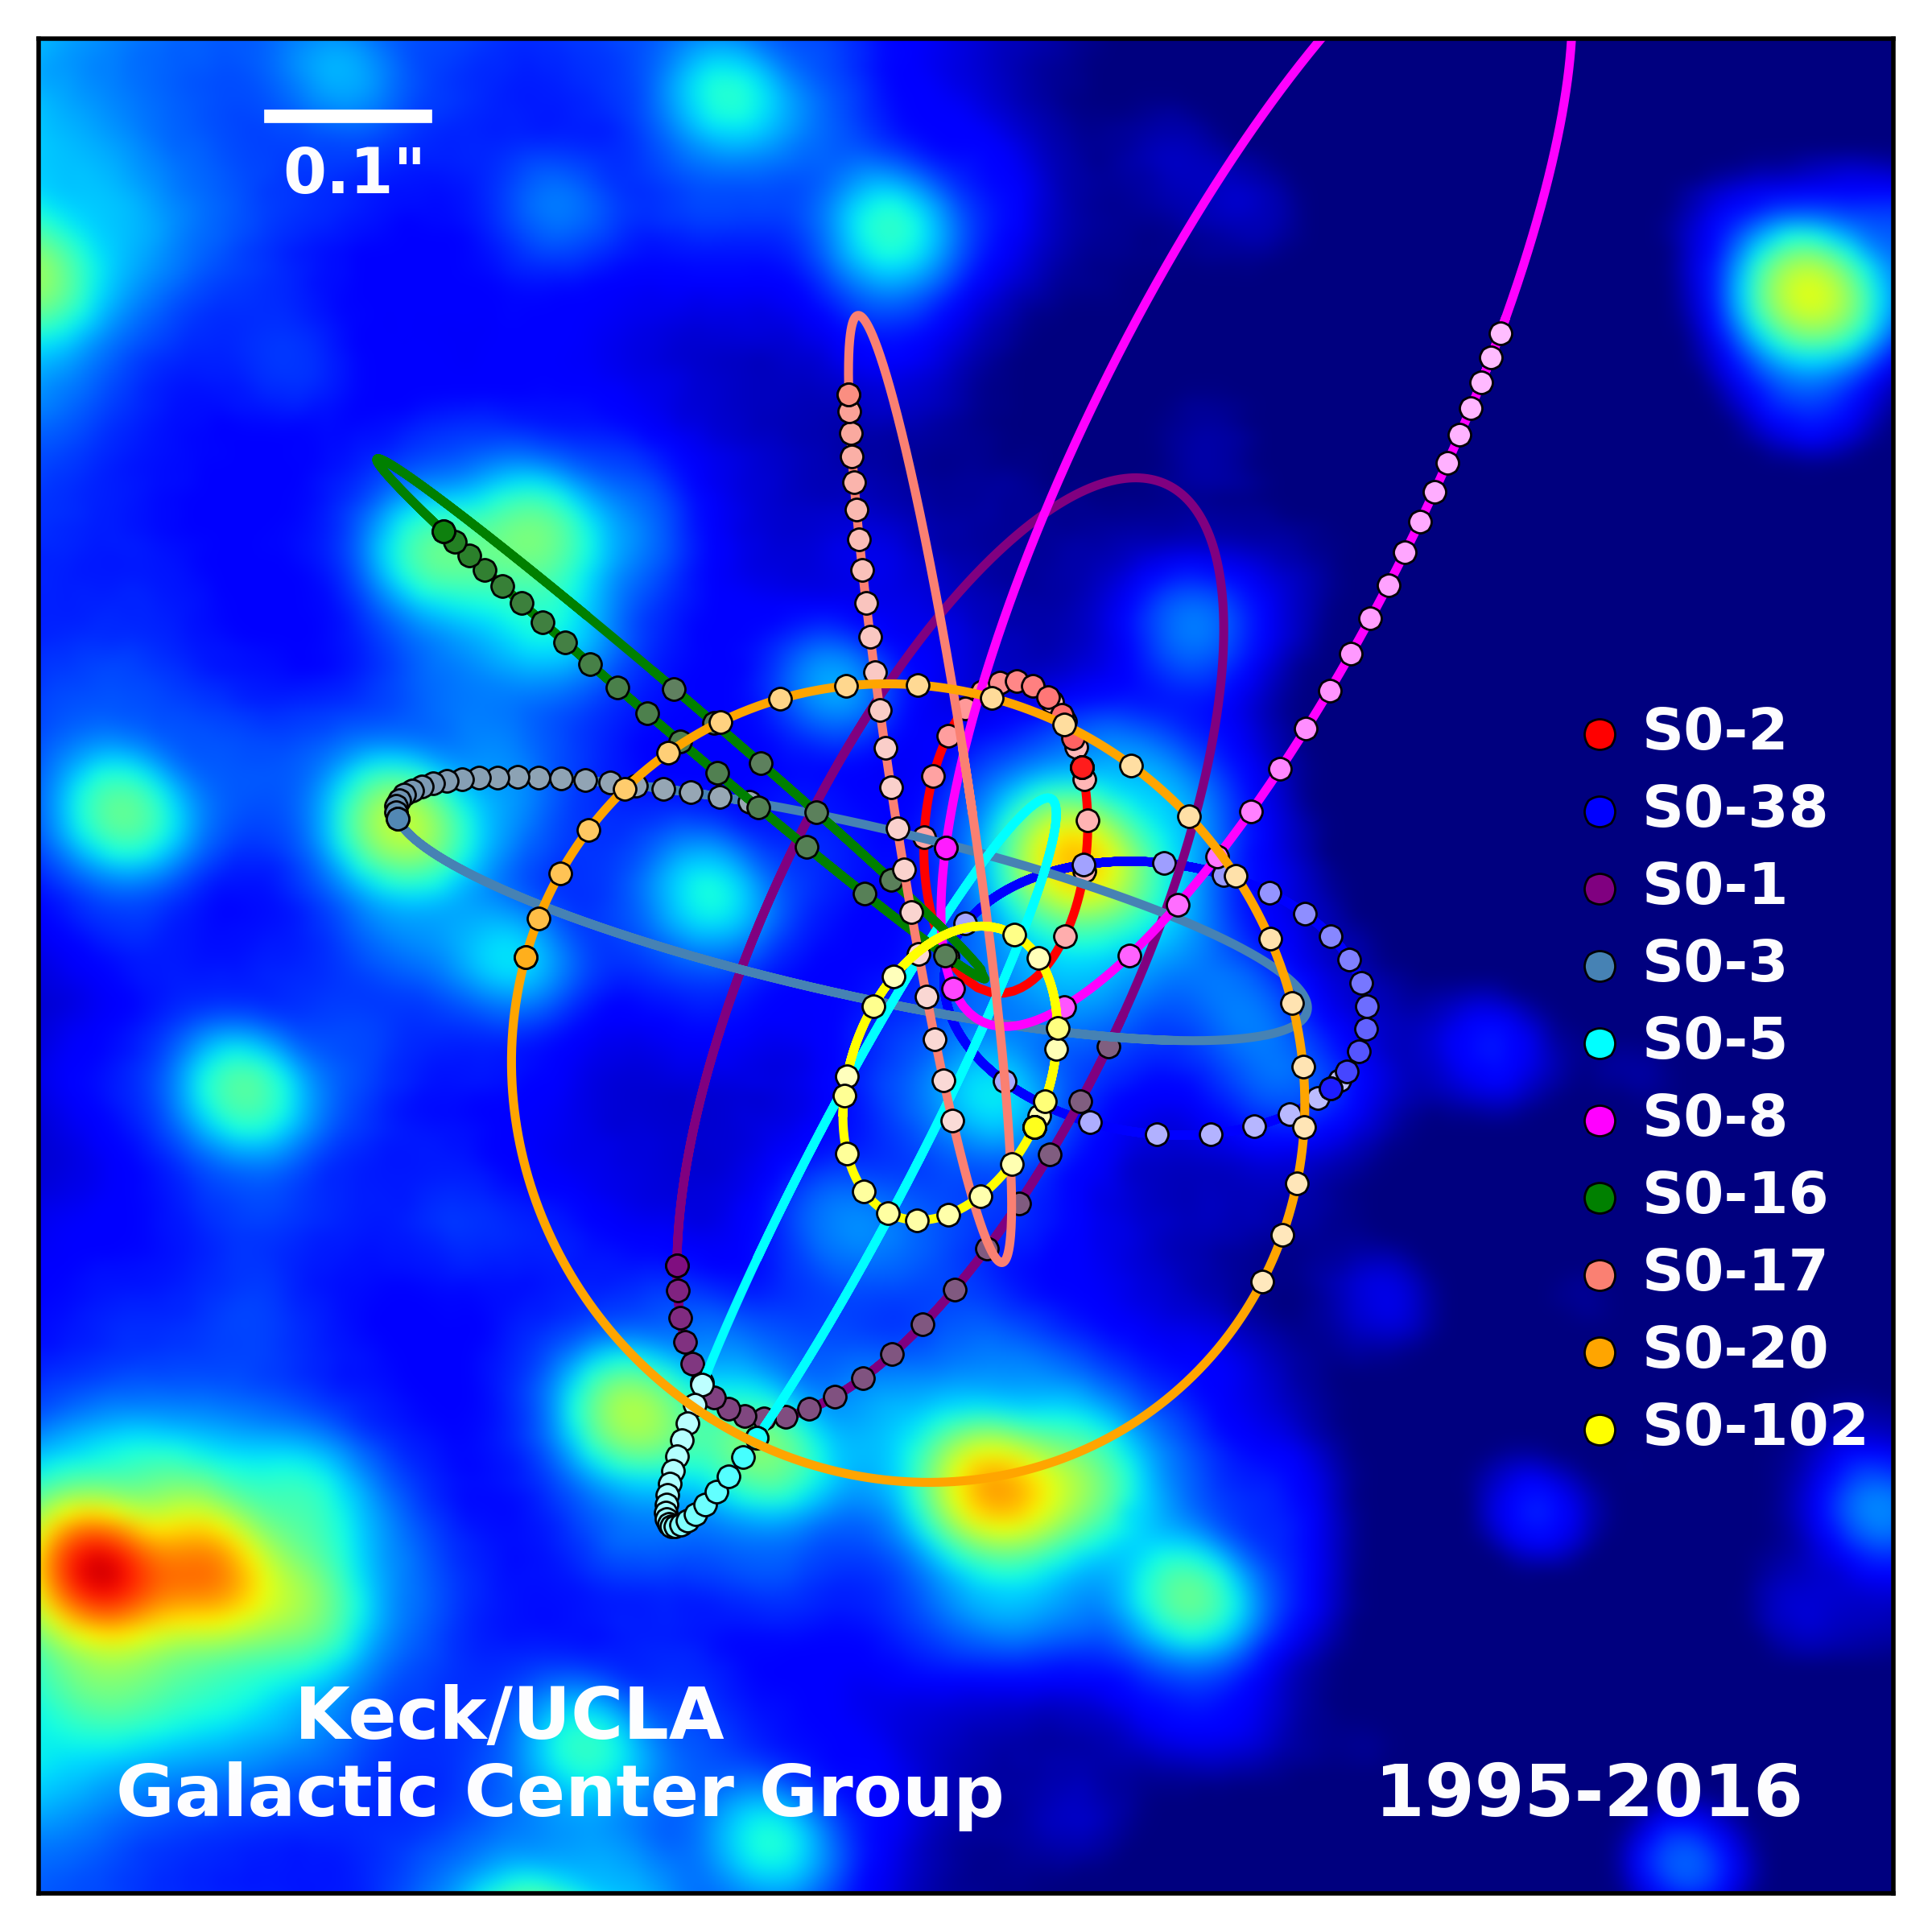
Image courtesy of
UCLA Galactic Center Group
and
W. M. Keck Observatory Laser Team
  Q:  The Earth is roughly 8 kpc from the center of our Galaxy.
          What is the linear size at that distance corresponding
          to the FWHM of 0.08 arcseconds in Keck images?


  Q:  What is the semi-major axis (in AU) of the red orbit "SO-2"
          in the figure?


  Q:  The star "SO-2" has an orbital period of about 16 years.
          What is the mass of the black hole around which it orbits?
Copyright © Michael Richmond.
This work is licensed under a Creative Commons License.