 Copyright © Michael Richmond.
This work is licensed under a Creative Commons License.
Copyright © Michael Richmond.
This work is licensed under a Creative Commons License.
The Compton Effect and inverse Compton Effect
When a gamma ray and an electron meet, they can collide and exchange energy and momentum. Physicist Arthur Holly Compton worked out some of the details of such collisions around 1920; for his work, he was awarded the Nobel Prize in 1927. Scientists often refer to gamma-electron collisions as "the Compton Effect" in his honor.
You can find some notes on the Compton Effect in several places
but let's go over the basics here. Consider (for simplicity) a gamma ray which strikes an initially motionless electron. After the collision, the slightly-less-energetic gamma ray flies off at some angle θ relative to its initial direction, and the electron speeds away at some other angle.
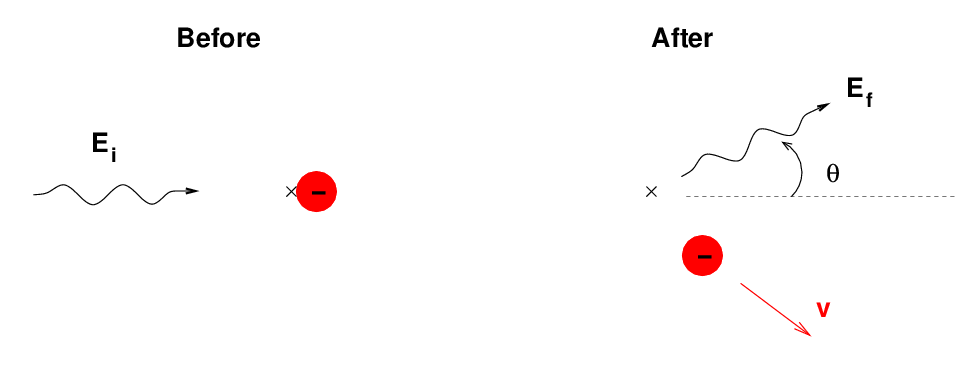
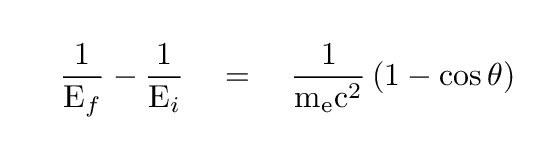
If one writes down the initial and final energy and momenta of these two entities, using the proper relativistic forms, and then demands that both energy and momentum are conserved during the interaction, one can derive a relationship between the initial and final properties of the gamma ray. The exact form depends on which quantity is measured -- energy, wavelength, or frequency. Let's use energy. Then, in general,
  Q:  What angle θ yields the largest transfer
         of energy to the electron?
So, in the regular Compton effect, a "high-energy" gamma ray strikes a "low-energy" (or zero-energy) electron, transferring some of its energy to the particle. But we can also imagine situations in which the reverse happens: a very "high-energy" electron -- moving at relativistic speeds -- runs into a "low-energy" photon, and gives up some of its own energy, converting the photon to a gamma ray.
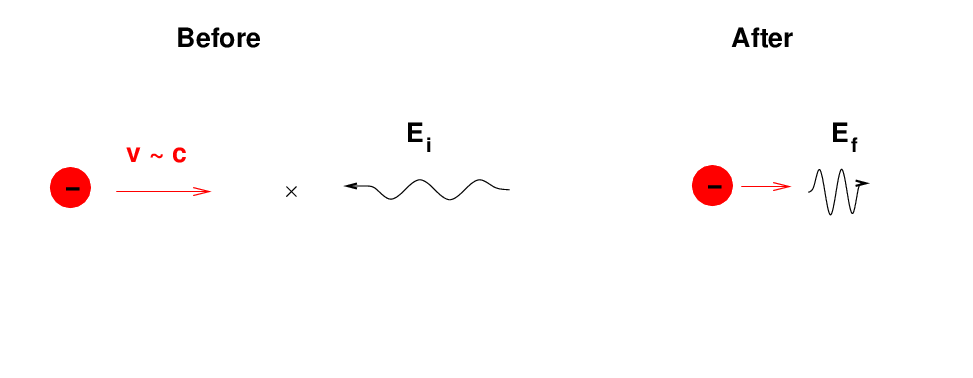
One can use the same old equation to analyze this situation, believe it or not; one must
If one does so, and if one makes the following assumptions (which will be relevant for our situation) that
then one can derive the following expression relating the initial and final energies of the photon:
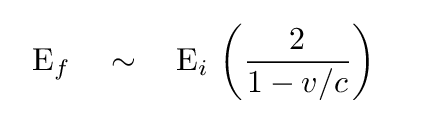
    electron v/c      Ef/Ei       Lorentz factor
   ----------------------------------------------------------
       0.9

       0.99

       0.999

       0.9999
The column "Lorentz factor" above can be calculated from the formula
Markarian 421: The inverse Compton Effect at work
To illustrate the inverse Compton Effect, let's start by examining an ORDINARY galaxy, in which the effect is not active. IC 3998 is an elliptical galaxy in the Coma Cluster. It's not unusual in any way -- just a big conglomeration of stars, as this HST image shows.

When astronomers observe this galaxy at wavelengths across the electromagnetic spectrum, they see this SED (Spectral Energy Distribution):

   Q:  What is the frequency of optical light at a wavelength of 550 nm?

   Q:  What is the wavelength of the right-most symbol in this SED?
           What portion of the electromagnetic spectrum does it mark?
This SED is typical of "ordinary" galaxies, in which the bulk of the radiation is produced by stars and dust: the peak of the emission occurs in the IR and optical, with a steep decline at higher frequencies (UV and X-ray). There is no detectable gamma-ray emission at all.
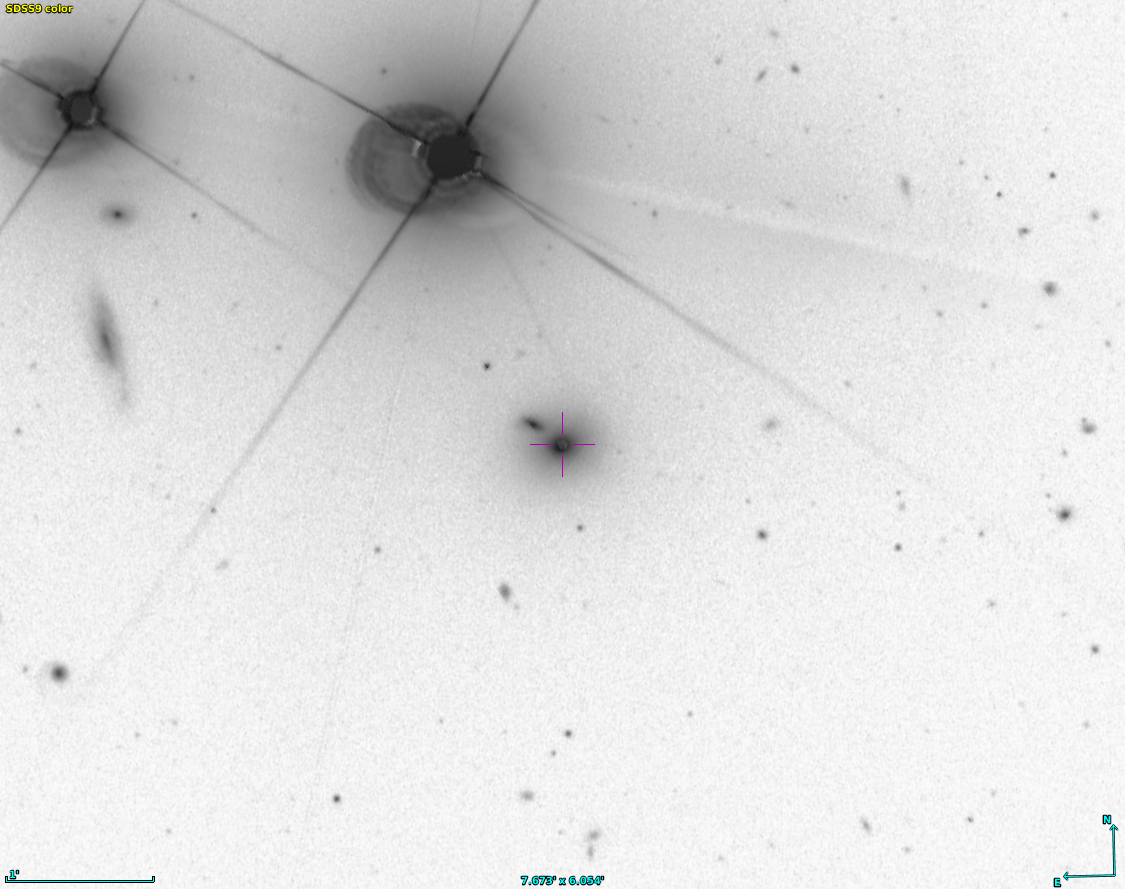
But a few galaxies are different. Consider the galaxy Markarian 421. In the optical, this doesn't seem special: the SDSS shows a very compact galaxy with a bright center.
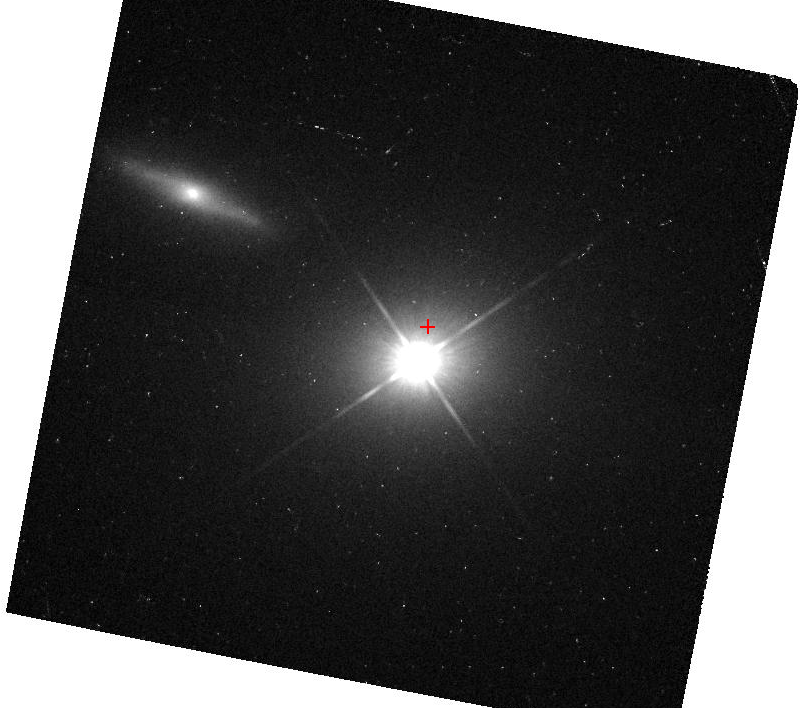
A closeup with HST reveals that the nucleus is VERY compact and bright, outshining the surrounding stars by a large margin.
But Mark 421 is unusually bright at all wavelengths. The spectral energy distribution shows a pretty typical shape on the left --- but what's that on the right?

Spectrum of Markarian 421 courtesy of
Bill Keel
What's happening here is that the galaxy has a supermassive black hole at its center, surrounded by a large accretion disk. Material in the accretion disk emits radiation at all wavelengths, creating a spectrum running from the radio to the X-ray. That's pretty ordinary for an AGN.
But the crazy part is the "copy" of that ordinary spectrum in the right-hand side of the plot. The copy has the same shape as the original, but is shifted to much higher energies. We think that ultra-relativistic particles in a jet -- which is pointed right at the Earth -- are smashing into "ordinary" photons from the accetion disk. Those particles multiply the energy of the ordinary photons by a large factor via the inverse Compton effect.
  Q:  What is the ratio of frequencies of the photons?

                      freq of scattered photon
            R    =   -------------------------
                      freq of original photon


  The ratio of energies (Ef/Ei) is the same as this ratio of frequencies.


  Q:  Estimate the velocity of particles in the jet

  Q:  What is the Lorentz factor of these particles?
One type of gamma ray detector,
called a scintillation detector,
employs Compton scattering of gamma rays inside
a tranparent crystal -- often NaI = sodium iodide --
in order to record the presence and
(to some degree)
the energy of incident gamma rays.
The basic idea is:
The lower-energy gamma ray usually escapes the crystal,
leaving our story, but
the energetic electron zooms through the crystal,
bumping into atoms as it goes.
How many visible-light photons are emitted as a result
of a single gamma ray entering the crystal?
Well, we can get a rough idea by considering the energies:
We can detect the visible-light photons by surrounding the crystal
with
photomultiplier tubes.
Now,
these visible-light photons will fly off in all directions,
so they don't preserve the direction of the original gamma ray.
However, the number of visible-light photons created
DOES depend on the energy of the original gamma ray,
so our measurements do provide a rough idea
of the gamma ray's energy.
Many of the instruments sent aboard satellites to record
gamma rays in space are scintillation detectors.
For example,
the
Compton Gamma Ray Observatory (CGRO) ,
one of NASA's four "great observatories",
contained several experiments based on
scintillation detectors.
The Burst and Transient Source Experiment (BATSE)
involved 8 individual detectors
at the corners of the spacecraft,
spaced to cover the entire sky.
Each unit contained one disk of NaI,
about 50 cm in diameter
and 1 cm thick, to register low-energy (20 keV - 2 MeV) gamma rays,
plus a second, smaller-but-thicker disk,
which extended the range to about 8 MeV.
Behind the disks were three PMTs (for the large disk)
and one more PMT (for the small disk),
to register the flashes of visible light created inside the crystal.
The good news is that BATSE could (and did) detect many sources;
the bad news is that it could not really figure out their
location very well.
When more than one detector registered
a source,
then the ratio of fluxes could give some very rough
indication of the position on the sky,
to perhaps a few degrees ...
but that was about it.
And that's a generic problem with gamma-ray telescopes
on satellites:
it's difficult to measure the positions of sources,
let alone create images.
A more recent gamma-ray satellite takes a different approach,
and does manage to measure angular positions more accurately.
The Large Area Telescope (LAT)
aboard the Fermi Gamma-Ray Telescope
consists (in part)
of a "sandwich" of layers.
Within each layer of the "sandwich"
are several components.
One is a layer of material with big nuclei with many protons and neutrons;
in this case, tungsten.
As a gamma-ray passes through this material,
it may generate electron-positron pairs.
Close to each layer of tungsten
is a layer of electronics which can register
the time and location of charged particles.
So, if a gamma ray enters the detector from above,
it will zoom down through many layers,
creating charged particles as it goes.
The locations of those particles creates a track
delineating the trajectory of the gamma ray.
Follow that track backwards,
and it points to the source of the gamma rays.
How well does this technique work?
Take a look at the LAT performance:
LAT has created a map of sources over the entire
sky over a five-year period.
The map below is drawn in galactic coordinates.
These days,
LAT provides very good locations for gamma ray sources,
good enough that one can take a picture with an optical
or X-ray or radio telescope of exactly the right
region of the sky to find the source.
But back in the early days of gamma-ray astronomy,
that was NOT the case.
Starting in 1991,
when BATSE noticed a large number of very brief,
transient sources -- about one flash per day,
lasting just a few seconds each --
these Gamma Ray Bursts (GRBs)
were intensely interesting,
but also frustrating.
The answer to "what are they?" depended in large part on "where are they?"
Over the next few years, astronomers tried very hard
to find counterparts to the GRBs at other wavelengths.
The "error circles" for each event were so big
that no optical telescopes could cover the entire
region of each burst within a few seconds or minutes
after the burst was detected.
For several years, all we knew was that
the bursts were apparently distributed uniformly over
the sky,
Choice A: They might be located in the Milky Way Galaxy;
but if so, they must be relatively close to the Sun,
so that we would not see the lack of sources directly
above and below the plane.
Choice B:
They might be located far, far beyond the Milky Way,
in other galaxies.
But the GRBs were very uniformly distributed --
much more so than local galaxies.
So, if the GRBs really did occur outside the Milky Way,
they must have to be really, really, REALLY far outside
the Milky Way, at "cosmological" distances.
And that would mean that the luminosity of these
brief bursts of radiation would have to be gigantic.
Astronomers settled into two camps:
those who thought the bursts were "galactic"
(inside the Milky Way, at distances of a kpc or two)
and "extra-galactic"
(far beyond the Milky Way, at distances of Gpc or so).
Arguments between the two camps grew strong enough
that Robert Nemiroff, an
astronomer at George Mason and NASA Goddard,
decided to re-create an episode from long ago.
In the 1920s,
there was a similar disagreement on the nature
of spiral nebulae:
some thought they were clouds of gas and dust
within the Milky Way,
perhaps regions where stars were forming;
others throught they were "island universes",
equal in size to our Milky Way and far outside it.
In 1920,
astronomers staged a
"Great Debate"
in the Smithsonian's Natural History Museum between two champions:
Harlow Shapley, on the side of "local",
and
Heber Curtis, on the side of "distant".
In 1995,
Nemiroff invited
astronomers to return to the same auditorium in
Washington, DC, to hear the case for each side
of the GRB debate.
Donald Lamb (U Chicago) provided evidence for the
"galactic" side,
while Bohdan Paczynski (Princeton) put forth the case
that GRBs were extragalactic.
I wore a red button.
Scintillation detectors
  Consider a gamma ray of initial energy 1 MeV.  It enters
         a crystal, collides with an electron, and transfers
         half of its energy to the electron.


    Q:   How much energy does the electron initially have?


  Suppose 90% of this energy is dissipated as heat throughout
            the lattice, and 10% is emitted in blue photons
            of wavelength 400 nm.


    Q:   How much energy does a blue photon have?

    Q:   How many blue photons will be emitted from the crystal?
Detecting gamma rays with satellites
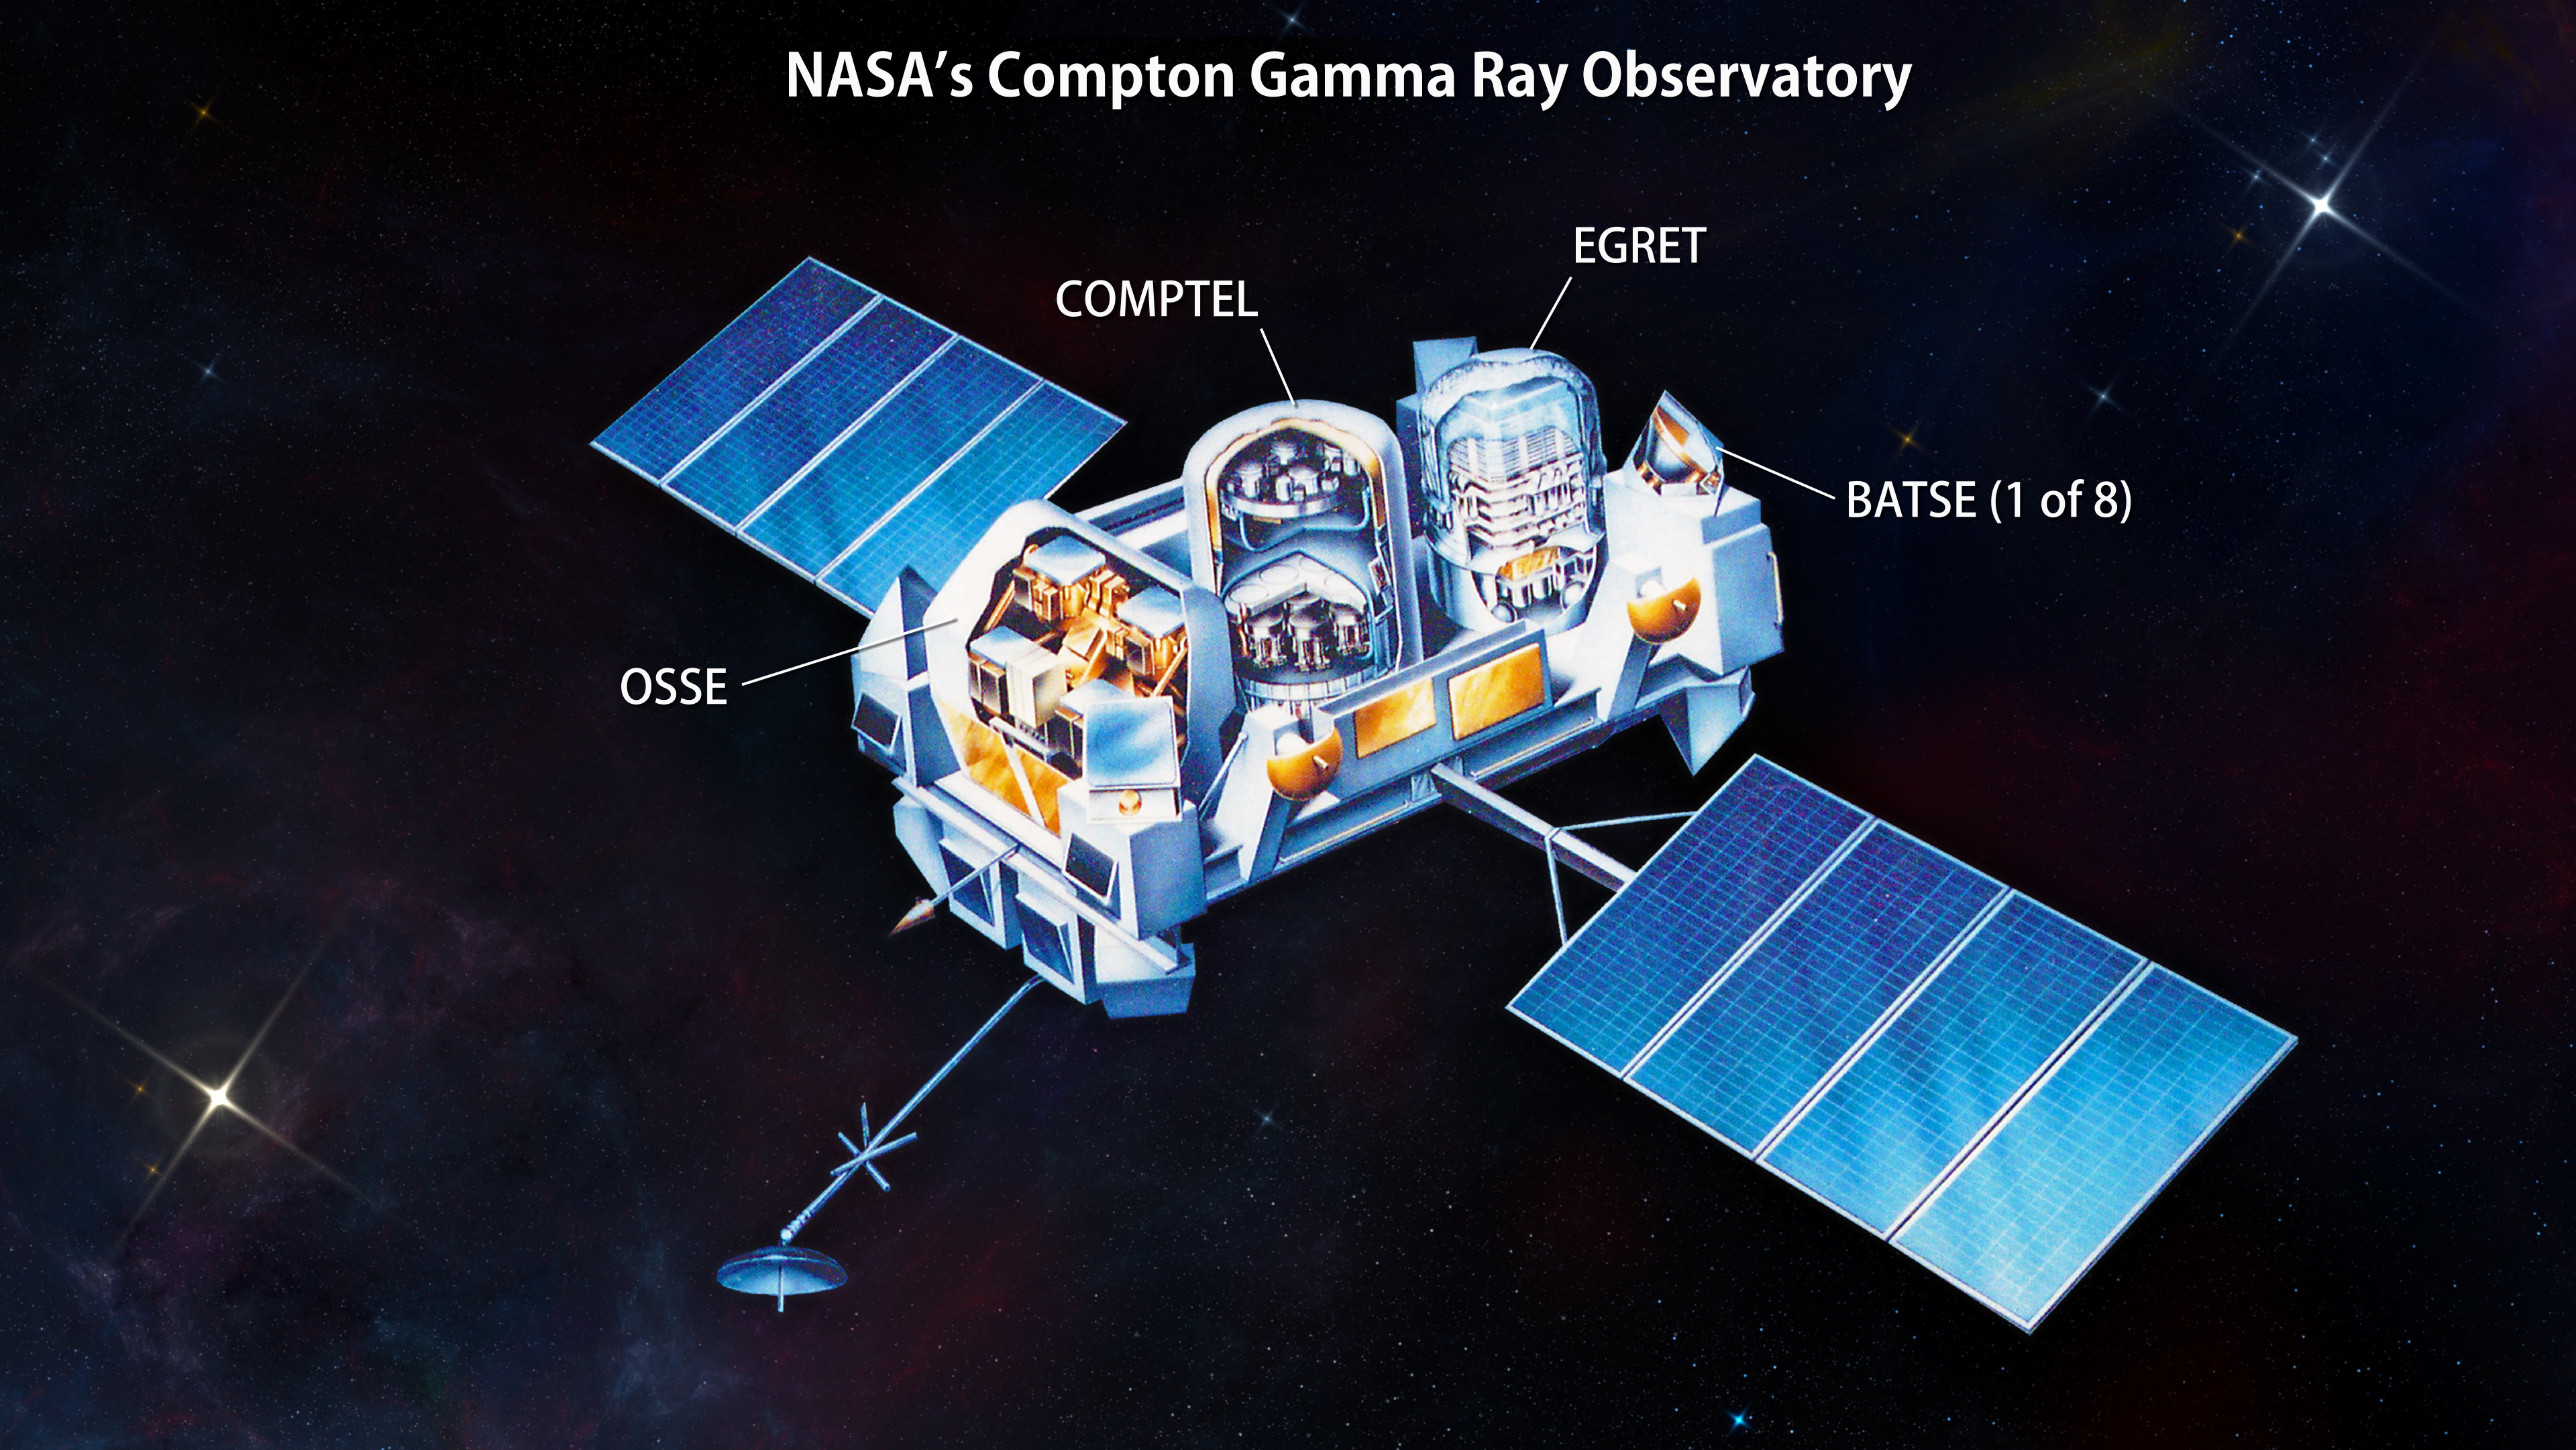
Image courtesy of
NASA and Goddard Media Studios
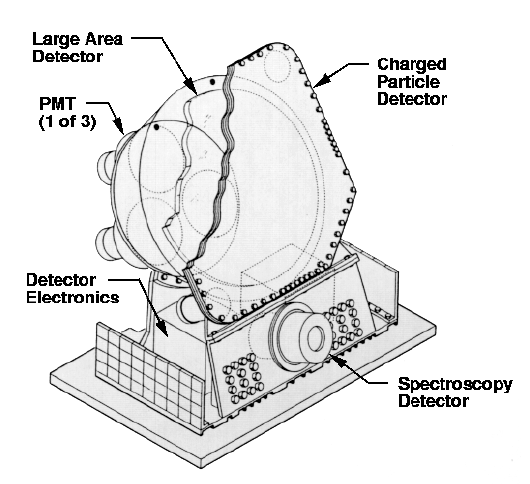
Image courtesy of
The Space Sciences Laboratory at NASA's Marshall Space Flight Center
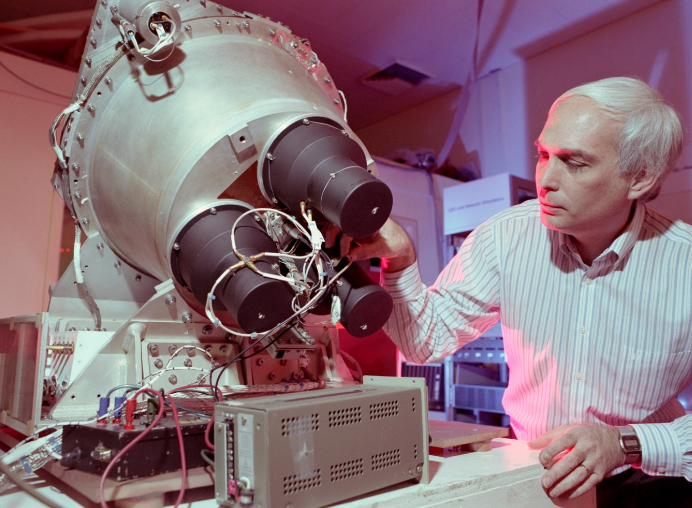
Image of one BATSE unit, from the back,
courtesy of
Fishman et al., NASCP 3137, 26 (1992)
   Q:  Why can't we simply place gamma-ray detectors at
            the focus of a big mirror?
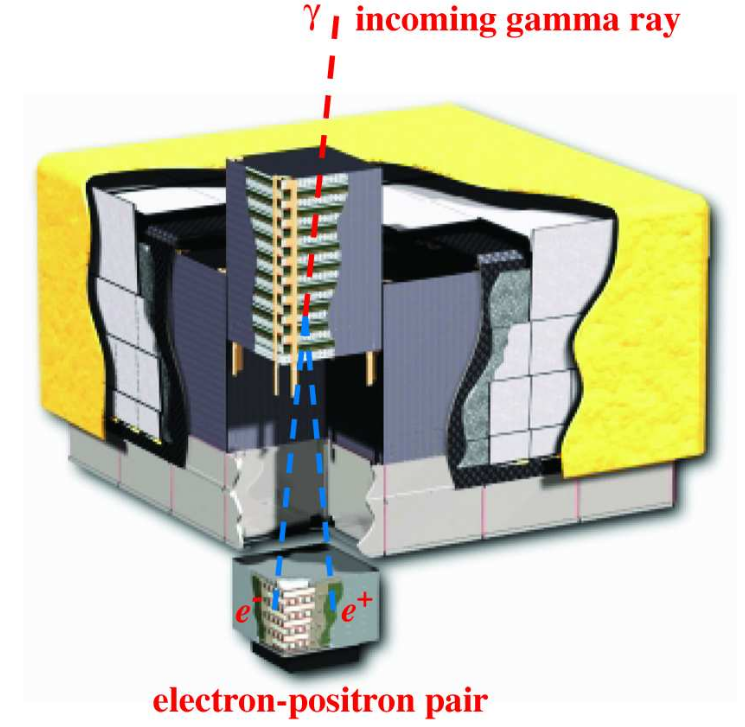
Figure 1 taken from
Atwood et al., ApJ 697, 1071 (2009)
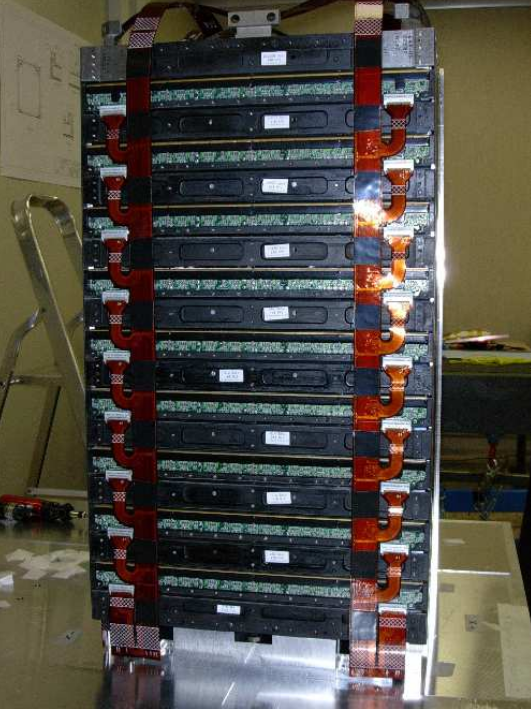
A portion of Figure 4 taken from
Atwood et al., ApJ 697, 1071 (2009)
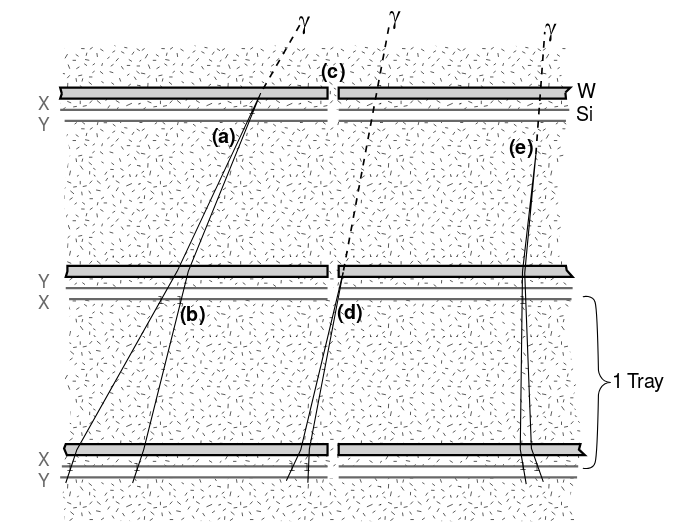
Figure 5 taken from
Atwood et al., ApJ 697, 1071 (2009)
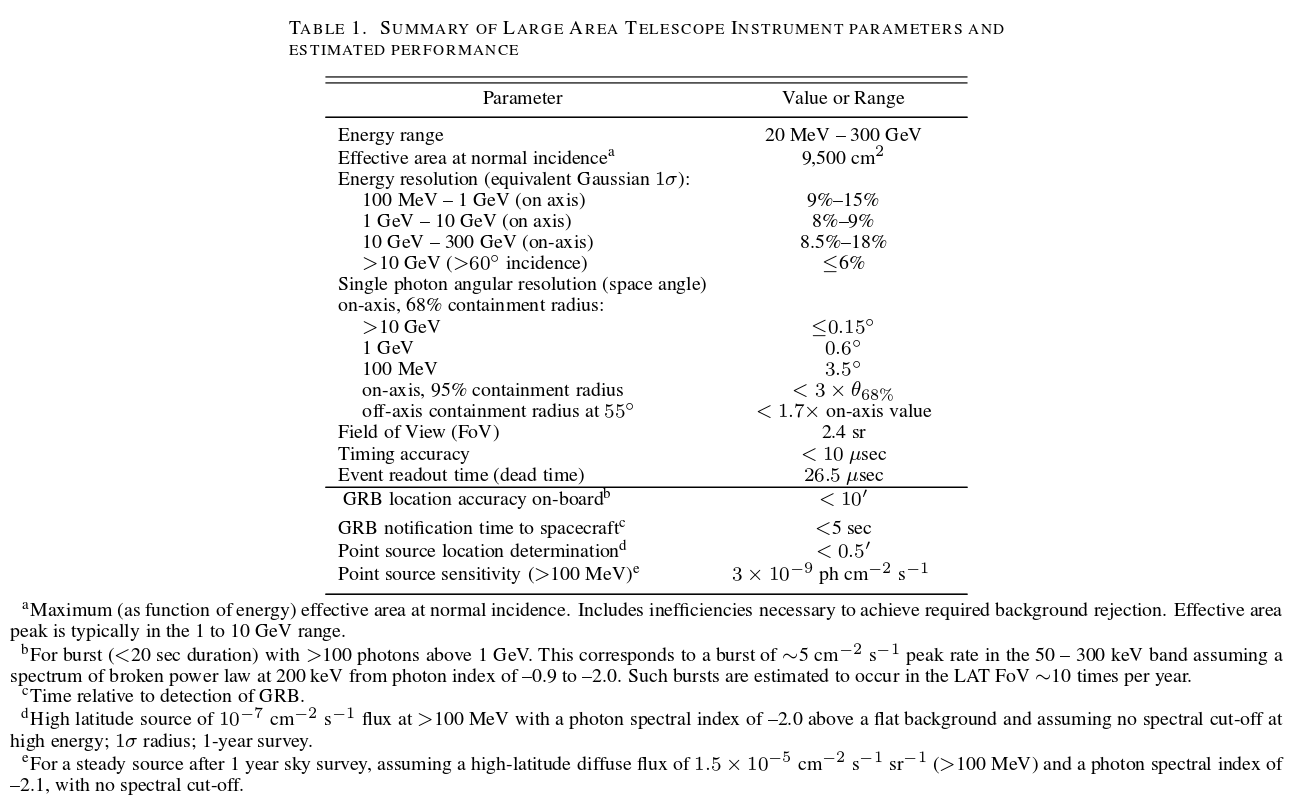
Table 1 taken from
Atwood et al., ApJ 697, 1071 (2009)
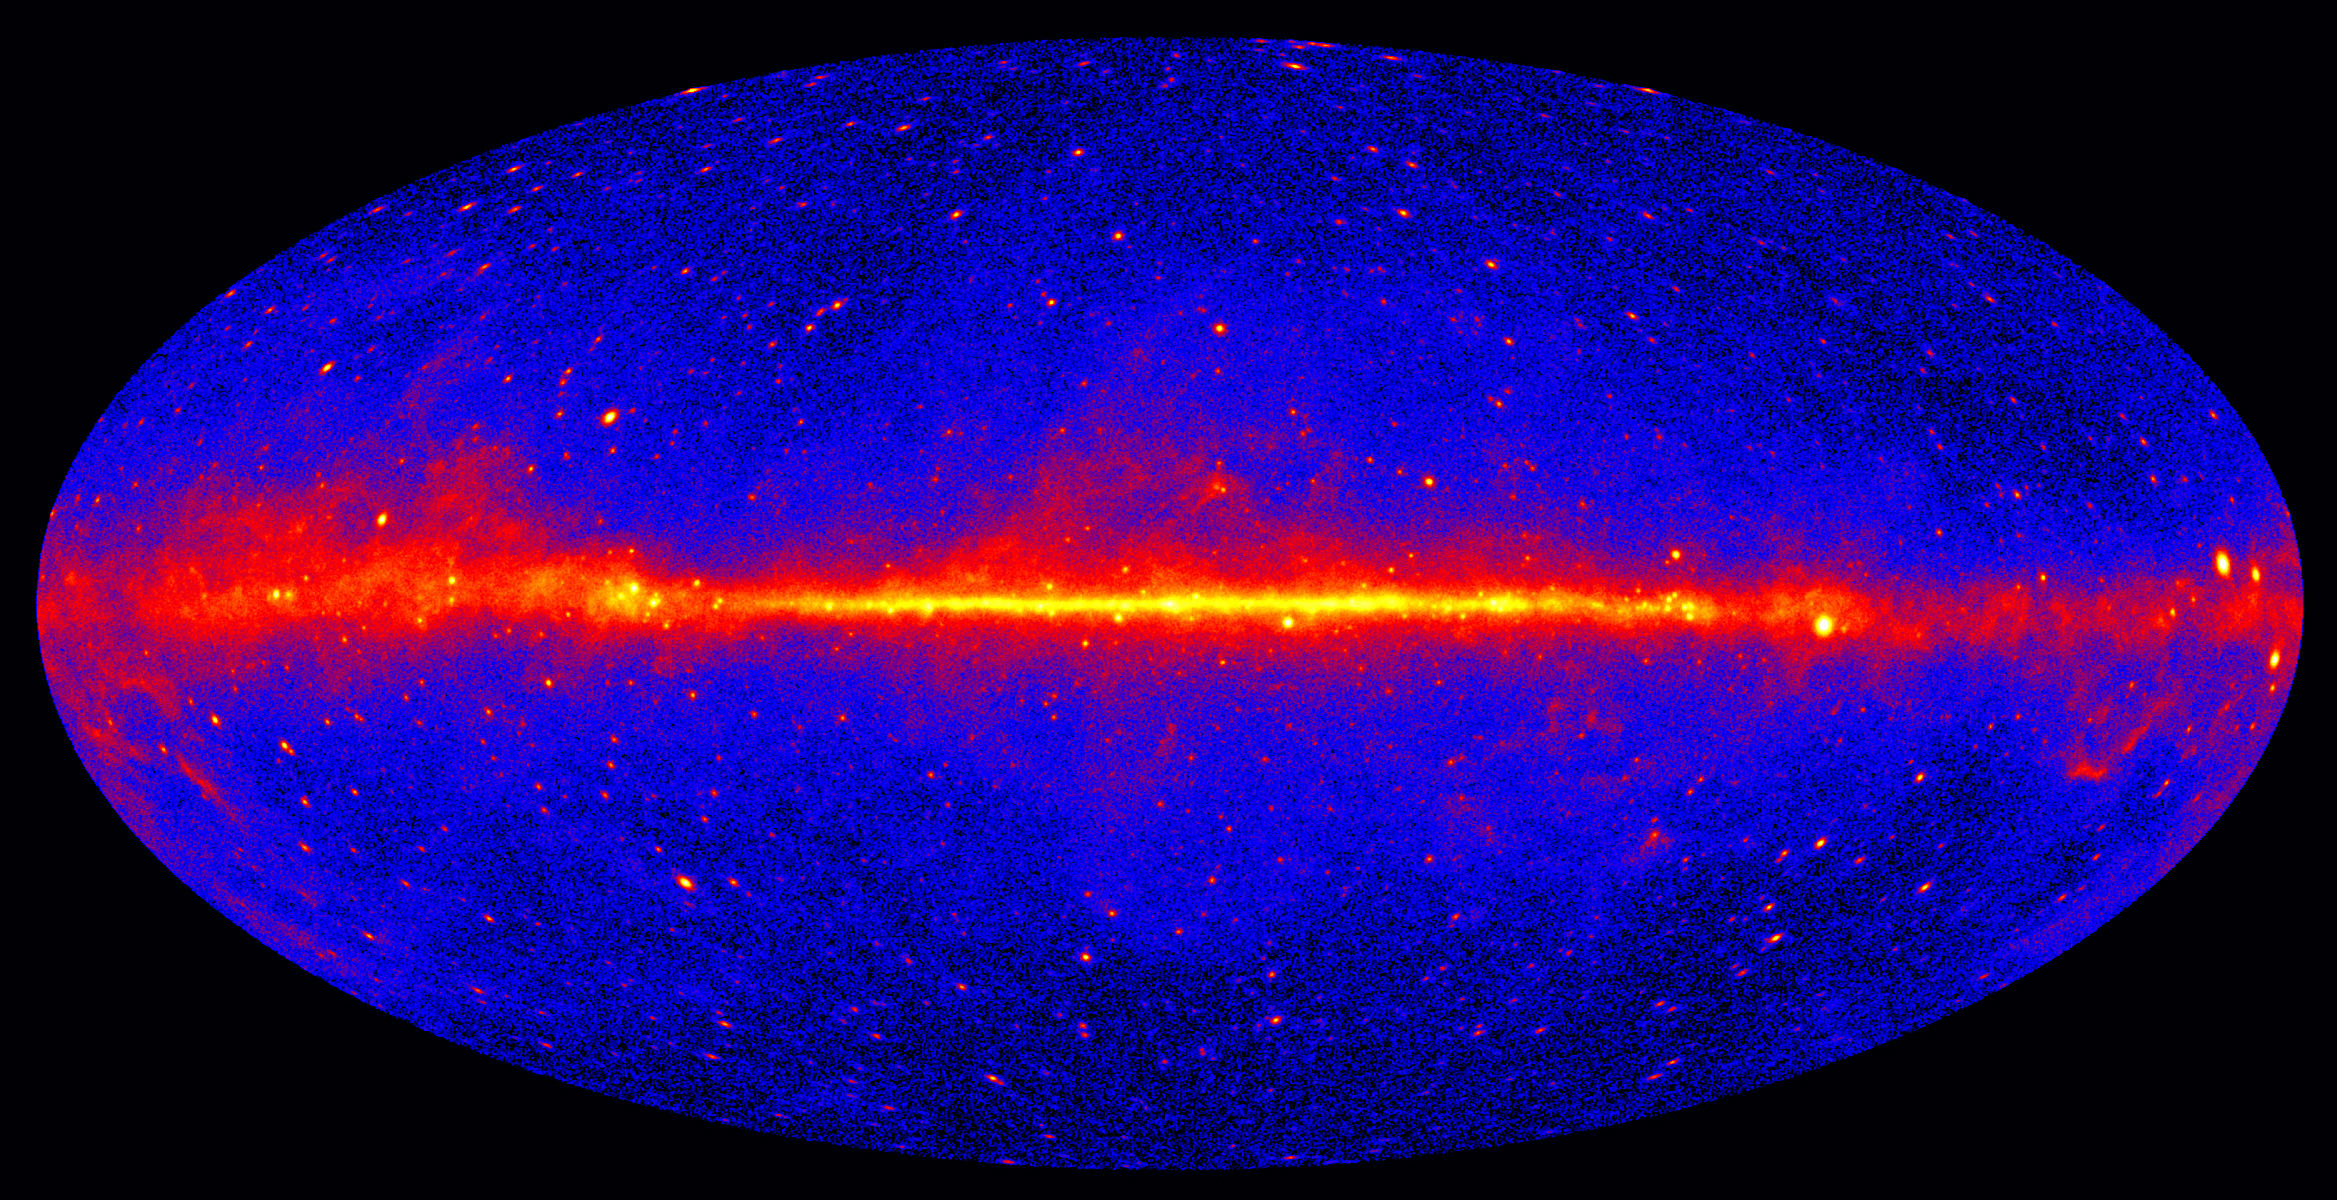
Image courtesy of
NASA/DOE/Fermi LAT Collaboration
Q: What can you tell about sources of gamma rays from this map?
The mystery of Gamma Ray Bursts (GRBs)
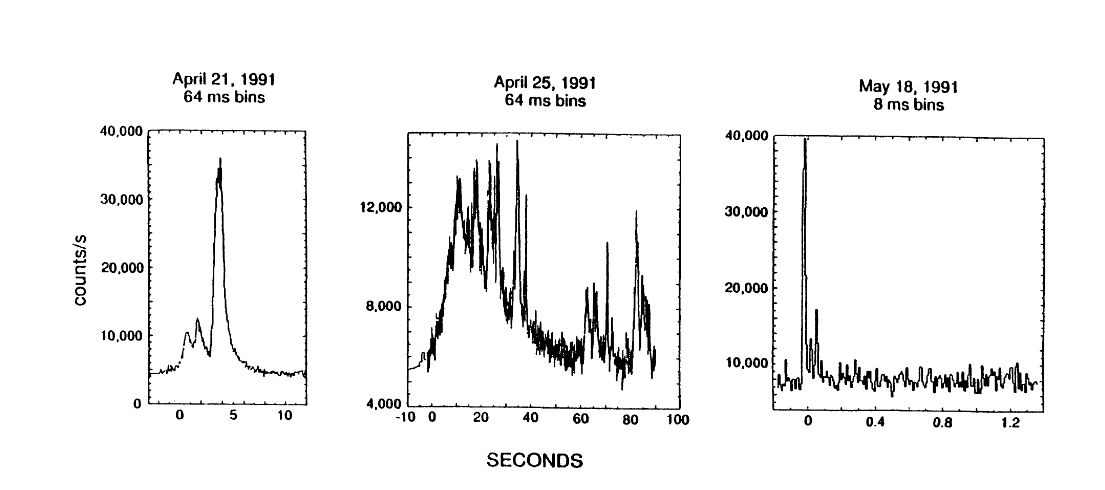
Figure 2 taken from
Fishman et al., NASCP 3137, 26 (1992)
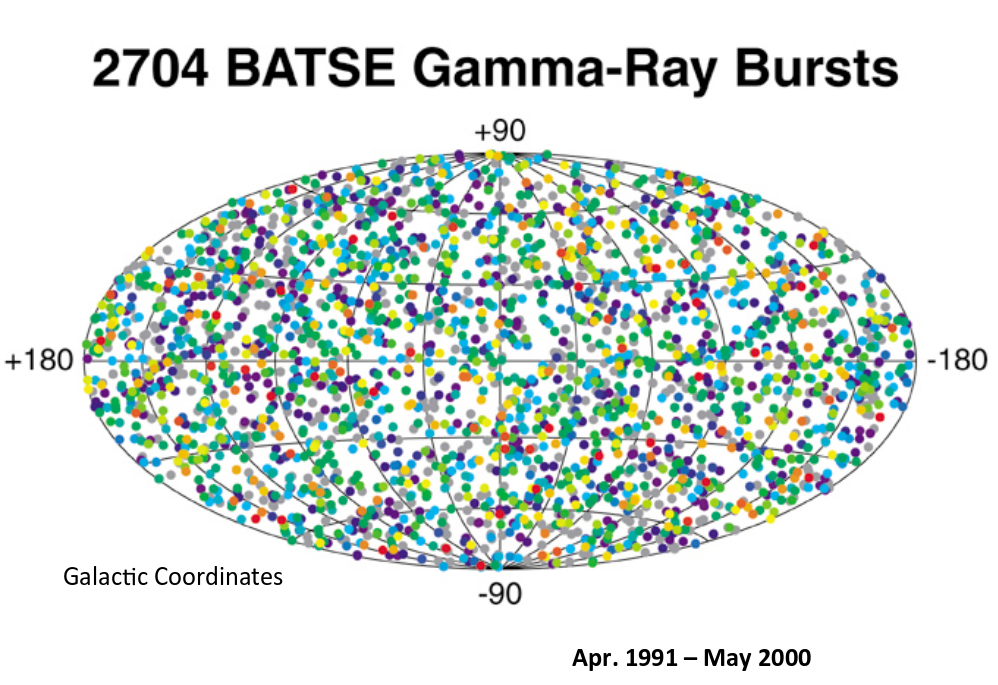
Image courtesy of
A talk on the history of BATSE
by Gerald Fishman (2012)
  Q:  What does this distribution tell us about the possible
           locations of GRBs?

Image courtesy of
A talk on the history of BATSE
by Gerald Fishman (2012)

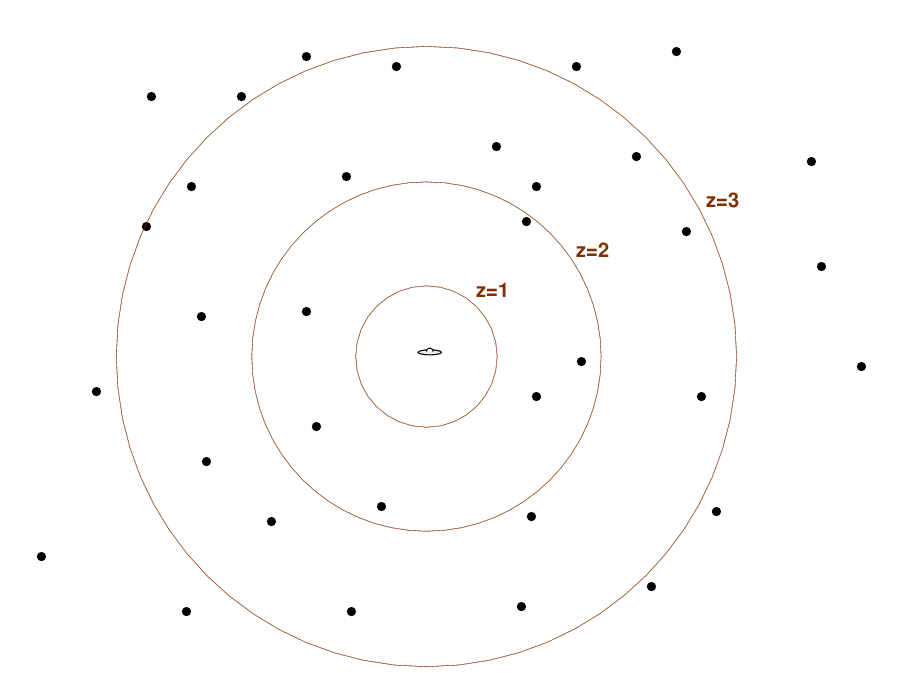
  Q:  How much more energy would a GRB have to radiate
         if it were at 1 Gpc, than if it were at 1 kpc?
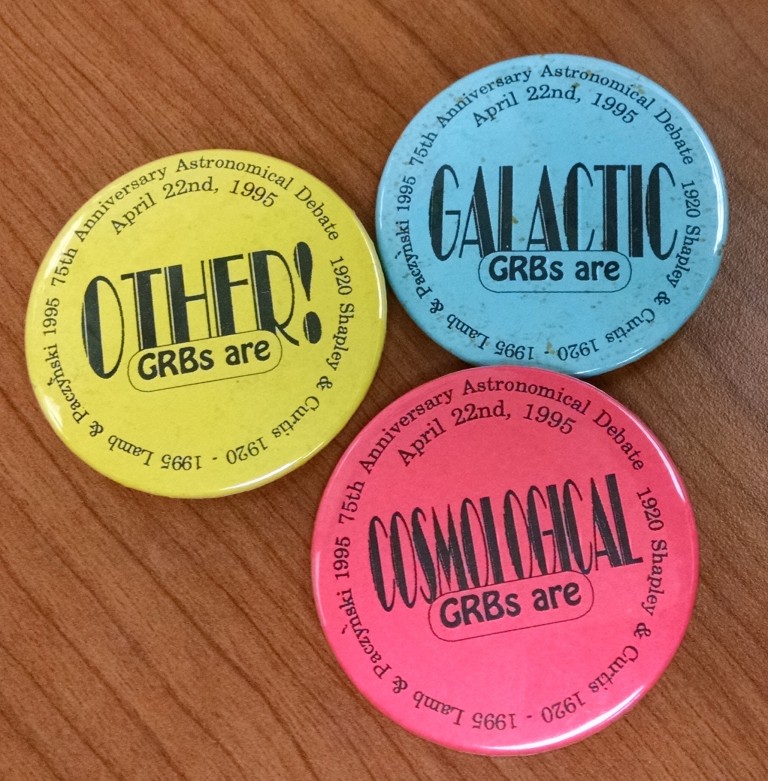
Image courtesy of
NASA/GSFC
For more information
Copyright © Michael Richmond.
This work is licensed under a Creative Commons License.