Calculations of overall system throughput
Michael Richmond
Jan 2, 2017
What fraction of the light entering the WIYN 0.9-m Telescope
is captured and measured by HDI?
The answer to this question can be very important
for observers who are planning an observing run and
trying to estimate the exposure time required to
achieve some particular signal-to-noise ratio on a
certain target.
In order to answer this question, I made use of
images collected by Allyn Smith and Spencer Buckner
of Austin Peay State University on two nights;
comments from night logs are shown below.
- May 10, 2016: "Weather: clear", "excellent night"
- Dec 18, 2016: "Weather: clear to partly cloudy with occasional
mostly cloudy", "Skies were mostly clear for most of the night,
but clouds rolled in around 2am"
The images I'll use from Dec 18 were taken
before midnight, so I believe the sky should have been clear
at that time.
The stars used for these calculations are a pair of
hot subdwarfs, commonly used for spectrophotometric
calibrations:
The observations used for calibration were acquired through the
SDSS ugriz filter set, rather than the Johnson-Cousins UBVRI
filter set.
I'd like to do a set of calculations in the future using the UBVRI
set;
if any reader happens to have an existing dataset which could
be used for this purpose, please let me know.
Starting assumptions
I made the following assumptions for some of the parameters
in the calculations:
- telescope size
-
Primary mirror diameter = 36 inches,
and second mirror diameter = 17 inches.
The former seems pretty obvious from the original name
of the telescope, and the latter is shown in the
detailed drawings listed on the
WIYN 0.9-m Observatory "Technical Information" page.
- mirror reflectivity
-
Direct measurements of the reflectivity from the freshly-cleaned
aluminum surfaces of the actual WIYN 0.9-m mirrors
can be found at
the WIYN 0.9-m "Technical" webpage.
I read values for the 'g' and 'r' passbands from the graph showing
2012 measurements.
However, these measurements only cover the range 400 - 700 nm,
which does not include much of the 'u', 'i', and 'z' passbands.
Therefore, I looked for reflectivity measurements covering
a wide range in other sources.
I settled on measurements of an aluminum coating for the
Gemini South mirrors which is described in
Gemini South's Secondary Mirror Sports Shiny Silver Coat.
The values I adopted for a single reflection are
                     u           g         r          i           z
    --------------------------------------------------------------------
     one bounce    0.910       0.912     0.895      0.875       0.890
    --------------------------------------------------------------------
Of course, I accounted for two reflections in the
calculations.
- atmospheric extinction
-
I didn't have enough data to derive extinction coefficients
from 0.9-m observations themselves,
and I couldn't find any values listed in the literature.
The best I could do was
a set of measurements made at CTIO by Douglas Tucker
in Nov, 2012.
The values taken from this reference are magnitudes per airmass.
                     u           g         r          i           z
    --------------------------------------------------------------------
         k          0.44        0.20      0.10       0.06        0.07
    --------------------------------------------------------------------
- filter passbands
-
One of the steps in the calculations involves computing the
number of photons received from the star Vega.
I used the following versions of the SDSS passbands
for that purpose. Note that each dataset
has a peak transmission value of 1.00, or 100 percent.
In real life, any filters (including those at Kitt Peak)
will have lower peak transmissions.
That means that my "expected" number of photons will be
over-estimates, and thus the derived values
for throughput will be under-estimates.
This error is likely to be largest in the u-band.
- spectrum of Vega
-
One of the steps in the calculations involves computing the
number of photons received from the star Vega.
I used the following spectrophotometric data
for those calculations, based on values
provided by Ralph Bohlin at some point prior to 2006.
vega_spectrum.dat
- standard-star magnitudes
-
I convolved the SDSS passbands with the spectrum of
Vega in order to compute the number of
exo-atmospheric photons which ought to be received from
that star, per second, per square centimeter of
collecting area.
In order to calculate the number of photons received
from the observed stars (which are much fainter than Vega),
I simply scaled this number of photons by a factor
based on the magnitude difference between Vega and the
fainter star:
                              -0.4*( star_mag - Vega_mag)
                factor  =   10
What are the appropriate magnitudes for Vega and the standard
stars in the SDSS system?
For Vega, I adopted those listed by
UBVRI-ZY and ugriz zeropoints from 20 calspec standards,
(Pickles, 2010 HST calibration workshop).
For BD+174708 and BD+262606, I took values from
Smith et al., AJ 123, 2121 (2002).
| star |
u |
g |
r |
i |
z |
| Vega |
0.974 |
-0.093 |
0.148 |
0.372 |
0.513 |
| BD+17 4708 |
10.56 |
9.64 |
9.35 |
9.25 |
9.23 |
| BD+26 2606 |
10.761 |
9.891 |
9.604 |
9.503 |
9.486 |
- instrumental magnitudes
-
The reductions of the images of the standard stars
was pretty basic.
- subtract bias using overscan region
- create median flatfields for each night in each filter
- divide target frames by flatfields
- measure aperture photometry of target star
in circular aperture of radius 10 arcseconds,
with background estimated using an annulus
of radii 12.9 to 17.2 arcseconds
I used the
XVista image analysis package
to carry out these tasks.
-
- counting electrons
-
I converted the number of counts-above-sky within
the aperture into electrons by using a gain value of
gain = 1.3 electrons per count
as derived in, for example,
Technical Note 8.
One minor note: since the first step in dealing with the
raw images was to divide all pixel values by 2
(to keep all data values within the range of 0 - 32767),
I actually multiplied the number of counts within
the aperture by 2*1.3 = 2.6.
Results
There are several ways to express the "throughput" of a telescope
and its detector.
I'll choose two particular definitions:
- electrons counted / photons into telescope aperture
-
This is probably the most widely used choice,
corresponding to a "total system throughput".
Compute the number of photons entering the
front aperture of the telescope during an exposure,
and compare to the number of electrons counted
by the CCD.
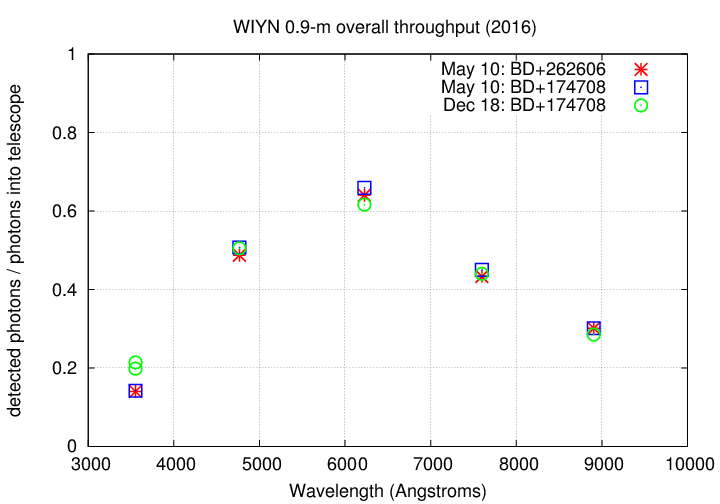
The results for "overall system throughput" are shown below.

Estimates from two different stars, and from two different
nights, agree at the level of a few percent.
The system is most efficient, just above 60 percent,
in the SDSS 'r' band, around 6000 Angstroms. At a guess,
the Johnson-Cousins V and R filters are probably about
equally good.
- electrons counted / photons reaching filter
-
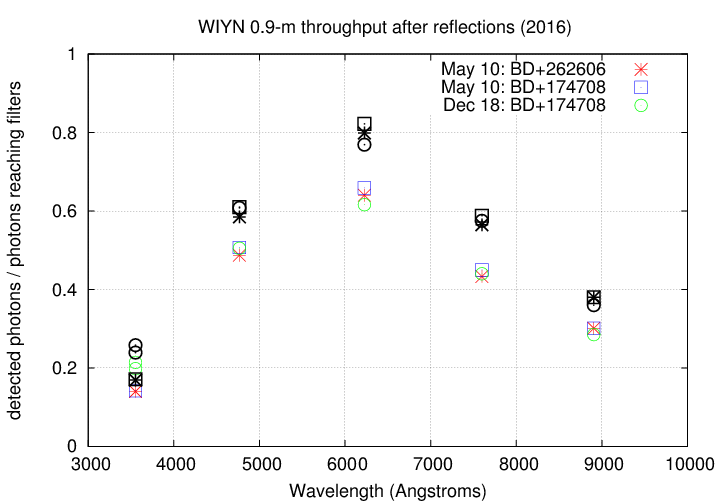
For this version, we try to remove the
light lost due to the two reflections, from the
primary and secondary mirrors.
What remains should be the throughput of
filter(s) + dewar window + CCD
The results for "throughput after reflections" are shown below,
in bold black symbols; the previous, overall-system, values
are shown in lighter, colored symbols.

Since the reflectivity of aluminum decreases
toward the red side of the optical spectrum, we see
the greatest change in the i and z passbands.
The shape of this response is -- not surprisingly --
rather similar to the spectral response of the
e2V 231-84 CCD chip.

