On Oct 19, 2013, Loryn Zachariasen and I took a series of dome flatfield exposures. We used the B-band filter and a constant exposure time of 5 seconds, varying the intensity of the lamp to achieve a wide range of light levels. All images were taken in 4-amp, no-reference-channel mode.
We subsequently took a series of 5-second dark exposures. I create a median master dark frame and subtracted it from each flatfield image.
I then followed the procedure you can find described at these locations
In brief, I measured the mean value of the pixel values within a 200x200 pixel box near the center of the quadrant, and called this the Intensity. I chose two images with similar light levels, scaled the second to match the mean level of the first, then subtracted the second from the first. In this difference image, I measured the standard deviation of pixel values. I then computed a variance value via:
Variance = (stdev)*(stdev) / 2.0where the factor of two accounts for the combination of two images to create a difference.
Finally, I plotted the Variance versus Intensity. We expect a linear relationship, with the slope equal to the inverse gain. That is,
slope = 1 / gain = 1 / (electrons per ADU)
Below is the graph for amplifier 1. The slope of this line is less than 1, implying that the gain is _greater_ than 1 electron per ADU. In fact, a linear fit yields
amplifier 1 gain = 1.27 +/- 0.01
You will note that the intensity level goes only to 22,000 counts, not the full maximum value of 65,000 counts. We did take flatfields which reach close to this maximum value, but I did not include them in this preliminary analysis; the tools I have here can't handle those values. I can do a more comprehensive analysis back at Rochester.
I have computed the gain values for all 4 quadrants, but do not show the graphs for each one here. I can do so at a later time. The values I find are:
    amplifier 1 gain   =   1.27 +/- 0.01
    amplifier 2 gain   =   1.29 +/- 0.01
    amplifier 3 gain   =   1.31 +/- 0.01
    amplifier 4 gain   =   1.35 +/- 0.01
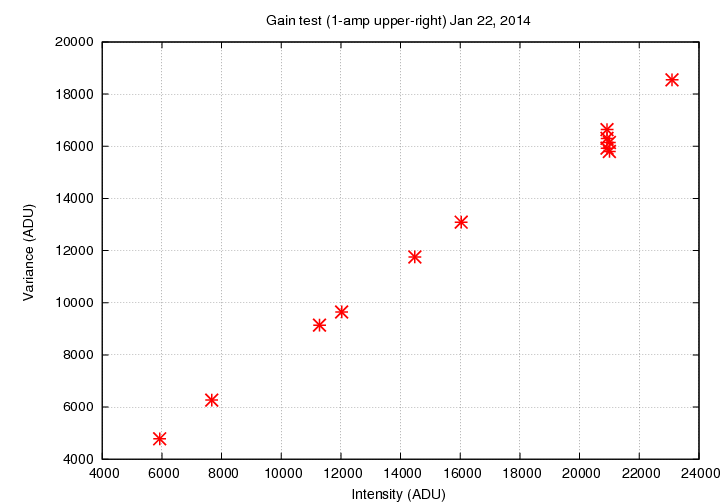
I used their dataset, and the procedure described above, to compute the gain of this single amplifier in 1-amp readout mode. Below is the graph for this single amplifier. A linear fit yields
amplifier 1 gain = 1.32 +/- 0.07